Managing lease data manually often creates confusion, delays, and reporting errors. However, when you use a structured system, you gain instant visibility into rent, deposits, escalation, and maintenance costs. Therefore, businesses today prefer smart dashboards instead of scattered spreadsheets.
That is exactly why the Lease Management Dashboard in Excel becomes extremely valuable.
This ready-to-use Excel dashboard helps property managers, finance teams, real estate companies, and facility managers monitor lease performance in one interactive view. Moreover, because it works inside Microsoft Excel, you do not need any expensive software.
In this detailed guide, you will learn everything about the Lease Management Dashboard in Excel, including its features, pages, benefits, and best practices.
Click to Purchases Lease Management Dashboard in Excel
What Is a Lease Management Dashboard in Excel?
A Lease Management Dashboard in Excel is an interactive reporting tool that tracks and analyzes lease-related data such as:
-
Active lease percentage
-
Monthly and annual rent
-
Security deposits
-
Escalation percentages
-
Maintenance costs
-
Property performance by region and city
Instead of checking multiple files, you can monitor all lease KPIs in one place. As a result, decision-makers can quickly identify trends, risks, and opportunities.
Most importantly, this dashboard uses pivot tables and dynamic charts, which means you can easily refresh the data whenever new records arrive.
Why Do Businesses Need a Lease Management Dashboard?
Many organizations still manage leases using manual registers or basic spreadsheets. However, this approach creates several problems.
For example:
-
Teams struggle to track lease renewals
-
Finance teams miss escalation updates
-
Maintenance costs become hard to monitor
-
Management lacks real-time visibility
Therefore, a structured dashboard becomes essential.
Key reasons to use it:
-
✔ Centralized lease monitoring
-
✔ Faster decision-making
-
✔ Better cost control
-
✔ Improved occupancy insights
-
✔ Professional reporting
Consequently, companies that adopt lease dashboards usually improve operational control very quickly.
Key Features of Lease Management Dashboard in Excel
The Lease Management Dashboard in Excel includes powerful yet easy-to-use features. Let us explore them one by one.
🧭 Page Navigator (Left Side)
First of all, the dashboard includes a Page Navigator on the left side. This feature allows users to jump between analytical pages instantly.
Because of this:
-
Users save navigation time
-
Reports look professional
-
Non-technical users can operate easily
Moreover, this structure matches enterprise-level dashboard design standards.
📊 Total Pages in the Dashboard
This Excel dashboard contains 5 fully interactive analytical pages:
-
Overview Page
-
Property Type Analysis
-
Region Analysis
-
City Analysis
-
Month Analysis
Additionally, the file includes:
-
✔ Support Sheet
-
✔ Data Sheet
Now, let us understand each dashboard page in detail.
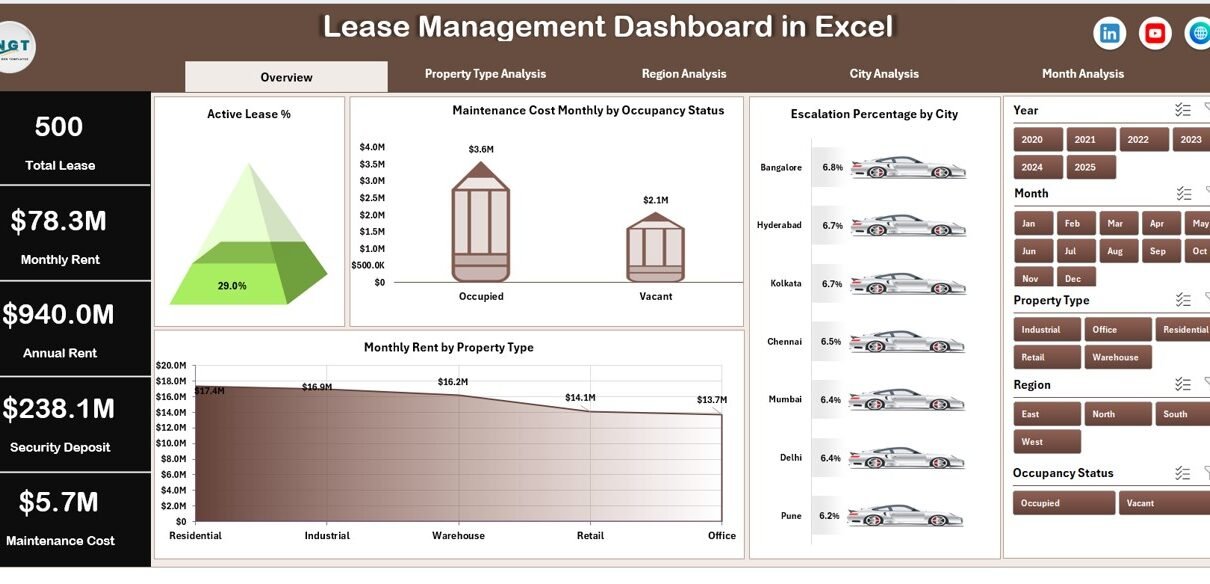
📈 Overview Page – What Does the Main Dashboard Show?
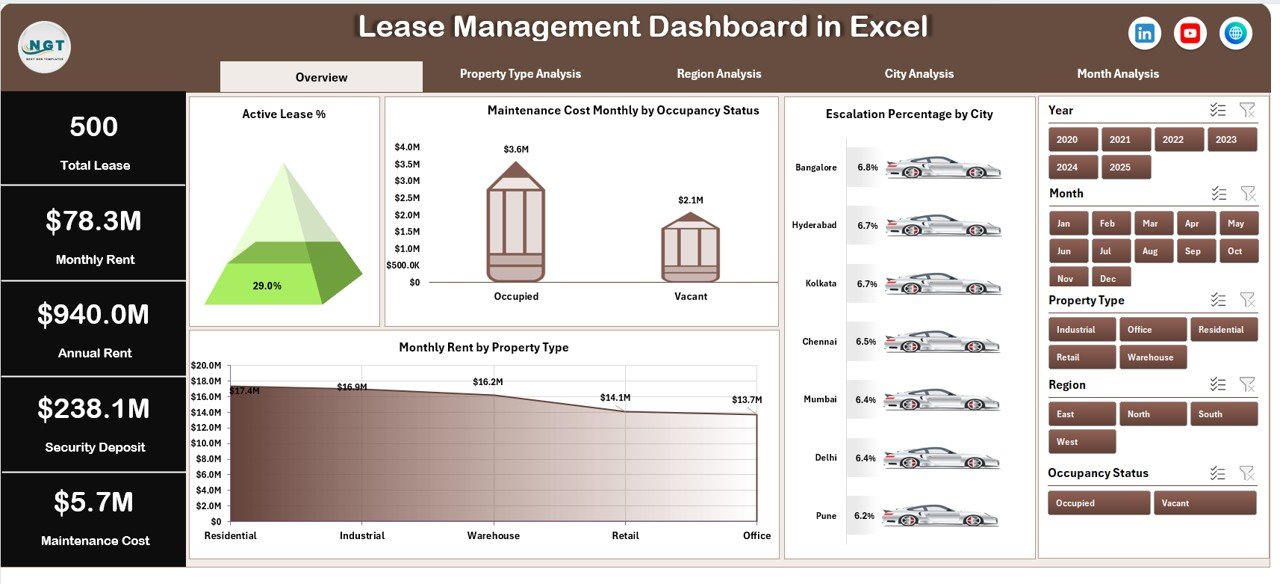
The Overview Page acts as the command center of the Lease Management Dashboard in Excel. As soon as you open the file, this page gives you a quick health check of your lease portfolio.
🔹 Slicer (Right Side)
On the right side, you get an interactive slicer. Because of this filter, users can instantly change the view based on selected criteria.
Therefore, the dashboard becomes dynamic and user-friendly.
🔹 KPI Cards
The overview includes 4 powerful KPI cards that summarize key lease metrics. These cards help management understand performance within seconds.
🔹 Charts on Overview Page
The dashboard displays four insightful charts:
Click to Purchases Lease Management Dashboard in Excel
✅ Active Lease %
This visual shows the percentage of currently active leases. As a result, you can quickly evaluate occupancy health.
Business value:
-
Identify vacant properties
-
Monitor portfolio utilization
-
Support leasing strategy
✅ Maintenance Cost Monthly by Occupancy Status
This chart compares maintenance spending against occupancy status. Therefore, you can detect whether vacant properties still incur high costs.
Why it matters:
-
Control unnecessary expenses
-
Improve property profitability
-
Optimize maintenance planning
✅ Escalation % by City
This visual highlights rent escalation trends across cities. Consequently, management can evaluate which locations generate better growth.
Key insight:
-
Spot high-growth cities
-
Review lease escalation clauses
-
Support pricing strategy
✅ Monthly Rent by Property Type
This chart breaks down rent performance by property category. Because of this, decision-makers can focus on the most profitable property types.
🏢 Property Type Analysis – How Does Property Performance Compare?
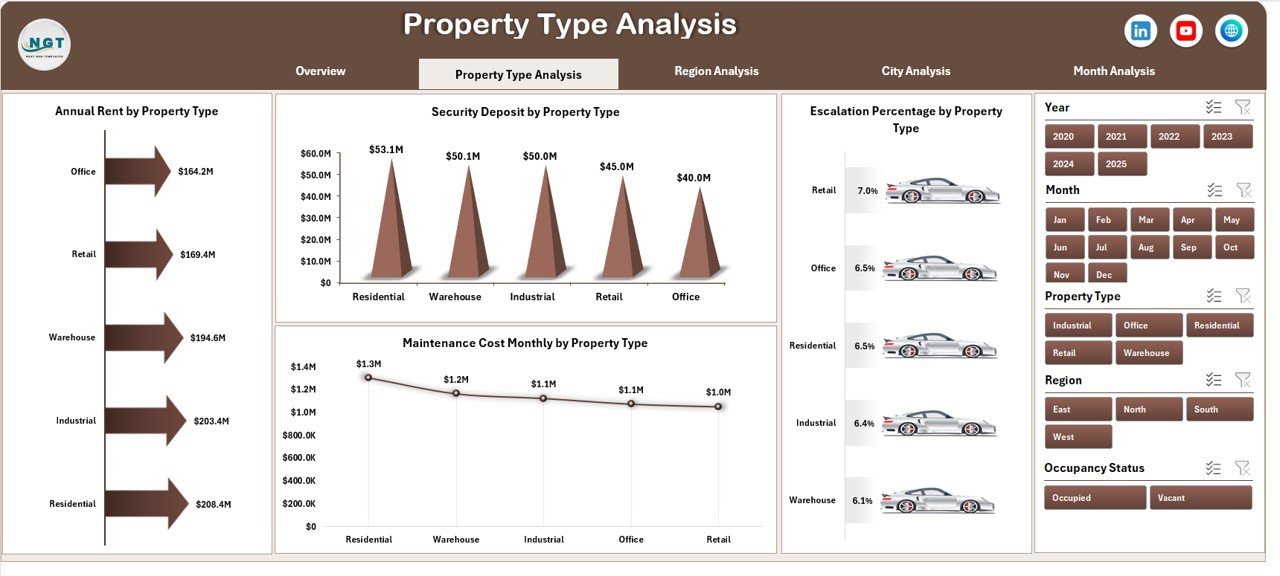
The Property Type Analysis page provides deeper insights by property category. Additionally, the right-side slicer allows quick filtering.
Charts Available:
-
Annual Rent by Property Type
-
Security Deposit by Property Type
-
Escalation % by Property Type
-
Maintenance Cost by Property Type
Why This Page Matters
This page helps you answer critical questions such as:
-
Which property type generates the highest rent?
-
Where does maintenance cost remain high?
-
Which category offers better escalation growth?
As a result, property investors can allocate resources more wisely.
🌍 Region Analysis – How Do Different Regions Perform?
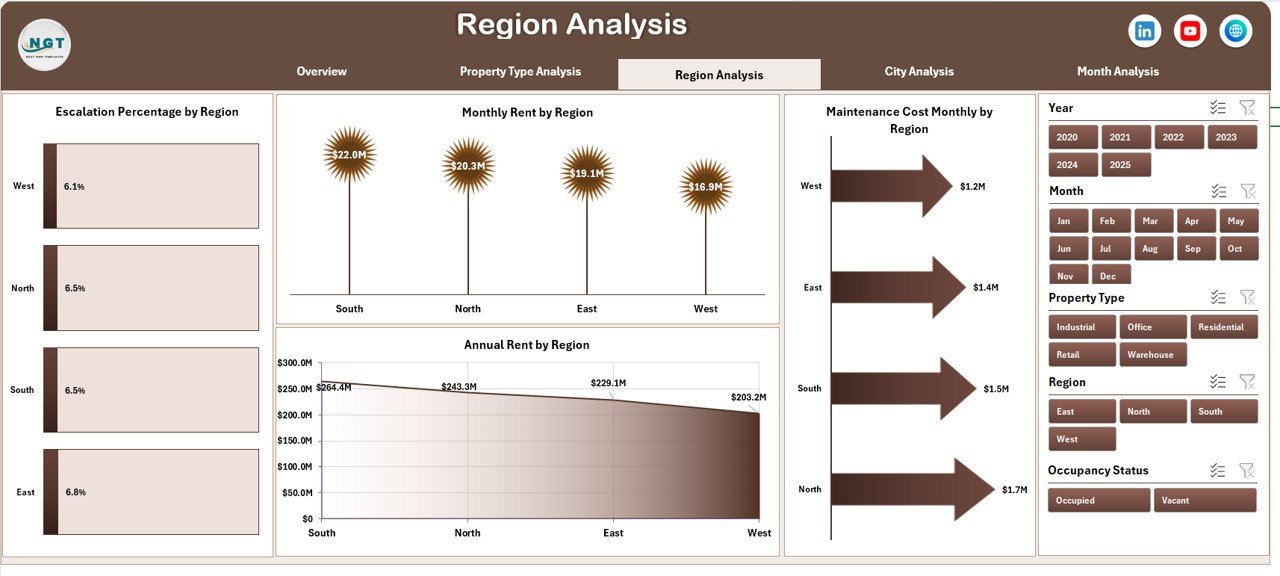
Next, the Region Analysis page compares lease performance across regions. Because regional trends often differ, this view becomes extremely valuable.
Charts Included:
-
Annual Rent by Region
-
Monthly Rent by Region
-
Escalation % by Region
-
Maintenance Cost by Region
Business Benefits of Region Analysis
Click to Purchases Lease Management Dashboard in Excel
With this page, you can:
-
Identify high-performing regions
-
Detect cost-heavy locations
-
Optimize regional investment strategy
-
Support expansion planning
Therefore, regional managers gain clear, data-driven direction.
🏙 City Analysis – Which Cities Drive Maximum Value?
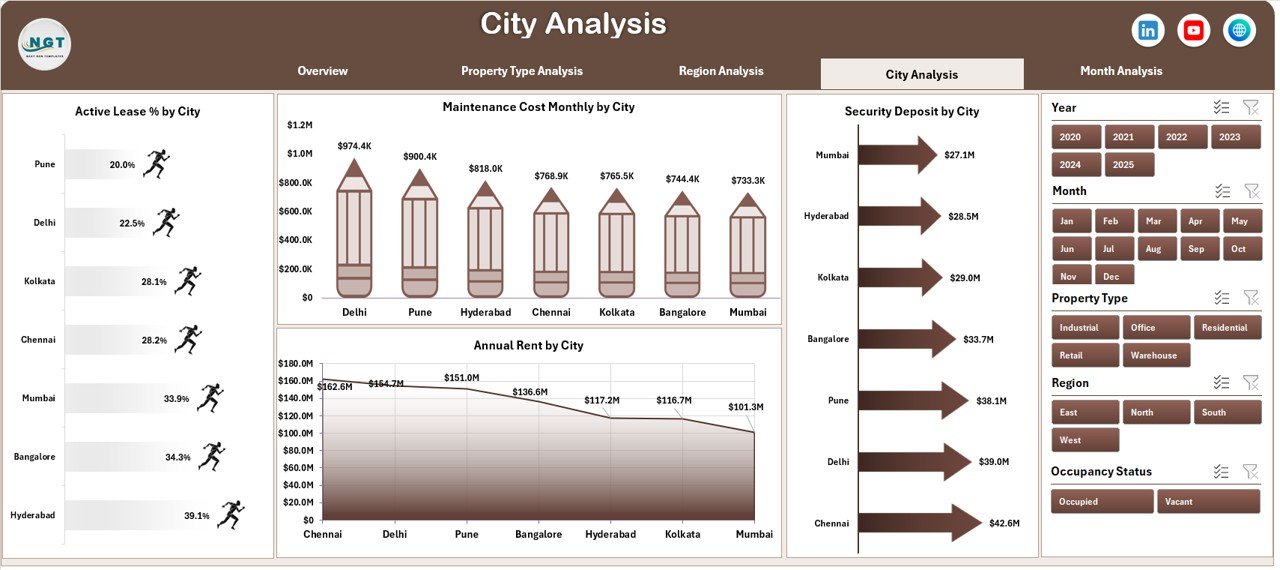
While region analysis gives a broad picture, the City Analysis page provides granular insights.
Available Charts:
-
Annual Rent by City
-
Security Deposit by City
-
Escalation % by City
-
Maintenance Cost by City
Why City-Level Analysis Is Powerful
City-level visibility helps businesses:
-
Spot top-performing cities
-
Review underperforming locations
-
Plan city-wise leasing strategy
-
Control local maintenance costs
Consequently, real estate teams can make smarter micro-level decisions.
📅 Month Analysis – How Do Lease Metrics Trend Over Time?
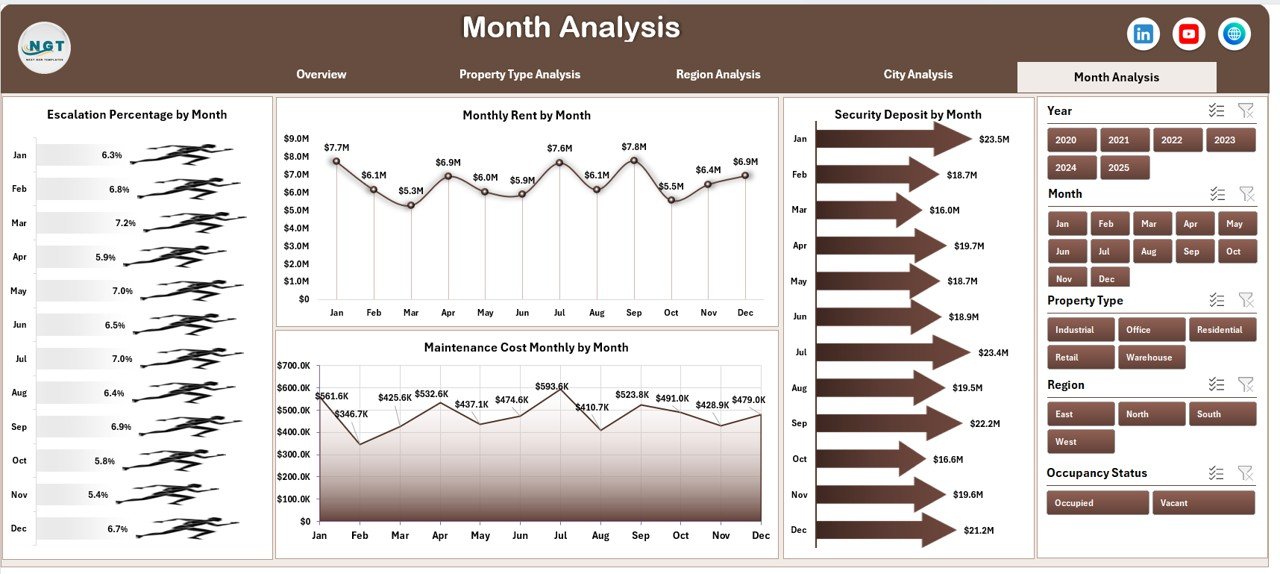
The Month Analysis page focuses on time-based performance. Because trends often reveal hidden problems, this page becomes highly strategic.
Charts on This Page:
-
Escalation % by Month
-
Monthly Rent by Month
-
Security Deposit by Month
-
Maintenance Cost by Month
What Insights Can You Extract?
Click to Purchases Lease Management Dashboard in Excel
This page helps you:
-
Track seasonal rent trends
-
Monitor cost spikes
-
Identify unusual fluctuations
-
Forecast future performance
Therefore, finance teams can plan budgets more accurately.
📂 Support Sheet – What Is Its Role?
The Support Sheet works behind the scenes. Although users rarely interact with it, this sheet powers the dashboard logic.
Typically, it contains:
-
Helper calculations
-
Pivot sources
-
Intermediate formulas
-
Mapping tables
Because of this structured backend, the dashboard runs smoothly.
📊 Data Sheet – Where Do You Enter Lease Data?
The Data Sheet serves as the main data input area.
Here, users capture raw lease information such as:
-
Property details
-
Lease status
-
Monthly rent
-
Security deposit
-
Escalation %
-
Maintenance cost
-
Region and city
Most importantly, once you update this sheet, the entire dashboard refreshes automatically.
Advantages of Lease Management Dashboard in Excel
Now let us explore the major benefits of using this dashboard.
🚀 Better Visibility
-
Monitor all leases in one place
-
Track occupancy instantly
-
Review financial performance quickly
⏱ Saves Significant Time
-
No manual report preparation
-
Automatic pivot updates
-
Faster monthly reviews
💰 Improved Cost Control
-
Identify high maintenance properties
-
Track cost by region and city
-
Optimize spending decisions
📊 Professional Reporting
-
Interactive charts
-
Executive-ready visuals
-
Clean dashboard layout
🔄 Fully Dynamic and Scalable
-
Easy data refresh
-
Works with pivot tables
-
Expandable for future data
👥 User-Friendly Design
-
Left-side navigation
-
Right-side slicers
-
Simple Excel interface
Therefore, even non-technical users can operate it confidently.
Best Practices for the Lease Management Dashboard in Excel
To get maximum value, you should follow these proven best practices.
✅ Keep Data Clean
Always ensure:
-
No blank rows
-
Consistent property names
-
Correct date formats
-
Numeric fields without text
Because clean data ensures accurate dashboards.
✅ Update Data Regularly
Click to Purchases Lease Management Dashboard in Excel
You should update the Data Sheet:
-
Monthly at minimum
-
Weekly for large portfolios
-
Daily for enterprise setups
Regular updates keep insights reliable.
✅ Use Consistent Naming
For best results:
-
Standardize region names
-
Keep city spelling consistent
-
Avoid duplicate property types
This practice prevents pivot errors.
✅ Monitor Key KPIs Frequently
Focus especially on:
-
Active Lease %
-
Escalation trends
-
Maintenance spikes
-
Rent performance
Frequent monitoring improves decision speed.
✅ Protect Formula and Support Sheets
Always lock:
-
Support Sheet
-
Pivot areas
-
Formula cells
This step prevents accidental damage.
✅ Create Backup Copies
Before major updates:
-
Save version history
-
Maintain monthly backups
-
Store in secure location
Because data safety remains critical.
Who Can Benefit from This Dashboard?
This Lease Management Dashboard in Excel suits many professionals.
Ideal users include:
-
Real estate companies
-
Property managers
-
Facility management teams
-
Finance departments
-
Leasing consultants
-
Commercial property owners
Therefore, any organization managing multiple leases can gain value immediately.
How Does This Dashboard Improve Decision-Making?
This dashboard transforms raw lease data into actionable intelligence.
Because of its structured visuals, management can:
-
Detect underperforming properties
-
Optimize rent strategies
-
Control maintenance budgets
-
Improve occupancy planning
-
Support expansion decisions
As a result, businesses move from reactive management to proactive control.
Conclusion – Why Should You Use the Lease Management Dashboard in Excel?
Managing leases without a structured system creates unnecessary risk. However, when you implement the Lease Management Dashboard in Excel, you gain clarity, speed, and control.
This ready-to-use dashboard delivers:
-
Centralized lease visibility
-
Powerful analytical pages
-
Interactive filtering
-
Professional reporting
-
Easy Excel-based operation
Therefore, if you want to manage leases smarter, reduce costs, and improve decision-making, this dashboard becomes an essential business tool.
Frequently Asked Questions with Answers
❓ What is a Lease Management Dashboard in Excel?
A Lease Management Dashboard in Excel is an interactive reporting tool that tracks lease performance, rent, deposits, escalation, and maintenance costs in one place.
❓ Do I need advanced Excel skills to use this dashboard?
No. The dashboard uses simple slicers, pivot tables, and navigation buttons. Therefore, basic Excel knowledge works perfectly.
❓ Can I add more properties to the dashboard?
Yes. Simply add new rows in the Data Sheet and refresh the pivots. The dashboard will update automatically.
❓ How often should I update the data?
You should update the data monthly at minimum. However, large organizations often update weekly.
❓ Does the dashboard support multiple regions and cities?
Yes. The dashboard includes dedicated Region and City analysis pages for detailed comparison.
❓ Can this dashboard handle large datasets?
Yes. Because it uses Excel pivot tables, it can handle thousands of rows efficiently when maintained properly.
Visit our YouTube channel to learn step-by-step video tutorials