Legal advisory teams handle sensitive matters, tight deadlines, and high-risk decisions every single day. However, many legal departments still rely on emails, spreadsheets, and static reports to track their performance. As a result, visibility drops, compliance risks increase, and leadership struggles to measure legal efficiency.
That is exactly why a Legal Advisory KPI Dashboard in Power BI becomes a game-changing solution.
In this in-depth and SEO-friendly guide, you will learn what a Legal Advisory KPI Dashboard in Power BI is, why legal teams need it, how it works, and how each dashboard page supports legal decision-making. Moreover, you will explore the advantages, best practices, and frequently asked questions related to this dashboard.
By the end of this article, you will clearly understand how this ready-to-use Power BI dashboard helps legal advisory teams move from manual tracking to data-driven legal management.
Click to Purchases Legal Advisory KPI Dashboard in Power BI
What Is a Legal Advisory KPI Dashboard in Power BI?
A Legal Advisory KPI Dashboard in Power BI is an interactive and centralized analytics solution designed to monitor, analyze, and evaluate key legal performance indicators.
Instead of tracking legal metrics in multiple Excel files or emails, this dashboard consolidates all legal KPIs into one structured Power BI file. As a result, legal heads, compliance officers, and management teams gain real-time visibility into legal performance.
Moreover, this dashboard uses Excel as a data source, which makes data entry simple and flexible. At the same time, Power BI converts that data into powerful visuals, trends, and insights.
Why Do Legal Advisory Teams Need a KPI Dashboard?
Legal advisory teams operate under constant pressure. Therefore, they must track performance accurately and consistently. However, manual tracking creates gaps and delays.
A Legal Advisory KPI Dashboard in Power BI solves these challenges effectively.
Common Problems Without a KPI Dashboard
-
Legal KPIs remain scattered across multiple files
-
Management lacks a clear performance overview
-
Target tracking becomes slow and inaccurate
-
Trend analysis takes too much time
-
Reporting consumes valuable legal hours
Because of these issues, decision-making often becomes reactive instead of proactive.
How Does a Legal Advisory KPI Dashboard in Power BI Help?
A Legal Advisory KPI Dashboard in Power BI brings clarity, structure, and speed to legal performance tracking.
It allows legal teams to:
-
Track KPIs monthly and yearly
-
Compare actual vs target performance
-
Analyze trends across time periods
-
Monitor improvement or decline instantly
-
Support leadership with data-backed insights
As a result, legal departments operate more strategically and efficiently.
Key Features of Legal Advisory KPI Dashboard in Power BI
This ready-to-use Legal Advisory KPI Dashboard in Power BI comes with a structured design and powerful analytical features.
The dashboard includes three dedicated pages, each designed to serve a specific purpose.
What Is Included in the Summary Page of Legal Advisory KPI Dashboard?
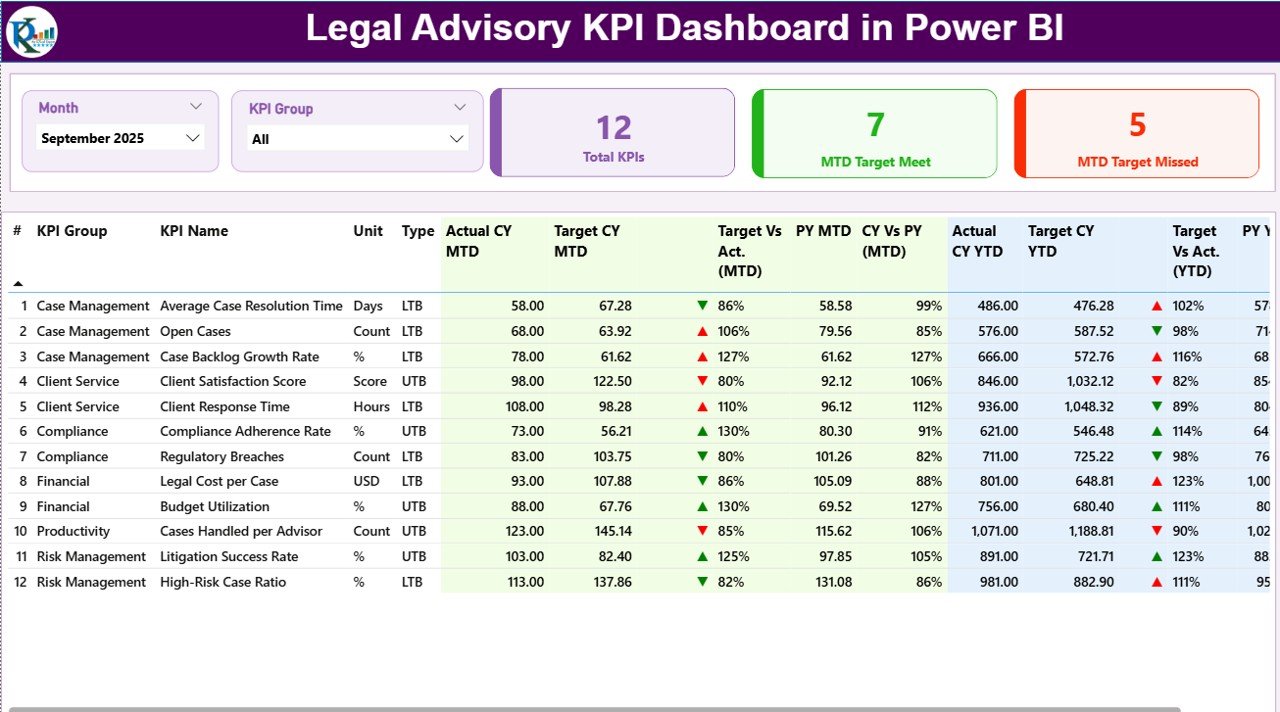
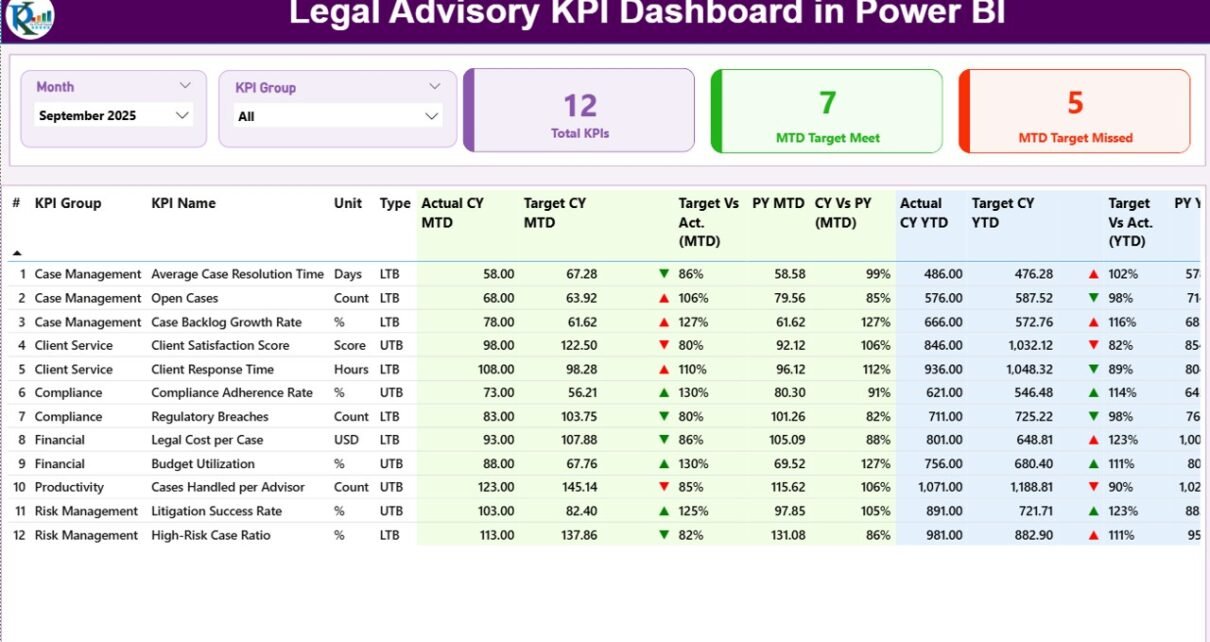
The Summary Page acts as the central control panel of the dashboard. It provides a complete snapshot of legal performance at a glance.
Key Elements of the Summary Page
-
Month Slicer at the top
-
KPI Group Slicer for category-wise filtering
-
Three KPI Cards for instant insights
KPI Cards Explained
-
Total KPIs Count
-
MTD Target Met Count
-
MTD Target Missed Count
These cards instantly show how many KPIs perform well and how many require attention.
Detailed KPI Table in Summary Page
Below the KPI cards, the dashboard displays a detailed KPI performance table.
Each column delivers meaningful insights:
-
KPI Number
Shows the sequence number of the KPI. -
KPI Group
Displays the category or group of the KPI. -
KPI Name
Indicates the name of the legal KPI. -
Unit
Defines the unit of measurement. -
Type (LTB / UTB)
-
LTB (Lower the Better)
-
UTB (Upper the Better)
-
-
Actual CY MTD
Shows the current year’s actual MTD value. -
Target CY MTD
Displays the current year’s MTD target. -
MTD Icon
Uses green ▲ and red ▼ icons to show target achievement. -
Target vs Actual (MTD)
Calculates performance using:
Actual / Target -
PY MTD
Displays the previous year’s MTD value. -
CY vs PY (MTD)
Compares current and previous year MTD. -
Actual CY YTD
Shows actual year-to-date values. -
Target CY YTD
Displays YTD targets. -
YTD Icon
Uses arrows and colors to indicate YTD status. -
Target vs Actual (YTD)
Calculates YTD performance. -
PY YTD
Shows previous year YTD value. -
CY vs PY (YTD)
Compares current YTD with previous YTD.
Because of this structure, users can analyze KPIs quickly and accurately.
How Does the KPI Trend Page Improve Legal Performance Analysis?
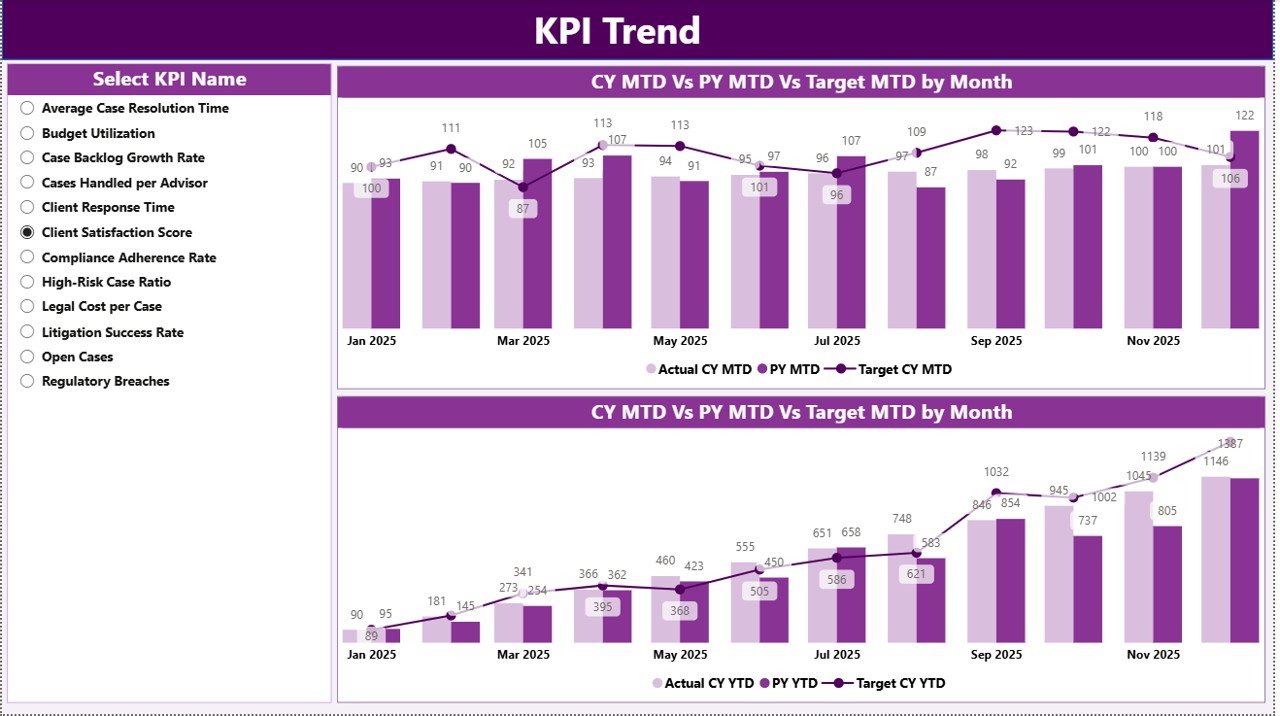
The KPI Trend Page focuses on performance movement over time.
Key Highlights of the KPI Trend Page
-
Two combo charts for trend analysis
-
Displays Actual CY, Actual PY, and Target values
-
Covers both MTD and YTD trends
-
Includes a KPI Name slicer on the left
As a result, legal teams can quickly identify whether performance improves, declines, or stays stable.
Moreover, trend analysis supports strategic planning and early risk identification.
Click to Purchases Legal Advisory KPI Dashboard in Power BI
What Is the Purpose of the KPI Definition Page?
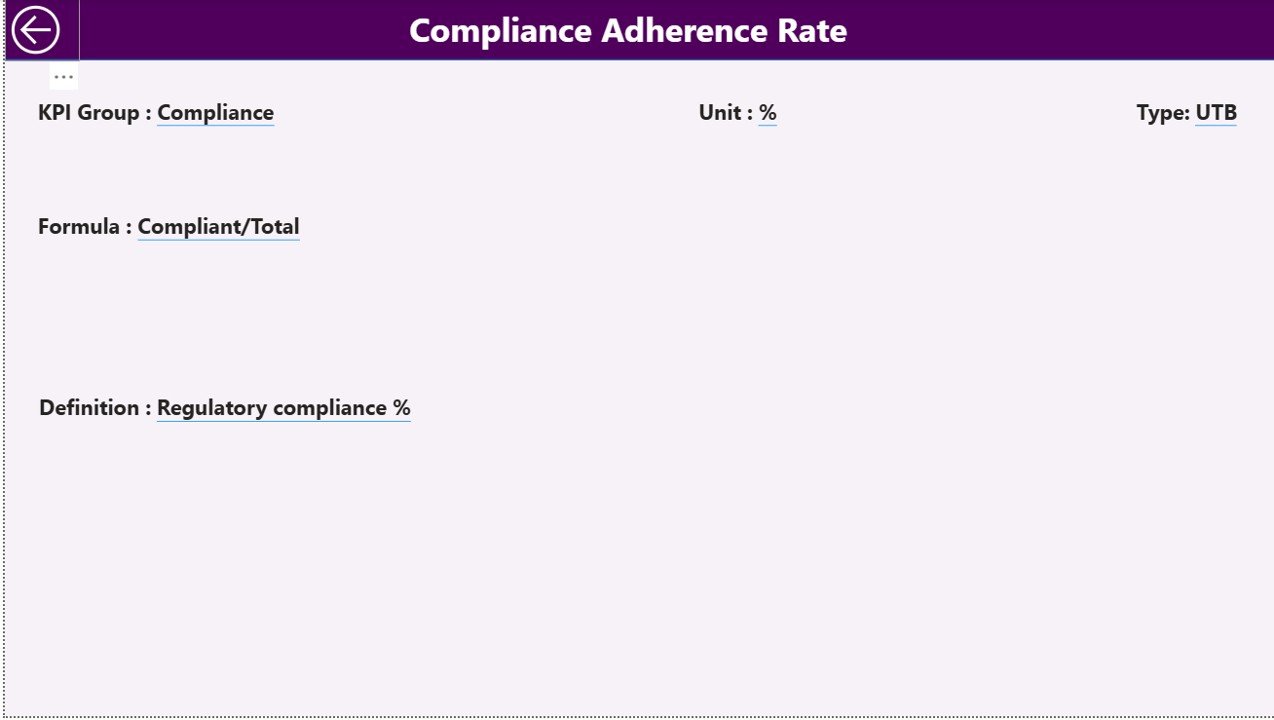
The KPI Definition Page serves as a reference and governance layer.
Key Features of KPI Definition Page
-
Hidden drill-through page
-
Accessible directly from the Summary Page
-
Displays detailed KPI information
This page includes:
-
KPI Formula
-
KPI Definition
-
KPI Type
-
Measurement logic
Because of this, stakeholders clearly understand what each KPI means and how calculations work.
Additionally, the Back button on the top-left corner ensures smooth navigation.
How Does Excel Work as a Data Source for This Dashboard?
This dashboard uses Excel as its data source, which ensures flexibility and ease of use.
Excel File Structure
The Excel file includes three structured worksheets.
1) Input_Actual Sheet
This sheet captures actual KPI performance.
You need to fill:
-
KPI Name
-
Month (use first date of the month)
-
MTD values
-
YTD values
Because data entry stays simple, teams can update numbers quickly.
2) Input_Target Sheet
This sheet stores target values.
You need to enter:
-
KPI Name
-
Month (first date of month)
-
Target MTD values
-
Target YTD values
As a result, target tracking becomes consistent and structured.
3) KPI Definition Sheet
This sheet defines each KPI clearly.
You fill:
-
KPI Number
-
KPI Group
-
KPI Name
-
Unit
-
Formula
-
Definition
-
Type (LTB or UTB)
Because of this setup, governance and clarity improve significantly.
Advantages of Legal Advisory KPI Dashboard in Power BI
Click to Purchases Legal Advisory KPI Dashboard in Power BI
A Legal Advisory KPI Dashboard in Power BI delivers multiple benefits for legal teams and leadership.
Key Advantages
-
Centralized legal performance tracking
-
Faster decision-making
-
Real-time KPI visibility
-
Clear target vs actual comparison
-
Strong compliance monitoring
-
Reduced manual reporting effort
-
Better accountability across legal teams
-
Easy scalability for future KPIs
Therefore, legal departments operate with confidence and precision.
Who Can Use a Legal Advisory KPI Dashboard?
This dashboard supports multiple stakeholders.
-
Legal Heads
-
Compliance Officers
-
Risk Management Teams
-
Corporate Counsel
-
Executive Management
-
Audit Teams
Because of its flexible design, both operational and strategic users benefit.
Best Practices for the Legal Advisory KPI Dashboard in Power BI
To get the best results, legal teams should follow proven best practices.
1. Define Clear KPIs
Always select KPIs that align with legal objectives and compliance goals.
2. Maintain Consistent Data Entry
Ensure monthly data updates follow the same structure and format.
3. Review Trends Regularly
Use the KPI Trend Page to identify risks early.
4. Use KPI Definitions Properly
Keep definitions updated to avoid confusion.
5. Monitor LTB and UTB Carefully
Understand whether lower or higher values drive success.
6. Schedule Monthly Reviews
Review dashboard results with leadership regularly.
By following these practices, teams maximize dashboard value.
How Does This Dashboard Improve Legal Decision-Making?
This dashboard transforms raw data into actionable insights.
It helps legal teams:
-
Identify performance gaps early
-
Prioritize critical legal actions
-
Support leadership decisions with data
-
Improve accountability and transparency
As a result, legal operations become proactive instead of reactive.
Conclusion: Why Should You Use a Legal Advisory KPI Dashboard in Power BI?
A Legal Advisory KPI Dashboard in Power BI empowers legal teams to track, analyze, and improve performance with confidence.
Instead of relying on manual reports, this dashboard provides real-time visibility, structured KPI tracking, and clear trend analysis. Moreover, the Excel-based data source ensures ease of use, while Power BI delivers powerful insights.
Ultimately, this dashboard helps legal advisory teams reduce risk, improve compliance, and support strategic decision-making.
Frequently Asked Questions (FAQs)
What is a Legal Advisory KPI Dashboard in Power BI used for?
It tracks, monitors, and analyzes legal performance metrics in an interactive dashboard.
Do I need technical skills to use this dashboard?
No. You only need basic Excel knowledge to update data.
Can I add more KPIs later?
Yes. The dashboard supports easy KPI expansion.
Does this dashboard support monthly and yearly analysis?
Yes. It tracks both MTD and YTD performance.
Is Excel mandatory as a data source?
This version uses Excel, which ensures flexibility and simplicity.
Who benefits the most from this dashboard?
Legal heads, compliance teams, and management teams gain the most value.
Visit our YouTube channel to learn step-by-step video tutorials