In today’s dynamic business environment, legal compliance and customer engagement go hand in hand. Companies need to ensure that they comply with all legal and regulatory requirements while also delivering a seamless experience for their customers. Failure in either area can result in financial penalties, loss of trust, and long-term reputational damage.
To address these challenges, businesses increasingly rely on KPI dashboards. These dashboards provide a structured way to measure and monitor performance. One such tool is the Legal and Compliance Customer Engagement KPI Dashboard in Excel, a ready-to-use template designed to give organizations complete visibility into both compliance and customer-related performance metrics.
This article will walk you through everything you need to know about this dashboard—its structure, features, benefits, opportunities for improvement, best practices, and frequently asked questions.
Click to Purchases Legal and Compliance Customer Engagement KPI Dashboard in Excel
What is a Legal and Compliance Customer Engagement KPI Dashboard?
A Legal and Compliance Customer Engagement KPI Dashboard is an Excel-based tool that consolidates all key performance indicators (KPIs) related to compliance and customer engagement. It provides a real-time snapshot of how well an organization manages its legal responsibilities while keeping customers satisfied.
Unlike plain spreadsheets, this dashboard uses visualizations, conditional formatting, and interactive features to make data more actionable. It helps compliance managers, legal teams, and customer service professionals track progress and identify areas that need attention.
Structure of the Dashboard
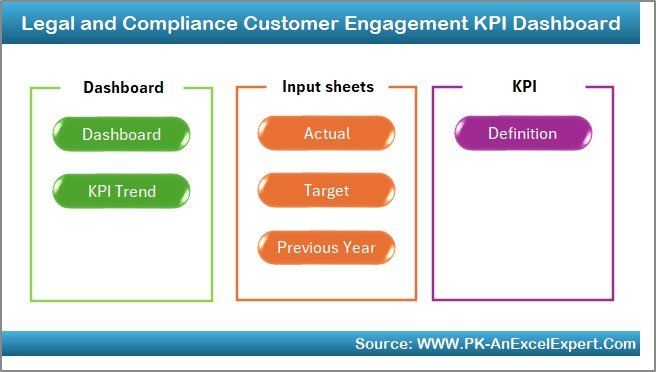
The dashboard is designed with seven worksheets, each serving a specific purpose. Let’s explore them in detail:
Home Sheet
-
Acts as the index page for the entire dashboard.
-
Contains six navigation buttons to jump quickly between sheets.
-
Makes the template user-friendly and saves time in navigating.
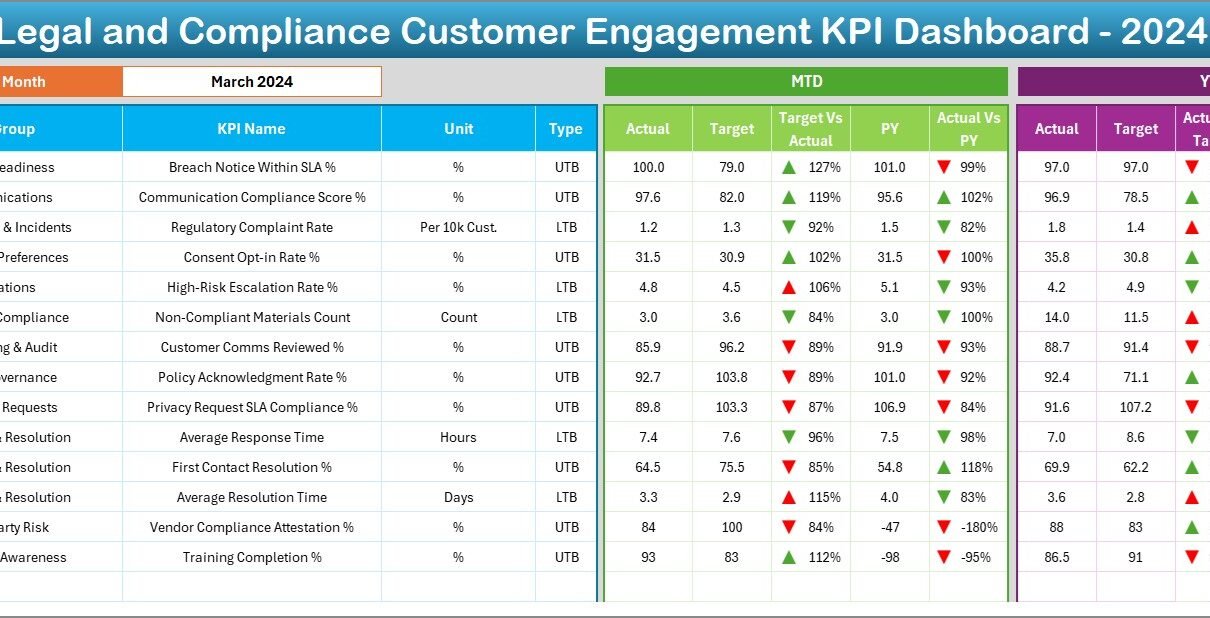
Dashboard Sheet Tab
-
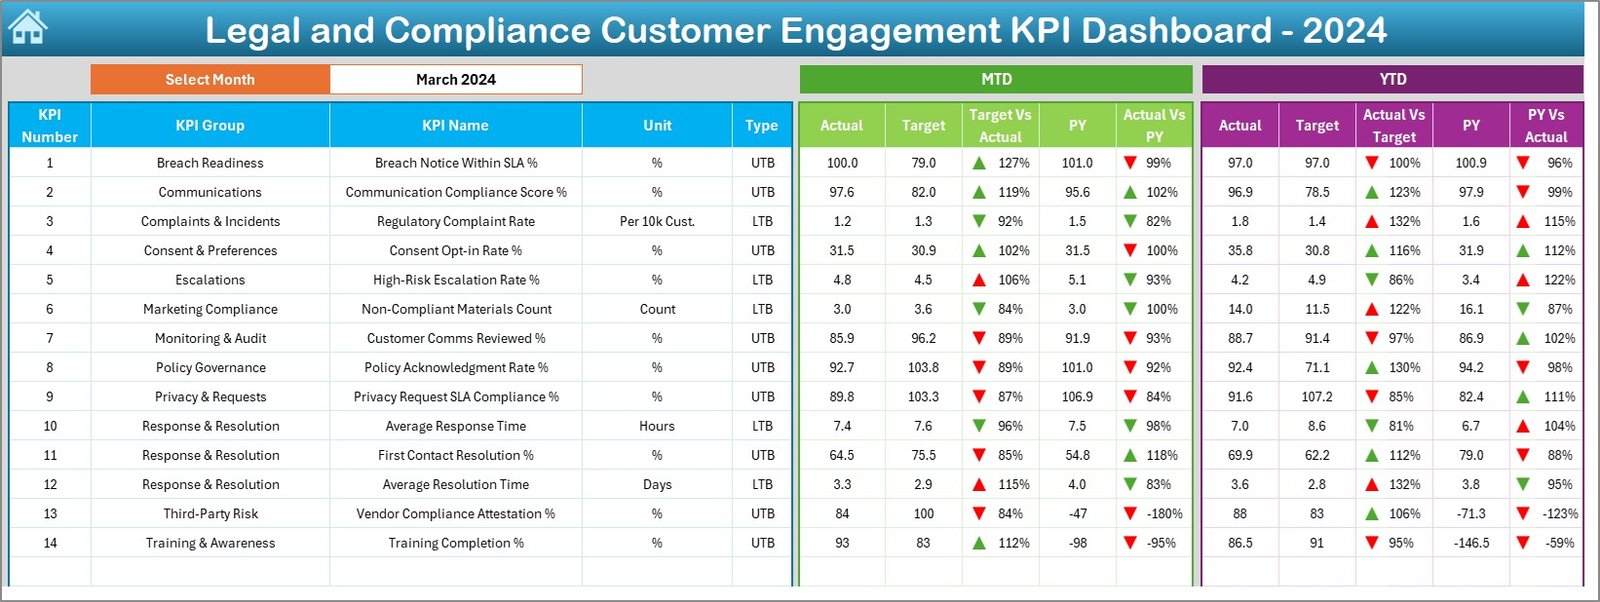
The main visualization page of the dashboard.
-
At the top, a month selector (drop-down in cell D3) allows users to filter all results by month.
-
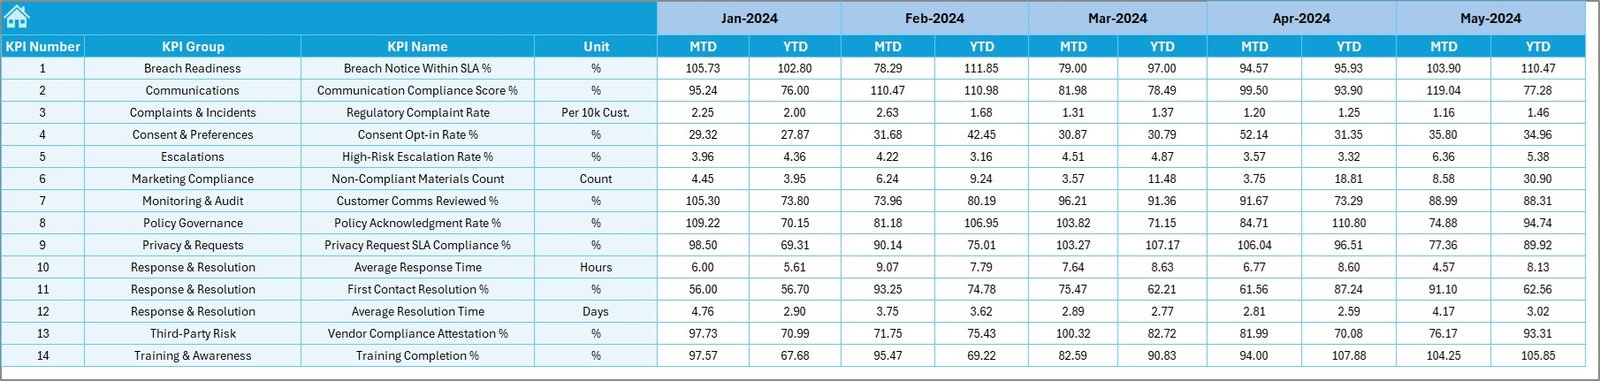
Displays MTD (Month-to-Date) Actual, Target, and Previous Year data, along with variance analysis.
-
Includes YTD (Year-to-Date) performance data for broader analysis.
-
Uses conditional formatting with arrows (green for improvement, red for decline) to show trends instantly.
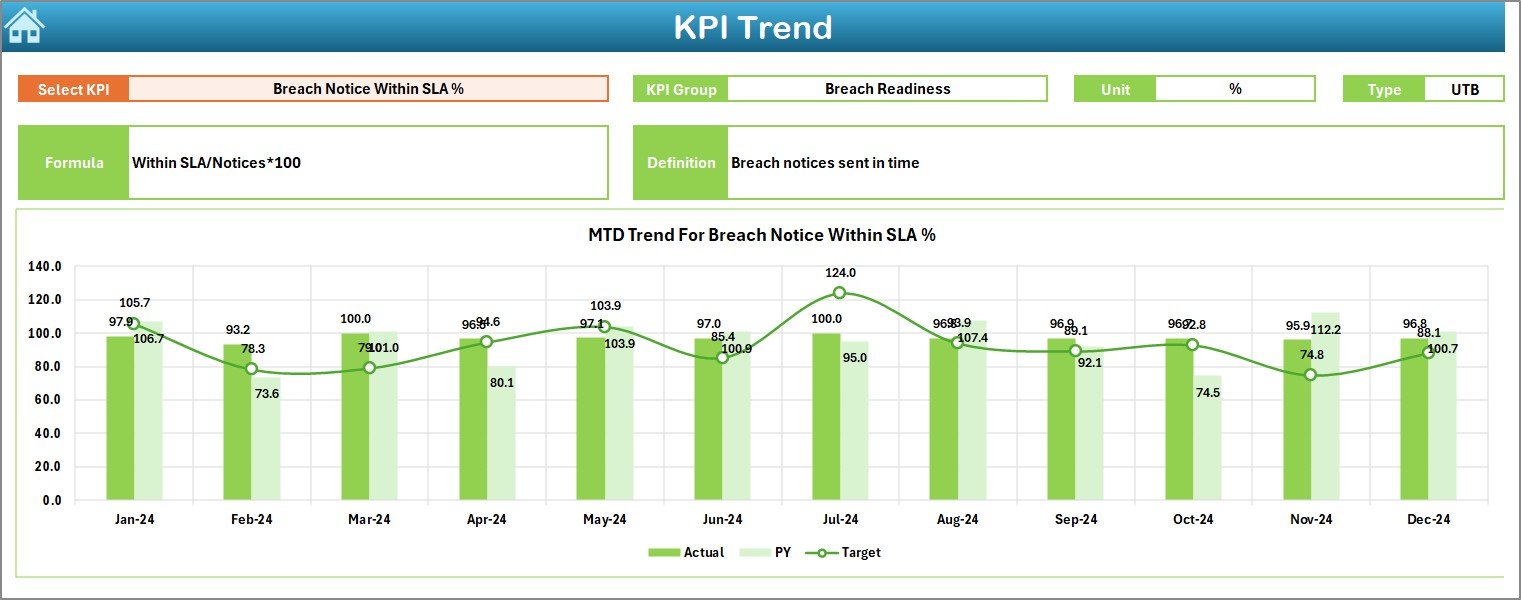
KPI Trend Sheet Tab
-
Allows selection of KPI name (drop-down in cell C3).
-
Displays KPI Group, Unit of Measurement, KPI Type (UTB = Upper the Better, LTB = Lower the Better).
-
Includes KPI Formula and Definition for better understanding.
-
Shows MTD and YTD trend charts comparing Actual vs Target vs Previous Year numbers.
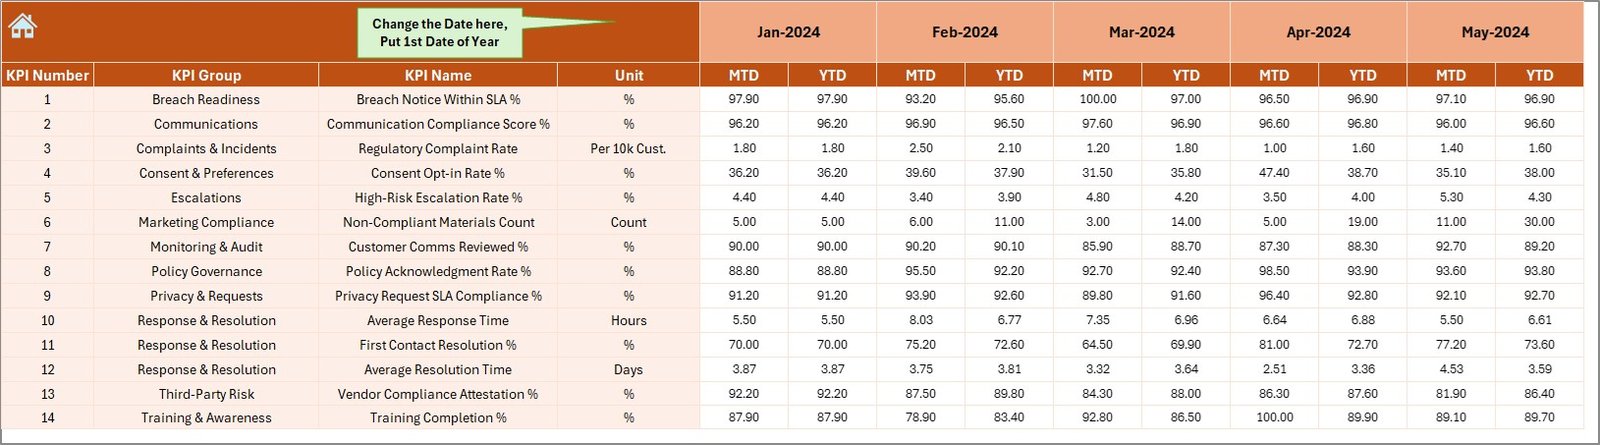
Actual Numbers Input Sheet
-
Designed for manual entry of actual performance numbers.
-
Month selection available in cell E1.
-
Requires users to input YTD and MTD values for accurate reporting.
Target Sheet Tab
-
Captures the target values for each KPI, broken into MTD and YTD.
-
Provides a reference point to measure actual performance against expectations.
Previous Year Numbers Sheet Tab
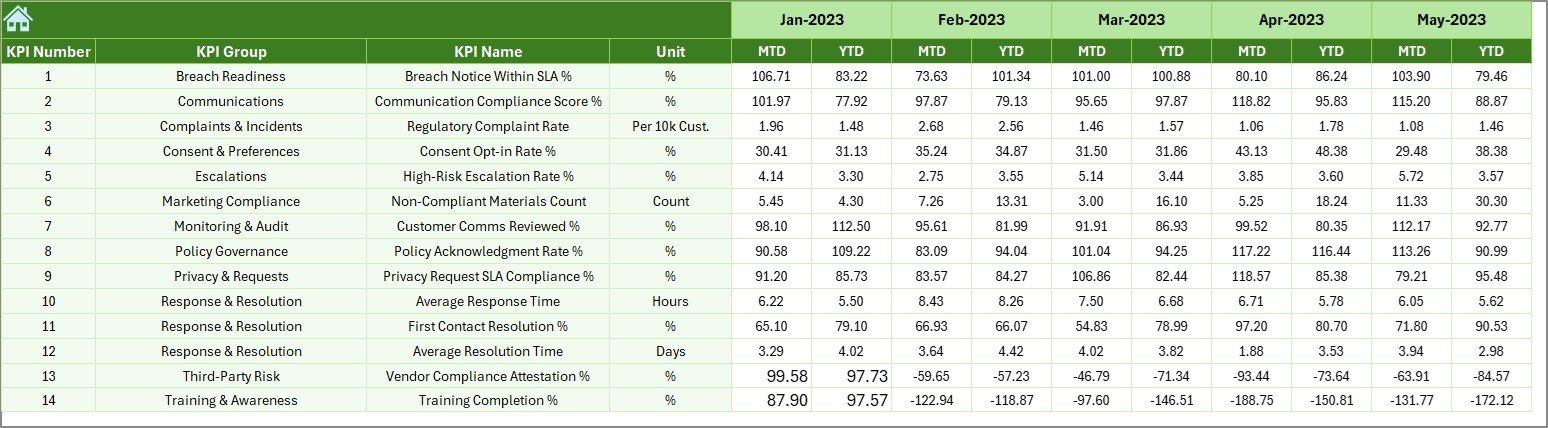
-
Stores historical data from the previous year.
-
Used for comparison to understand growth, decline, or stagnation.
KPI Definition Sheet Tab
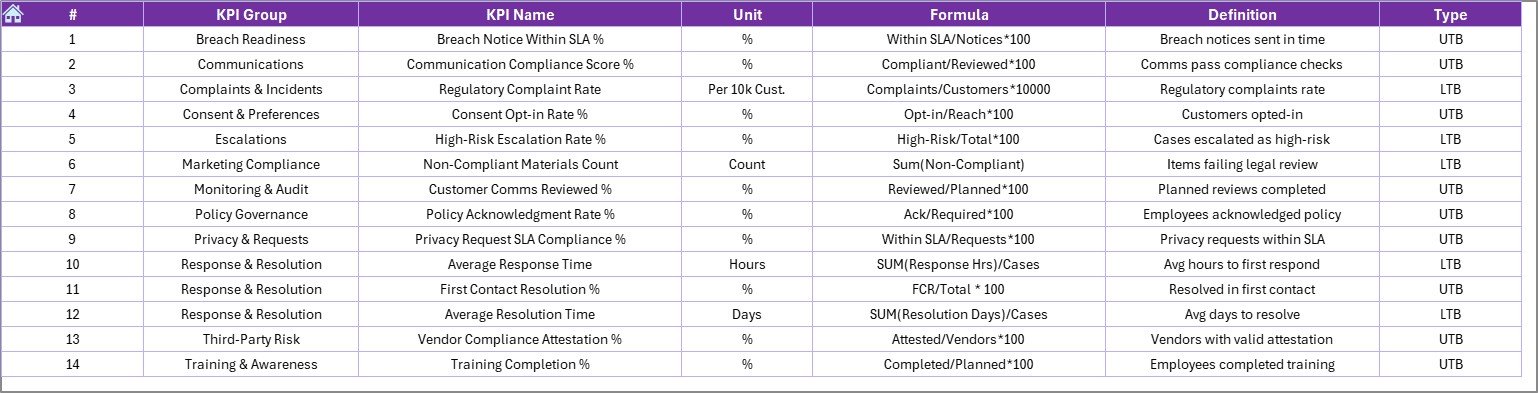
-
The backbone of the dashboard.
Contains information about each KPI:
- KPI Name
- KPI Group
- Unit
- Formula
- Definition
This ensures consistency and clarity when reviewing performance across the organization.
Click to Purchases Legal and Compliance Customer Engagement KPI Dashboard in Excel
Key Features of the Dashboard
-
Ready-to-use template with prebuilt structure.
-
Dynamic month selection that updates all visuals instantly.
-
Clear variance analysis using arrows and colors.
-
Trend charts for MTD and YTD performance.
-
Separate input sheets for actuals, targets, and historical data.
-
Comprehensive KPI definitions to maintain uniformity.
-
Excel-based (no additional software required).
Why Use This Dashboard?
-
To ensure regulatory compliance is monitored regularly.
-
To improve customer satisfaction by tracking engagement metrics.
-
To maintain accountability by assigning KPIs to teams and individuals.
-
To enable data-driven decision-making with visual insights.
-
To identify gaps between targets and actual performance quickly.
Advantages of Legal and Compliance Customer Engagement KPI Dashboard
✅ Enhanced Compliance Monitoring: Track regulatory requirements in real-time.
✅ Improved Customer Trust: Transparent tracking of customer engagement builds loyalty.
✅ Better Decision-Making: Managers can act faster based on visual data.
✅ Time-Saving: Prebuilt template reduces setup time.
✅ Flexibility: Can be customized for industry-specific needs.
✅ Cost-Effective: Excel-based, so no need for expensive software.
Opportunities for Improvement
🔹 Automation of Data Input: Currently requires manual data entry. Linking to databases or CRM systems could improve efficiency.
🔹 Integration with BI Tools: While Excel is great, connecting the dashboard with Power BI or Tableau could add more scalability.
🔹 Real-Time Updates: Using Excel with cloud connectors (like Power Query) can make it more dynamic.
🔹 Advanced Visualization: Adding more advanced charts (e.g., heatmaps, waterfall charts) would improve insights.
🔹 Role-Based Access: Implementing security layers would protect sensitive compliance data.
Best Practices for the Legal and Compliance Customer Engagement KPI Dashboard
📌 Define Clear KPIs: Keep KPIs simple, measurable, and relevant.
📌 Update Data Regularly: Ensure actual and target data is updated at least monthly.
📌 Use Conditional Formatting: Leverage arrows, traffic lights, and bars for easy interpretation.
📌 Compare Against Benchmarks: Always measure performance against industry standards or previous years.
📌 Train Users: Ensure compliance and customer service teams understand how to use the dashboard.
📌 Review Trends, Not Just Numbers: Focus on direction over time, not isolated values.
📌 Secure Sensitive Data: Protect compliance records using password-protected sheets.
How This Dashboard Helps Different Teams
-
Legal Teams: Monitor compliance KPIs like contract approval time, audit scores, and case resolution rates.
-
Customer Service Teams: Track metrics like response time, SLA adherence, and complaint resolution.
-
Management: Get a bird’s-eye view of compliance status and customer satisfaction trends.
-
Auditors: Use KPI reports to validate compliance processes.
Real-World Applications
Financial Institutions
- Track customer complaints resolution.
- Ensure compliance with regulatory deadlines.
Healthcare Industry
- Monitor compliance with patient privacy laws.
- Track patient satisfaction surveys.
Retail Sector
- Measure compliance with consumer protection regulations.
- Monitor customer engagement through loyalty programs.
Conclusion
The Legal and Compliance Customer Engagement KPI Dashboard in Excel is a powerful tool that simplifies how organizations manage compliance and customer-focused KPIs. With its easy-to-use structure, interactive visuals, and detailed tracking features, it enables businesses to maintain both regulatory alignment and strong customer relationships.
By following best practices and continuously improving the dashboard, organizations can stay ahead of compliance risks while keeping customer trust intact.
Frequently Asked Questions (FAQs)
1. What is a Legal and Compliance Customer Engagement KPI Dashboard?
It is an Excel-based tool that tracks key compliance and customer engagement metrics in one place for better decision-making.
2. Why should I use this dashboard instead of a simple spreadsheet?
Because it provides visual insights, trends, and comparisons that plain spreadsheets cannot offer.
3. Can I customize the KPIs in this dashboard?
Yes. You can add or remove KPIs depending on your organization’s specific needs.
4. Do I need advanced Excel skills to use it?
No. The dashboard is prebuilt and user-friendly. Basic Excel knowledge is enough.
5. How often should I update the data?
At least once a month, although weekly updates are recommended for high-paced industries.
6. Can this dashboard integrate with Power BI or other tools?
Yes. You can connect Excel to Power BI or external data sources using Power Query.
7. Is this dashboard suitable for small businesses?
Absolutely. It is cost-effective and flexible, making it ideal for small to medium enterprises.
Visit our YouTube channel to learn step-by-step video tutorials