In today’s fast-paced business environment, legal and compliance management plays a crucial role in ensuring that organizations meet regulatory requirements, manage risks effectively, and avoid costly penalties. However, monitoring compliance activities, legal obligations, and internal audits can be complex without the right tools.
This is where a Legal and Compliance KPI Dashboard in Excel becomes a game-changer. It allows organizations to track, measure, and analyze compliance metrics in a structured and visual way. By using Excel, businesses can benefit from an accessible, cost-effective, and customizable solution that simplifies compliance tracking while improving transparency and decision-making.
This article will walk you through the key features, advantages, best practices, and real-world applications of the Legal and Compliance KPI Dashboard in Excel.
Click to Purchases Legal and Compliance KPI Dashboard in Excel
What Is a Legal and Compliance KPI Dashboard in Excel?
A Legal and Compliance KPI Dashboard in Excel is a structured reporting tool that consolidates compliance-related metrics into one place. It tracks Key Performance Indicators (KPIs) such as audit completion rates, policy adherence, training compliance, contract renewals, and regulatory reporting timelines.
Instead of managing these activities in scattered reports or manual trackers, the dashboard centralizes data and presents it visually with charts, tables, and conditional formatting. This makes it easier for compliance teams, auditors, and executives to understand performance trends and take corrective action when necessary.
Key Features of the Legal and Compliance KPI Dashboard
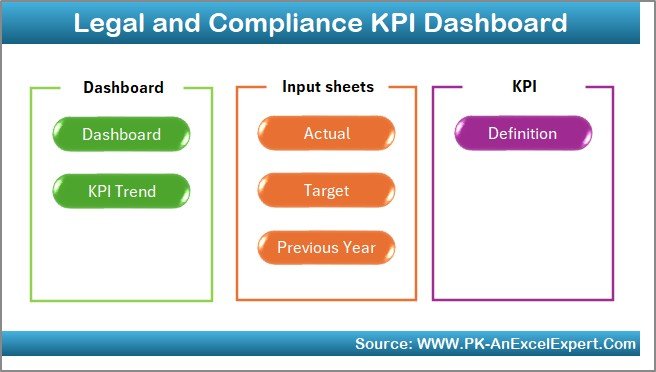
The prebuilt dashboard template consists of 7 worksheets, each designed for a specific purpose:
Home Sheet
-
Acts as the index page for the dashboard.
-
Includes navigation buttons that allow users to move easily between worksheets.
-
Provides a professional and user-friendly entry point to the tool.
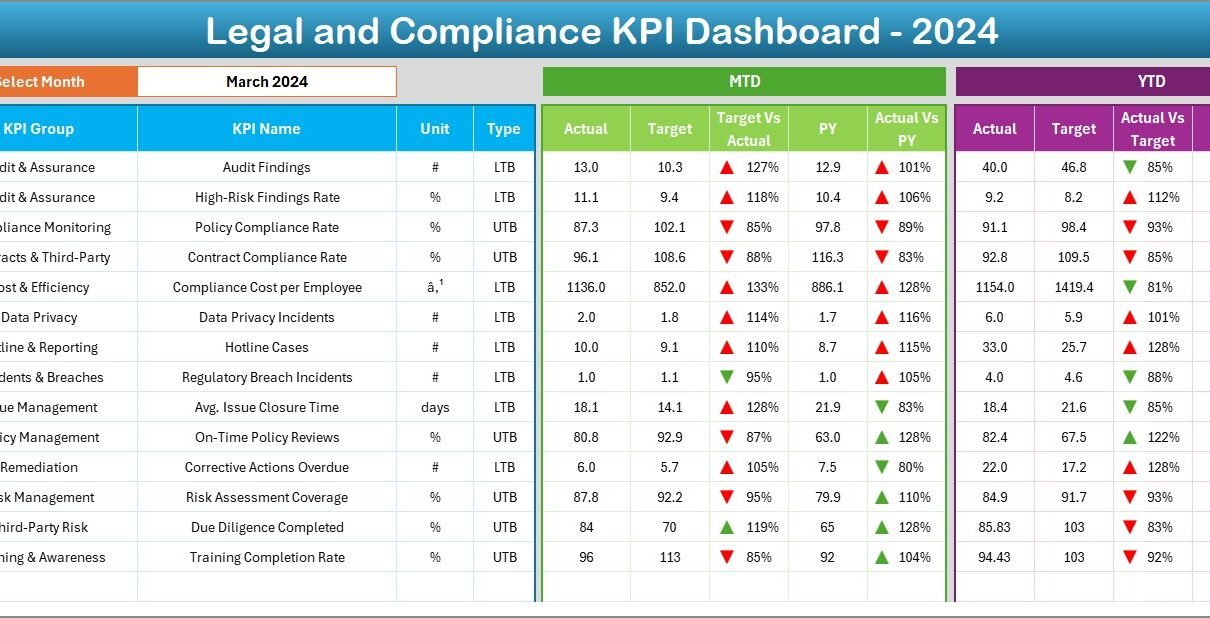
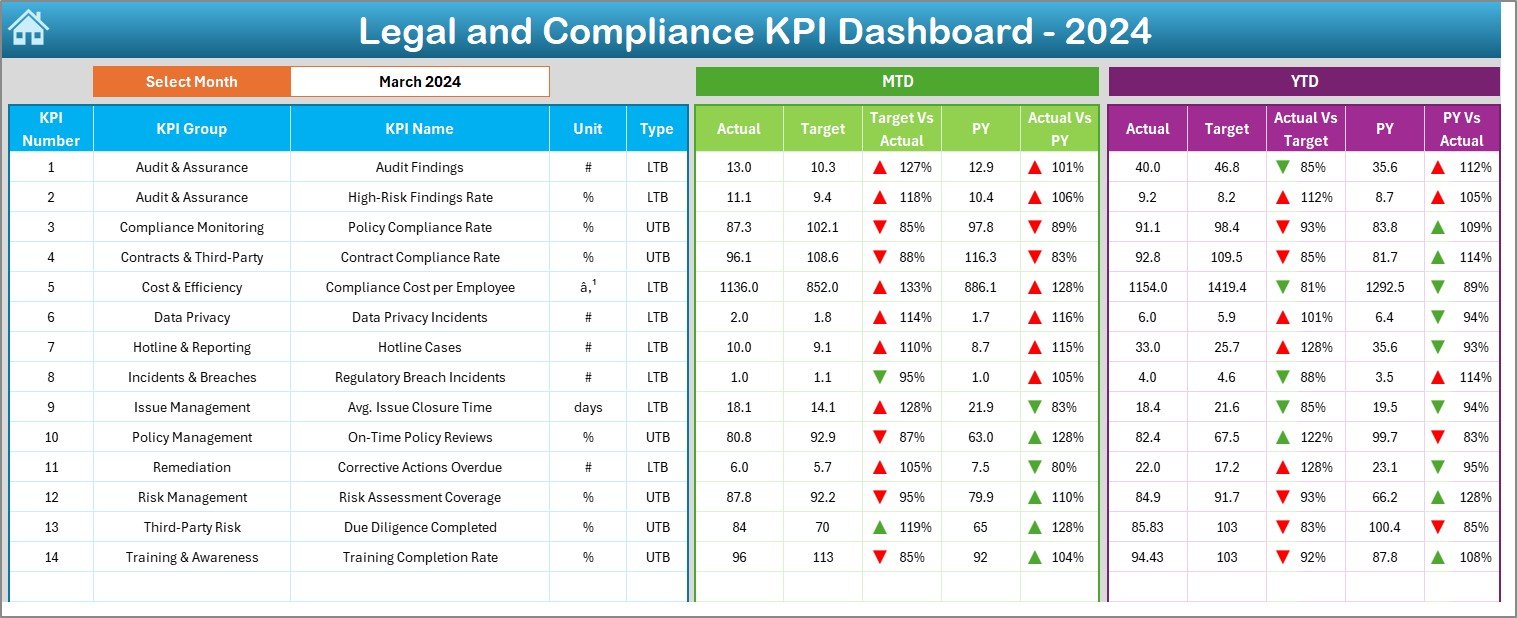
Dashboard Sheet Tab
-
The main reporting sheet where all KPI information is displayed.
-
Allows users to select a month from a dropdown (Cell D3). Once selected, all dashboard metrics update automatically.
Displays:
- MTD (Month-to-Date) Actual, Target, and Previous Year values.
- YTD (Year-to-Date) Actual, Target, and Previous Year values.
- Variance analysis with conditional formatting (up/down arrows for performance status).
This sheet offers a real-time snapshot of compliance performance, helping managers quickly spot issues.
KPI Trend Sheet Tab
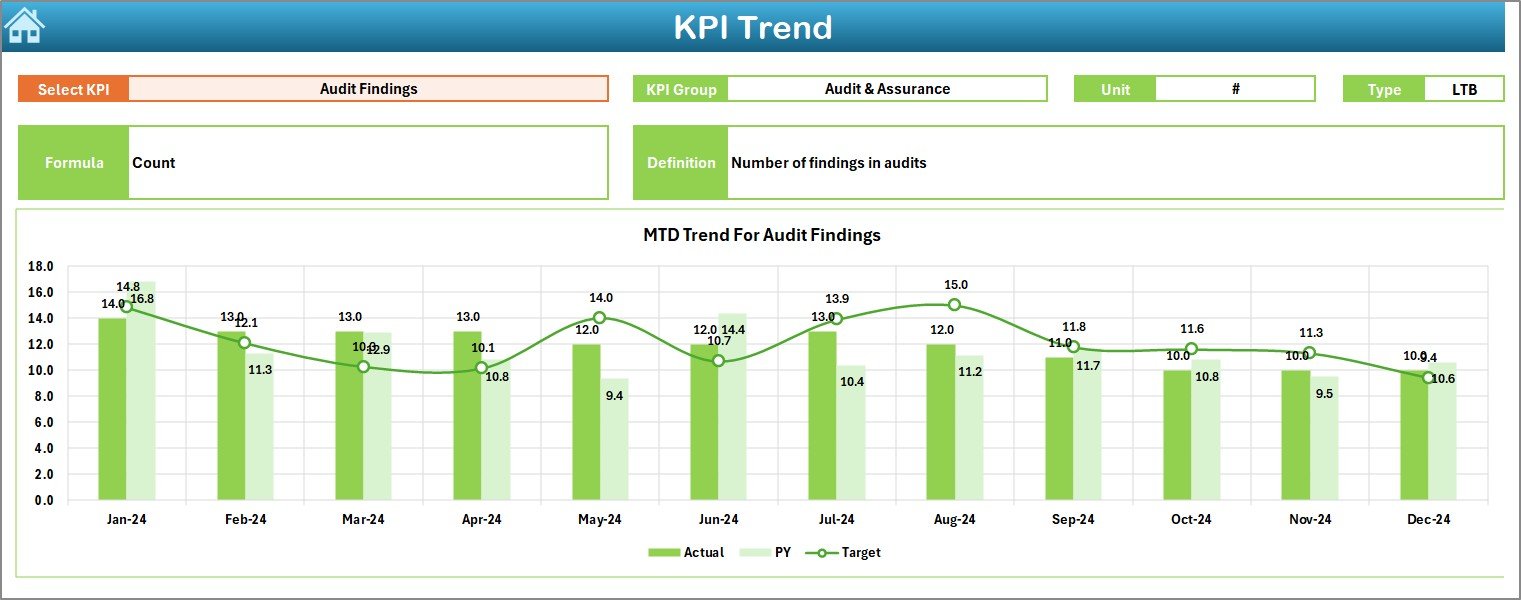
-
Provides trend analysis for selected KPIs.
-
Dropdown in Cell C3 allows users to choose a KPI.
Displays:
- KPI Group, Unit, Type (UTB – Upper the Better / LTB – Lower the Better).
- Formula and definition of the KPI.
- Charts for MTD and YTD performance trends across Actual, Target, and Previous Year.
This sheet helps users understand how a KPI has changed over time, making it easier to predict risks or track improvements.
Actual Numbers Input Sheet
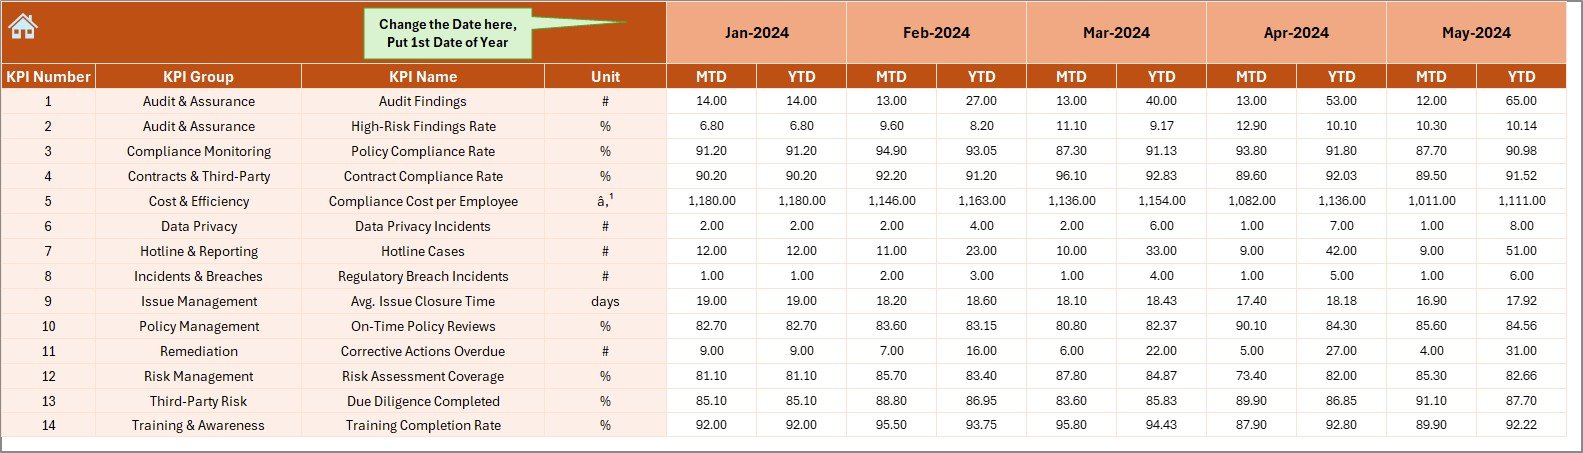
-
Designed for data entry of actual KPI values.
-
Users can select the start month in Cell E1 and input values for each month.
-
Covers both MTD and YTD numbers.
This ensures consistency and accuracy in tracking compliance performance.
Target Sheet Tab
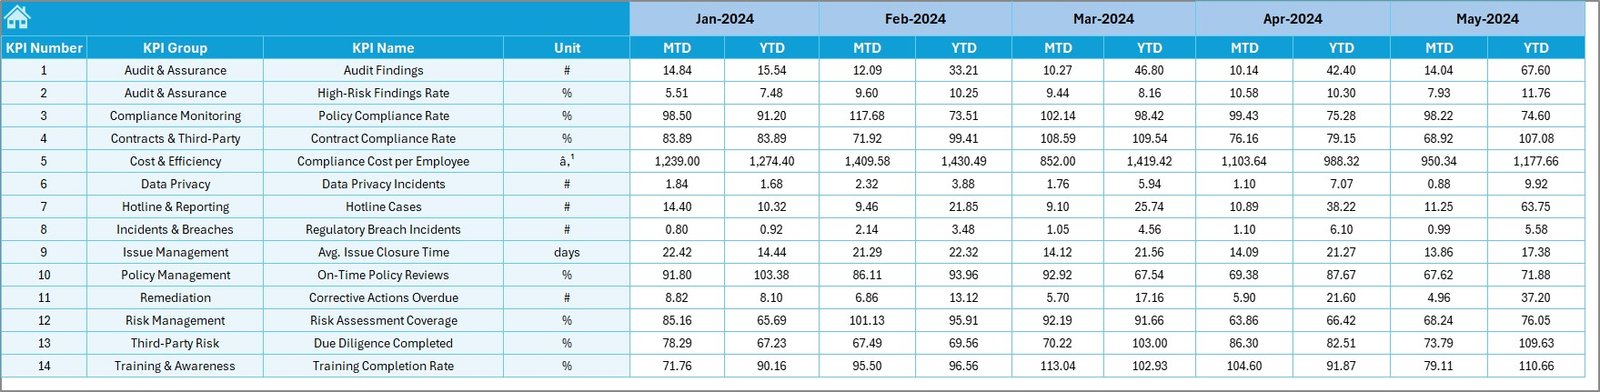
-
Used to input target values for KPIs.
-
Covers monthly targets for both MTD and YTD metrics.
-
Helps in comparing actual performance against planned goals.
Previous Year Numbers Sheet Tab
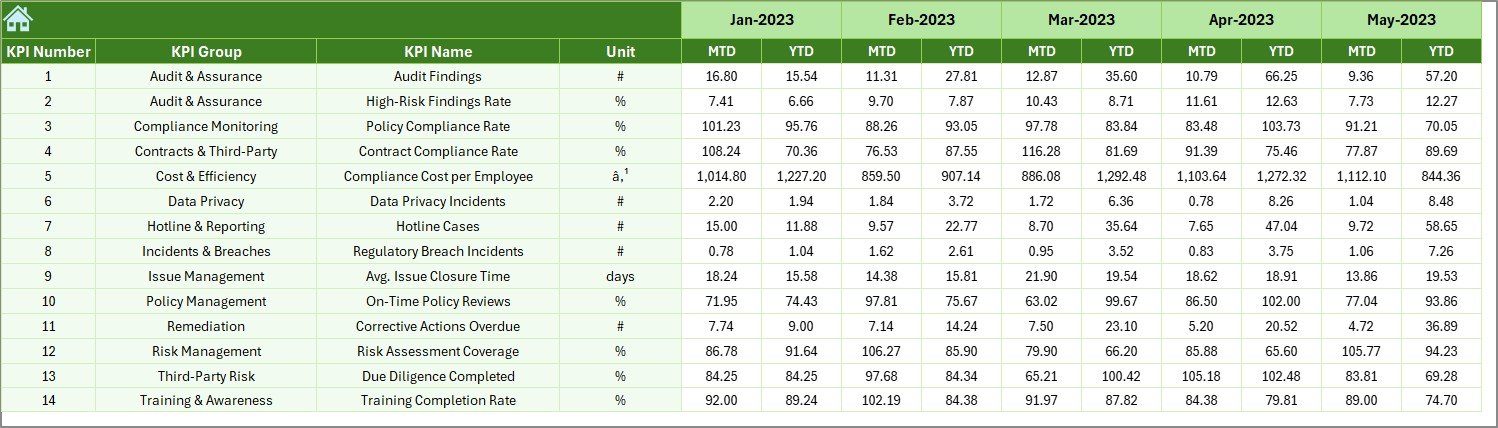
-
Stores historical KPI data from the previous year.
-
Helps in benchmarking current performance against last year’s figures.
KPI Definition Sheet Tab
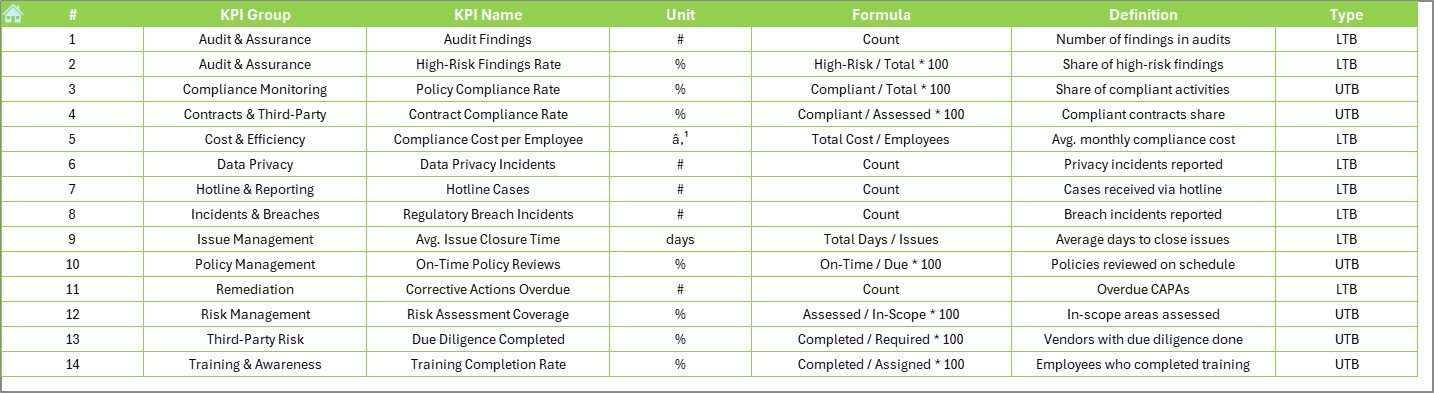
Contains detailed information about each KPI:
- KPI Name
- KPI Group
- Unit of Measurement
- Formula
- Definition
-
Serves as a reference sheet for better understanding of metrics.
Click to Purchases Legal and Compliance KPI Dashboard in Excel
Why Is the Legal and Compliance KPI Dashboard Important?
Legal and compliance functions involve numerous moving parts—from regulatory deadlines to internal audits and policy reviews. Without a centralized system, organizations may:
-
Miss deadlines and face penalties.
-
Fail to identify compliance risks early.
-
Struggle to communicate performance to stakeholders.
The Excel-based dashboard solves these challenges by:
-
Providing real-time visibility into KPIs.
-
Offering comparisons with targets and past data.
-
Supporting evidence-based decision-making.
Advantages of Legal and Compliance KPI Dashboard in Excel
Using this dashboard offers multiple benefits:
✅ Centralized Data Tracking – All compliance KPIs are monitored in one tool.
✅ User-Friendly Design – Excel’s interface is familiar to most professionals.
✅ Customizable Structure – Organizations can modify KPIs, charts, and layouts.
✅ Cost-Effective – No need for expensive compliance software.
✅ Visual Insights – Charts, arrows, and progress indicators simplify complex data.
✅ Performance Benchmarking – Compare current vs. previous year performance.
✅ Enhanced Accountability – Clear KPI definitions improve ownership.
Opportunities for Improvement in Legal and Compliance Tracking
Even though this Excel dashboard is powerful, organizations can improve compliance tracking further by:
🔹 Automating data entry using Excel macros or integrations.
🔹 Adding risk scoring metrics for better prioritization.
🔹 Integrating with regulatory calendars to avoid missing deadlines.
🔹 Expanding KPI coverage to include emerging compliance areas like ESG (Environmental, Social, Governance).
🔹 Developing role-based dashboards for executives, auditors, and compliance officers.
Best Practices for Using the Legal and Compliance KPI Dashboard
To get maximum value from the dashboard, follow these best practices:
-
Define Clear KPIs – Select KPIs that align with legal and compliance objectives.
-
Update Data Regularly – Ensure Actual, Target, and Previous Year sheets are updated monthly.
-
Use Conditional Formatting – Highlight non-compliance or risks with colors/arrows.
-
Review Trends Frequently – Use the KPI Trend sheet to analyze recurring issues.
-
Train Users – Make sure compliance teams know how to use and update the dashboard.
-
Integrate with Audits – Link KPI reviews with internal and external audit cycles.
-
Continuously Improve – Update KPI definitions as regulations evolve.
Real-World Use Cases
The dashboard can be applied in different organizational scenarios:
-
Corporate Compliance – Tracking adherence to anti-bribery, data protection, and labor laws.
-
Financial Services – Monitoring compliance with banking regulations and reporting deadlines.
-
Healthcare – Ensuring adherence to patient safety, privacy, and quality standards.
-
Manufacturing – Managing compliance with safety, environment, and quality certifications.
-
Education – Ensuring institutions meet accreditation and policy standards.
Conclusion
The Legal and Compliance KPI Dashboard in Excel is an essential tool for organizations looking to simplify compliance management, track performance, and improve decision-making. It combines the power of KPI tracking, visualization, and benchmarking in a user-friendly, cost-effective package.
By adopting this dashboard, businesses can reduce compliance risks, improve transparency, and strengthen accountability across departments.
Frequently Asked Questions (FAQs)
1. What are KPIs in legal and compliance?
KPIs are measurable indicators that track how effectively an organization manages its compliance obligations, such as audit completion rates, policy adherence, or regulatory reporting timelines.
2. Why use Excel for compliance dashboards?
Excel is cost-effective, widely available, and easy to customize. It allows organizations to manage compliance metrics without investing in expensive software.
3. Can this dashboard be customized for industry-specific compliance?
Yes. The template is fully customizable. You can add or remove KPIs, modify definitions, and adjust targets based on industry needs.
4. How often should compliance data be updated?
Ideally, compliance data should be updated monthly to reflect MTD and YTD performance accurately. However, critical KPIs can be updated more frequently.
5. What are the most common compliance KPIs?
Some common KPIs include audit completion rate, policy compliance percentage, number of incidents, contract renewal timelines, and regulatory filing accuracy.
Visit our YouTube channel to learn step-by-step video tutorials