Managing a luxury brand demands far more than aesthetic perfection and premium pricing. It’s about balancing quality, exclusivity, customer satisfaction, and operational efficiency. In today’s competitive market, success in the luxury sector depends on data-driven decision-making—and that’s where a Luxury Goods KPI Scorecard in Excel comes in.
This powerful tool allows luxury brands, retailers, and distributors to monitor, analyze, and improve performance across sales, marketing, inventory, and customer experience. Whether you manage a fashion house, jewelry brand, watch retailer, or high-end boutique, this scorecard gives you an all-in-one view of your key business indicators.
Click to Purchases Luxury Goods KPI Scorecard in Excel
What Is a Luxury Goods KPI Scorecard in Excel?
A Luxury Goods KPI Scorecard is an interactive Excel-based tool that helps organizations track and evaluate key performance indicators (KPIs) related to their business performance. It consolidates data from multiple areas—such as sales, customer feedback, supply chain, and marketing—into a visual, easy-to-read dashboard.
The scorecard highlights both Month-to-Date (MTD) and Year-to-Date (YTD) results, making it simple to assess whether your brand is meeting its targets. Using conditional formatting, it instantly reveals which areas are performing well and which need attention.
The beauty of using Excel lies in its simplicity, flexibility, and accessibility. You don’t need expensive software or complex systems—just one well-designed file that can deliver powerful insights at a glance.
Why Luxury Brands Need KPI Tracking
The luxury goods market operates differently from mass retail. Every detail—from craftsmanship to brand perception—affects overall success. Yet without measurable performance data, even top brands struggle to identify what drives growth.
Here’s why KPI tracking is essential in the luxury industry:
-
💎 Precision Matters: Every sale, client interaction, and marketing campaign must meet high standards. KPIs help measure this precision.
-
📊 Data-Driven Strategy: With clear metrics, managers can identify strengths and weaknesses to make strategic adjustments.
-
💰 Profit Optimization: Understanding margin trends and customer acquisition costs ensures pricing remains competitive yet profitable.
-
🌍 Global Consistency: Many luxury brands operate across regions; a KPI scorecard ensures performance remains consistent worldwide.
-
👑 Customer Experience: Monitoring satisfaction levels and repeat purchase rates reveals how well a brand maintains its exclusivity and emotional appeal.
Key Features of the Luxury Goods KPI Scorecard in Excel
This ready-to-use template simplifies performance monitoring for luxury businesses. Built in Excel, it offers both power and simplicity through its organized structure and intuitive layout.
Click to Purchases Luxury Goods KPI Scorecard in Excel
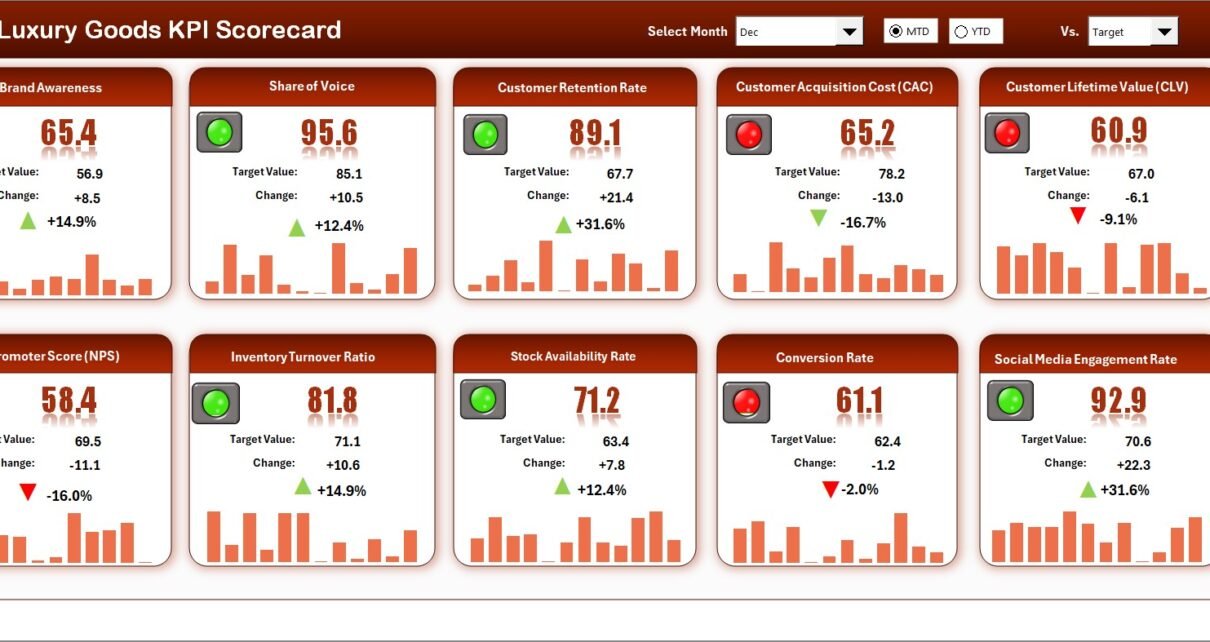
1. Scorecard Sheet
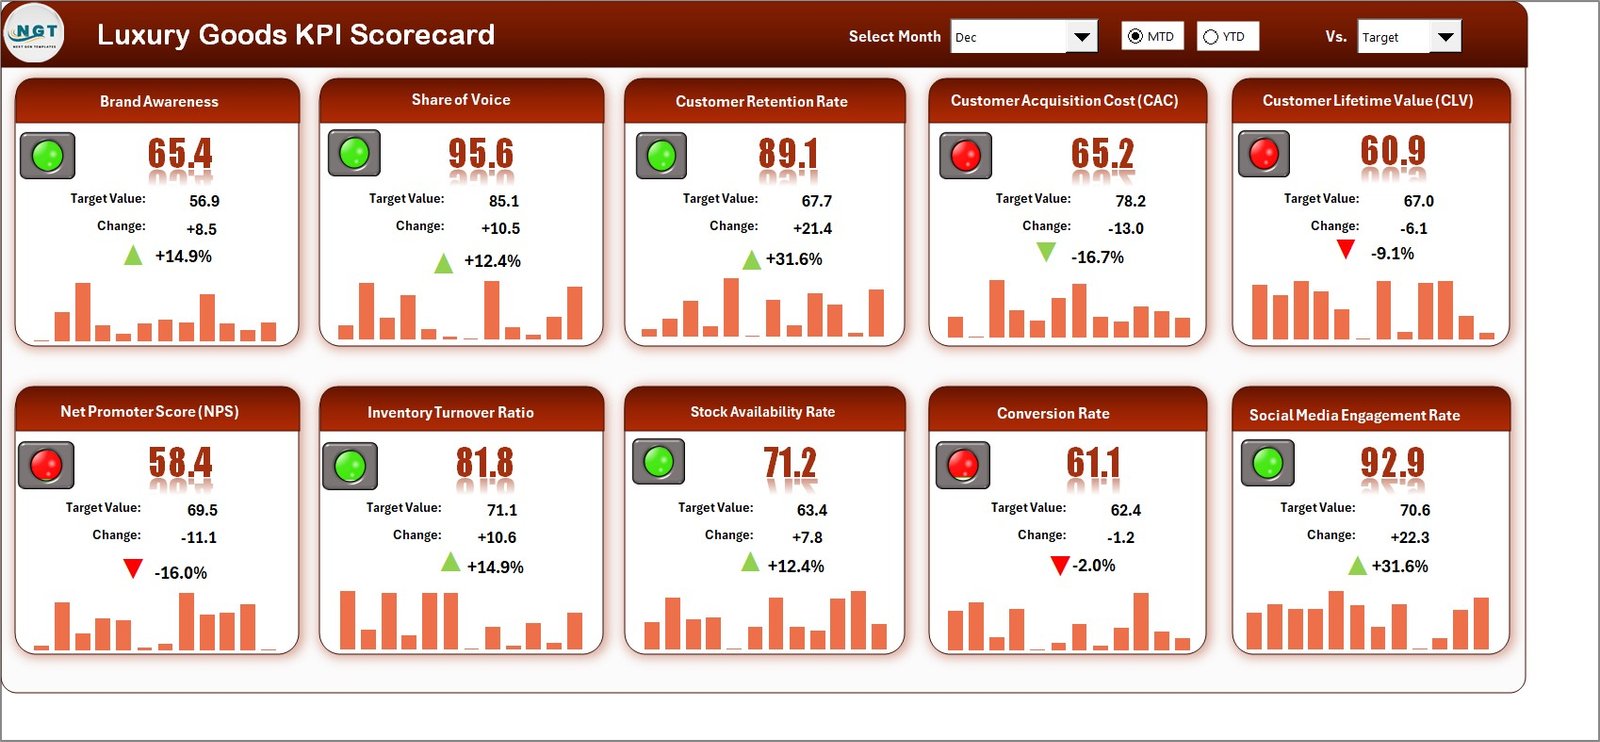
The Scorecard sheet is the main interface—the heart of your performance tracking system.
Here’s what makes it stand out:
-
Dropdown Menus: Users can choose the month and analysis type (MTD or YTD) to filter data instantly.
-
Actual vs Target Values: Easily compare your brand’s performance against the set goals for each KPI.
-
Color-Coded Indicators: Conditional formatting uses colors or icons (like arrows or traffic lights) to visualize success or shortfalls.
-
Comprehensive KPI Overview: All key metrics are displayed clearly, offering instant insights into how your brand is performing across multiple dimensions.
This layout provides clarity and quick decision support—ideal for busy executives who need fast, accurate updates.
2. KPI Trend Sheet
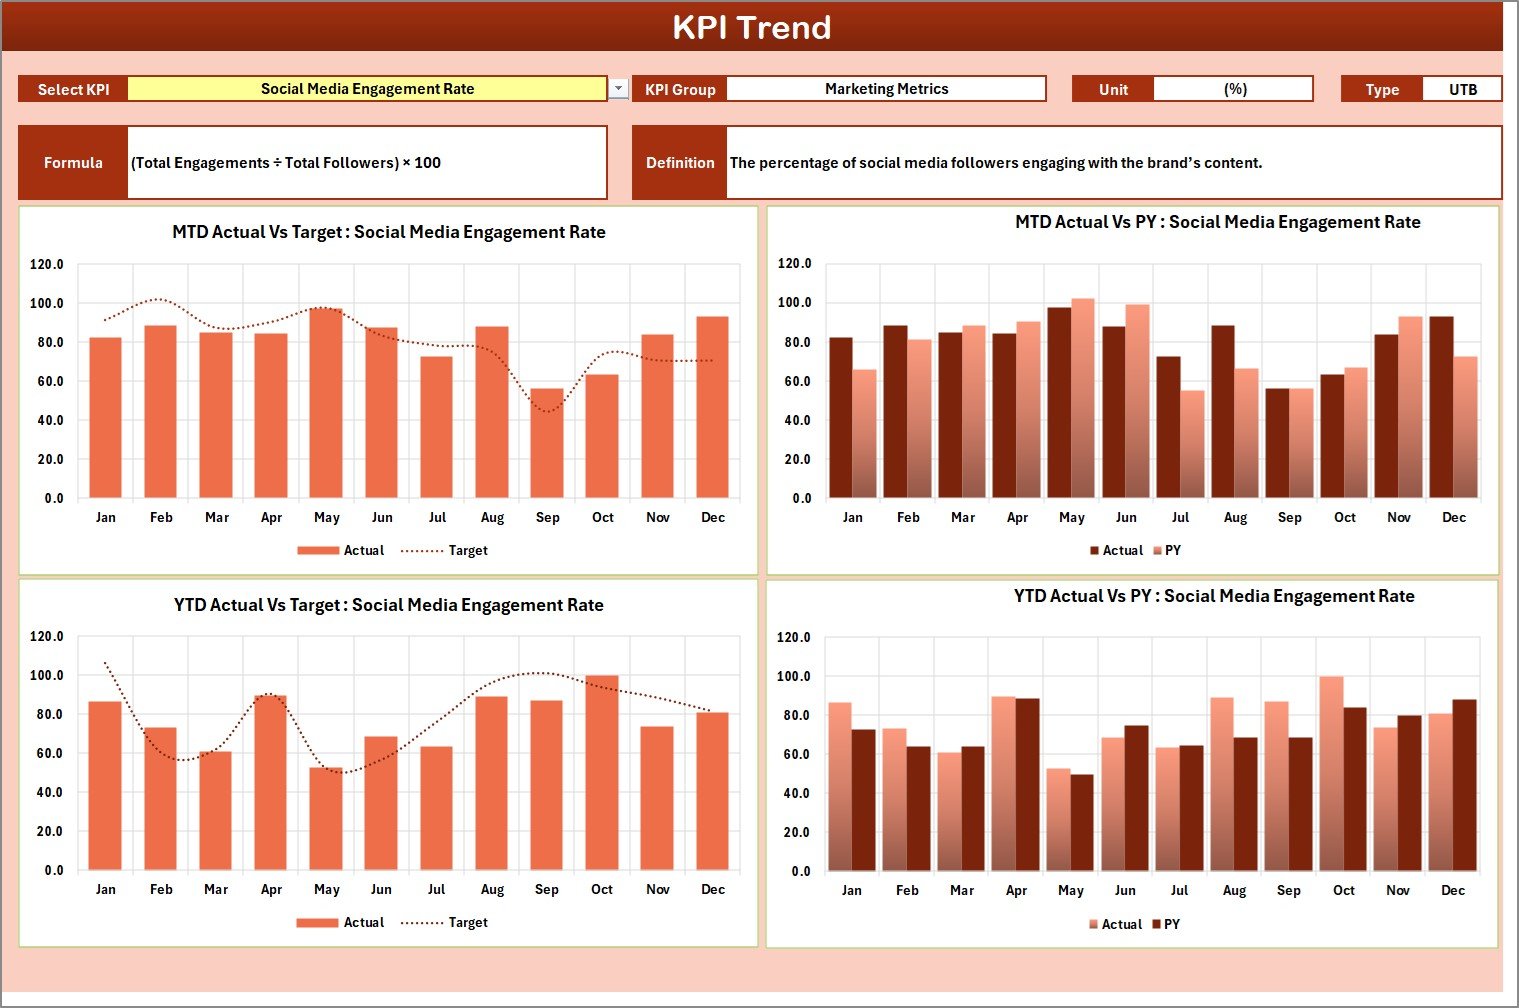
The KPI Trend sheet allows users to dive deeper into performance patterns.
-
KPI Selection Dropdown: Choose a specific KPI (e.g., Gross Profit Margin, Conversion Rate, or Customer Retention) from a dropdown in cell C3.
-
KPI Details: Each selection displays the KPI Group, Unit, Formula, and Type (Lower the Better or Upper the Better).
-
MTD and YTD Charts: View graphical trends showing Actual vs Target vs Previous Year data, making it easier to detect performance fluctuations.
This sheet is perfect for trend analysis and forecasting, giving managers the foresight to act before issues escalate.
3. Input Data Sheet
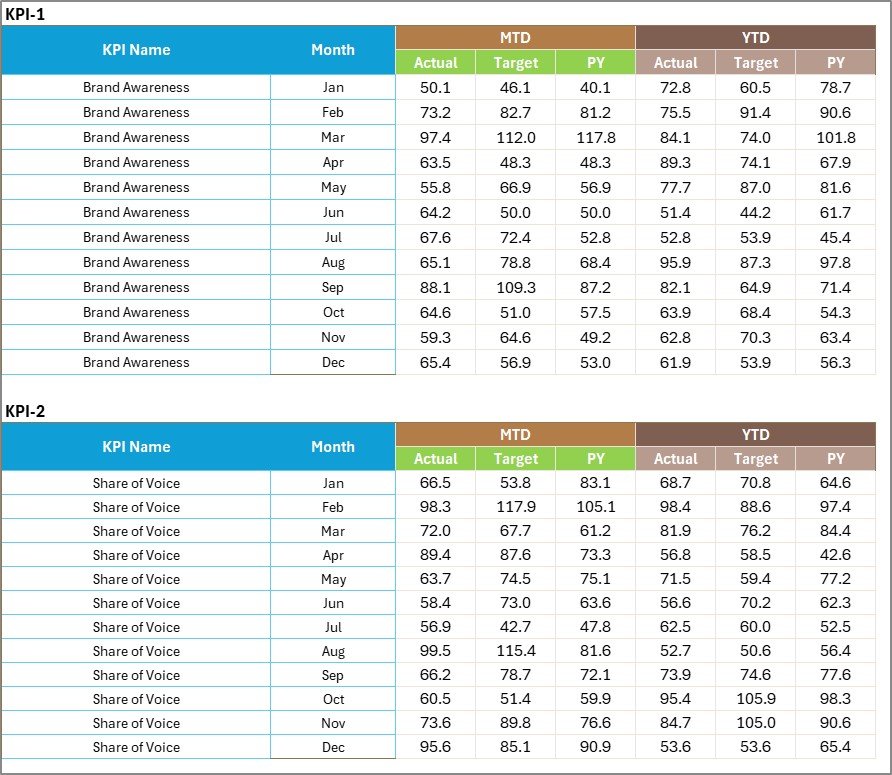
The Input Data sheet is where all raw data is entered and maintained.
-
Data Entry Simplicity: Record Actual, Target, and Previous Year numbers for each KPI.
-
Real-Time Updates: As soon as new data is added, the Scorecard and Trend sheets update automatically.
-
Flexible Design: The structure can adapt to various departments—Sales, Marketing, Customer Relations, or Operations.
This sheet ensures your KPI tracking remains accurate and current, forming the foundation of every visualization in the workbook.
4. KPI Definition Sheet
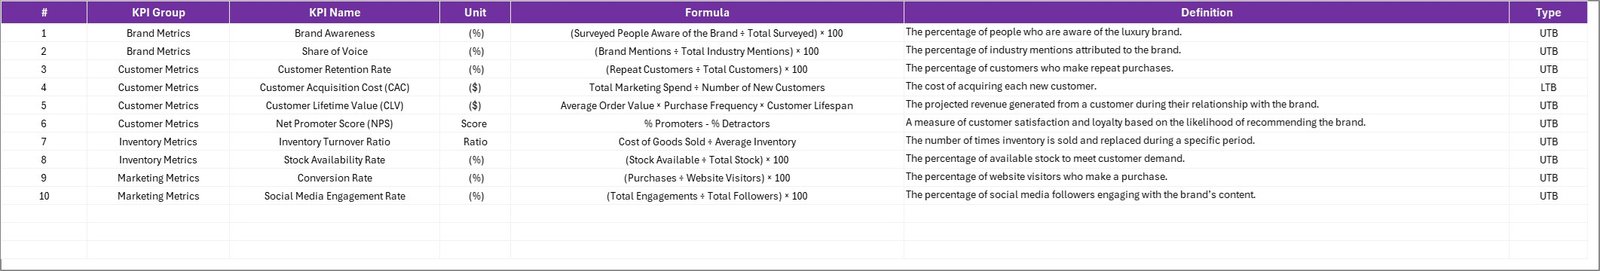
The KPI Definition sheet provides context and clarity.
-
Definition Storage: List each KPI’s Group, Name, Unit, Formula, and Definition.
-
Type Classification: Identify whether each metric is UTB (Upper the Better) or LTB (Lower the Better).
-
Reference Purpose: Helps team members understand what each KPI measures and how it’s calculated.
By maintaining this sheet, your team ensures consistency in understanding and communication across departments.
Examples of KPIs in the Luxury Goods Industry
To make your KPI scorecard effective, you must track the right metrics.
Below are common KPIs relevant to luxury businesses:
Sales and Revenue KPIs
-
Total Sales Revenue
-
Average Transaction Value
-
Sales Growth Rate (MTD/YTD)
-
Gross Profit Margin
-
Revenue per Store or Region
Customer and Marketing KPIs
-
Customer Retention Rate
-
Customer Acquisition Cost
-
Repeat Purchase Percentage
-
Net Promoter Score (NPS)
-
Brand Engagement Rate
Operations and Supply Chain KPIs
-
Inventory Turnover
-
Stock-out Rate
-
Order Fulfillment Time
-
Quality Defect Rate
Financial and Profitability KPIs
-
Operating Profit Margin
-
Return on Assets (ROA)
-
Return on Equity (ROE)
-
Marketing ROI
Tracking these KPIs provides a 360-degree view of business health and ensures alignment with strategic goals.
How to Use the Luxury Goods KPI Scorecard
Implementing the scorecard effectively ensures consistent insights and reliable reporting.
Step 1: Input Data
Begin by entering actual and target values in the Input Data Sheet for each KPI. Update these figures monthly to ensure the dashboard reflects the latest performance.
Step 2: Review KPI Definitions
Check the KPI Definition sheet to verify that each metric aligns with your company’s goals and calculation methods.
Step 3: Analyze Scorecard View
Navigate to the Scorecard sheet and select the desired Month and Period (MTD or YTD) from the dropdown. Review performance indicators and compare Actual vs Target outcomes.
Step 4: Examine Trends
Use the KPI Trend sheet to analyze long-term progress. Look at the graphical representation to identify consistent growth or recurring challenges.
Step 5: Share and Act
Export or present the results to stakeholders. Use the insights to guide marketing strategies, optimize pricing, and enhance operational decisions.
Advantages of the Luxury Goods KPI Scorecard in Excel
Using this scorecard delivers numerous benefits for luxury businesses:
1. Centralized Performance Tracking
The scorecard consolidates all critical KPIs in one file, making it easier to view overall performance instantly.
2. Real-Time Decision Making
Because the dashboard updates automatically when data changes, leaders can make faster, more informed decisions.
3. Improved Accountability
Each KPI clearly identifies ownership, ensuring every department understands its role in achieving goals.
4. Visual Clarity
Color indicators and charts simplify interpretation, so users can quickly identify strong and weak areas.
5. Customization
The Excel format allows full customization—add new KPIs, modify formulas, or integrate additional data sources without coding.
6. Cost-Effective
No expensive BI tools are required. Excel provides a low-cost yet highly functional alternative.
7. Easy Sharing
Teams can easily share or email the scorecard, fostering transparency and collaboration.
Click to Purchases Luxury Goods KPI Scorecard in Excel
Best Practices for Using the Luxury Goods KPI Scorecard
To make the most of your scorecard, follow these best practices:
-
Define Clear KPIs: Ensure every metric aligns with brand objectives—whether profitability, market expansion, or customer loyalty.
-
Use Consistent Data Sources: Maintain data accuracy by using standardized input sources across all departments.
-
Update Regularly: Refresh your data monthly to keep performance reviews relevant.
-
Visualize Intelligently: Use charts and conditional formatting to emphasize key patterns and outliers.
-
Set Realistic Targets: Avoid over-ambitious goals; align targets with past trends and current market conditions.
-
Encourage Collaboration: Involve marketing, finance, and operations teams in reviewing KPI outcomes.
-
Integrate Feedback: Use customer insights (like NPS) to refine your KPIs over time.
-
Automate Calculations: Use Excel formulas to calculate metrics automatically, reducing manual work.
-
Keep It Simple: Avoid overloading the scorecard with unnecessary data. Focus on what truly drives performance.
-
Review Quarterly: Conduct strategic reviews every quarter to adjust KPIs based on evolving business needs.
How This Scorecard Supports Decision-Making
The Luxury Goods KPI Scorecard acts as your digital performance mirror.
-
For Executives: It offers a high-level view of growth trends, profitability, and performance consistency.
-
For Managers: It provides actionable insights to refine daily operations.
-
For Analysts: It enables deeper dives into data correlations, such as how marketing spend affects sales or how inventory levels influence profit margins.
By presenting complex information in a simple visual layout, the scorecard bridges the gap between raw data and strategic action.
Building a Data-Driven Luxury Brand
In the luxury sector, brand equity is everything. While creativity, craftsmanship, and exclusivity remain the soul of luxury, data analytics is its backbone.
A KPI scorecard helps you:
-
Track performance objectively
-
Identify patterns that influence brand perception
-
Optimize resources to enhance profitability
When used consistently, the scorecard becomes not just a reporting tool but a strategic compass guiding your brand toward sustainable growth.
Common Mistakes to Avoid
Even with a well-designed scorecard, misuse can limit results. Watch out for these pitfalls:
❌ Tracking Too Many KPIs: Focus on 10–15 high-impact metrics instead of overwhelming the system.
❌ Ignoring Data Quality: Poor data entry leads to misleading conclusions.
❌ Neglecting Regular Updates: Outdated data reduces reliability.
❌ Not Linking KPIs to Goals: Every metric should support your brand’s mission or financial objectives.
❌ Overcomplicating Visuals: Keep charts clean and understandable.
Avoiding these mistakes ensures your KPI scorecard remains both functional and insightful.
Conclusion
The Luxury Goods KPI Scorecard in Excel is more than just a reporting template—it’s a strategic management tool that transforms data into insight. It empowers luxury brands to measure what truly matters, identify growth opportunities, and maintain operational excellence while preserving brand prestige.
From tracking sales and customer satisfaction to evaluating profitability and quality control, this Excel-based system helps ensure every decision reflects precision and performance.
For any luxury brand seeking to stay ahead in an ever-evolving market, adopting this KPI scorecard is not a choice—it’s a necessity.
Click to Purchases Luxury Goods KPI Scorecard in Excel
Frequently Asked Questions (FAQs)
1. What is the purpose of a KPI Scorecard in the luxury goods industry?
It helps monitor key metrics like sales, customer satisfaction, and profit margins. By using measurable data, brands can make better strategic decisions and sustain high performance.
2. Can I customize the Excel template for my brand?
Yes. The scorecard is fully customizable. You can add new KPIs, change formulas, or update layouts based on your brand’s structure.
3. How often should I update the KPI data?
It’s best to update the data monthly. Regular updates keep performance reviews accurate and timely.
4. Do I need advanced Excel skills to use the scorecard?
No. The template is user-friendly. Basic Excel knowledge—such as using dropdowns and entering data—is enough.
5. What are the most important KPIs for luxury brands?
Common KPIs include Gross Profit Margin, Sales Growth, Customer Retention Rate, Average Order Value, and Inventory Turnover.
6. How can this scorecard help improve profitability?
By comparing actual performance against targets, the scorecard highlights areas where costs can be reduced or opportunities for revenue growth exist.
7. Is Excel reliable for performance tracking?
Yes. Excel provides robust functions, charting tools, and flexibility for businesses that want a practical yet cost-effective solution.
8. Can this tool integrate with other systems?
You can link it with external data sources like CSV exports from POS or CRM systems using Power Query or manual imports.
Click to Purchases Luxury Goods KPI Scorecard in Excel
Visit our YouTube channel to learn step-by-step video tutorials