Home>Blogs>Power BI>Luxury Travel KPI Dashboard in Power BI>Luxury Travel KPI Dashboard in Power BI 2
Luxury Travel KPI Dashboard in Power BI 2
17
May 2025
0Comments Off on Luxury Travel KPI Dashboard in Power BI 2
PK
Meet PK, the founder of PK-AnExcelExpert.com! With over 15 years of experience in Data Visualization, Excel Automation, and dashboard creation. PK is a Microsoft Certified Professional who has a passion for all things in Excel. PK loves to explore new and innovative ways to use Excel and is always eager to share his knowledge with others. With an eye for detail and a commitment to excellence, PK has become a go-to expert in the world of Excel. Whether you're looking to create stunning visualizations or streamline your workflow with automation, PK has the skills and expertise to help you succeed. Join the many satisfied clients who have benefited from PK's services and see how he can take your Excel skills to the next level!
https://www.pk-anexcelexpert.com
Related Articles
NUMBERVALUE Function in Excel with Examples
If you’ve ever faced issues with number formatting in Excel, especially when working with international number formats, the NUMBERVALUE Function
Pipeline Infrastructure KPI Dashboard in Excel
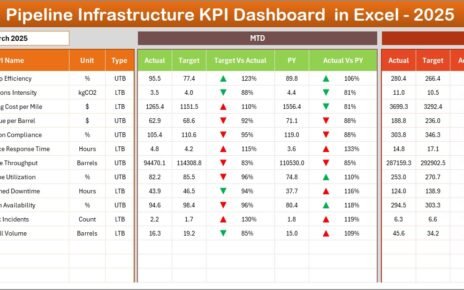
Infrastructure projects require precise monitoring, accurate reporting, and consistent performance tracking. However, managing pipeline infrastructure projects using scattered spreadsheets and
XLOOKUP and XMATCH Function Step by Step Tutorial
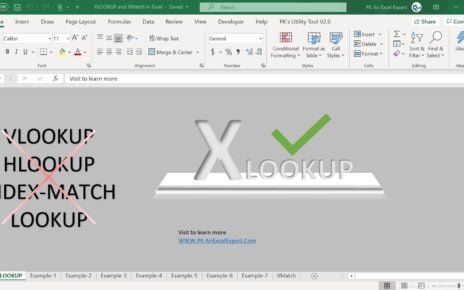
In this article, You will learn how to use XLOOKUP and XMATCH Function in Microsoft Excel. XLOOKUP is very powerful


