Manufacturing companies operate in a highly competitive environment where small cost deviations can lead to big financial impacts. Therefore, leaders must track production performance continuously, compare actual results with standards, and take quick corrective actions. However, traditional Excel reports and manual variance calculations slow teams down and often hide critical insights.
This is exactly where a Manufacturing Production Variance Analysis Dashboard in Power BI plays a vital role.
This powerful dashboard transforms raw production data into clear, interactive, and actionable insights. It helps manufacturing managers understand labor variance, material variance, and production cost variance at plant, department, line, and shift levels. As a result, organizations gain better cost control, higher efficiency, and improved profitability.
Click to Purchases Manufacturing Production Variance Analysis Dashboard in Power BI
In this detailed article, you will learn what this dashboard is, how it works, what each dashboard page shows, its advantages, best practices, and frequently asked questions. By the end, you will clearly understand why this dashboard has become essential for modern manufacturing operations.
What Is a Manufacturing Production Variance Analysis Dashboard in Power BI?
A Manufacturing Production Variance Analysis Dashboard in Power BI is a structured and interactive reporting tool designed to analyze the difference between standard production costs and actual production costs. It focuses on identifying variances across labor, materials, and total production costs.
Instead of reviewing static reports, users can filter data dynamically, explore root causes, and monitor performance trends over time. Moreover, Power BI allows real-time visuals, making the dashboard suitable for daily, weekly, and monthly reviews.
This dashboard helps manufacturing teams answer important questions such as:
-
Why are actual production costs higher than planned?
-
Which department or plant contributes most to cost overruns?
-
Which shifts show higher labor variance?
-
How do monthly cost trends impact overall profitability?
Because of this clarity, decision-makers act faster and manage production costs more effectively.
Why Is Production Variance Analysis Important in Manufacturing?
Production variance analysis plays a critical role in manufacturing because it highlights inefficiencies, waste, and operational gaps. Without proper variance analysis, companies often fail to detect cost issues until it becomes too late.
Here is why variance analysis matters so much:
-
It helps control production costs.
-
It improves labor and material efficiency.
-
It supports accurate budgeting and forecasting.
-
It enables data-driven decision-making.
-
It increases operational accountability.
When manufacturers combine variance analysis with Power BI dashboards, they move from reactive reporting to proactive management.
How Does a Manufacturing Production Variance Analysis Dashboard in Power BI Work?
The dashboard works by comparing standard values with actual values across different dimensions. First, production data gets captured in a structured Excel or database format. Then, Power BI connects to this data and applies calculations to generate variance metrics.
Typically, the dashboard includes:
-
Standard production cost
-
Actual production cost
-
Standard labor cost
-
Actual labor cost
-
Variance percentage calculations
-
Monthly and categorical breakdowns
Because Power BI uses interactive visuals, users can apply slicers such as Month, Plant, Department, Line, or Shift. As a result, managers can analyze performance at any level with just a few clicks.
What Are the Key Features of the Manufacturing Production Variance Analysis Dashboard in Power BI?
This dashboard includes five well-structured pages, each designed for a specific level of analysis. Let us explore each page in detail.
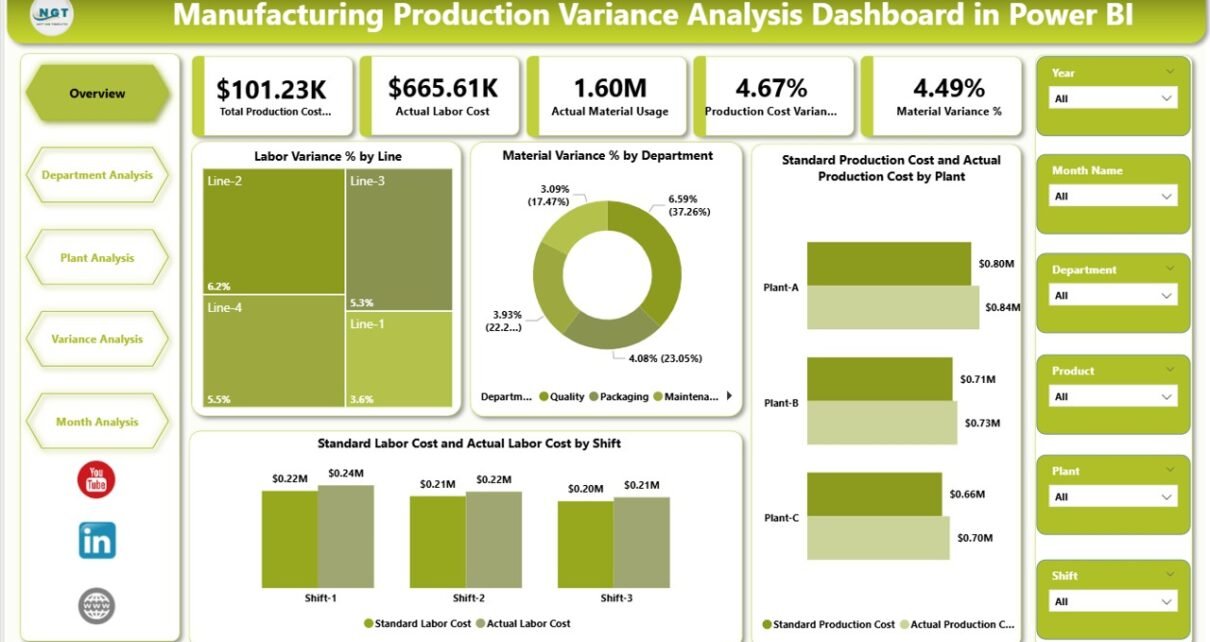
What Does the Overview Page Show in the Dashboard?

The Overview Page acts as the starting point for analysis. It gives management a high-level snapshot of overall production performance.
Key Elements of the Overview Page
This page includes slicers that allow users to filter data by relevant dimensions such as month or plant. These slicers instantly update all visuals.
The page also includes four KPI cards, which display:
-
Overall production variance performance
-
Key cost comparisons
-
Quick cost insights
-
High-level efficiency indicators
Charts on the Overview Page
The Overview Page contains the following four powerful charts:
-
Labor Variance % by Line
This chart shows which production lines experience higher labor cost deviations. As a result, supervisors quickly identify inefficient lines. -
Material Variance % by Department
This visual highlights departments with material usage issues or procurement inefficiencies. -
Standard Production Cost vs Actual Production Cost by Plant
This comparison helps management evaluate cost control at each plant. -
Standard Labor Cost vs Actual Labor Cost by Shift
This chart reveals which shifts contribute most to labor variance.
Because of this layout, the Overview Page helps leaders understand problems immediately.
How Does the Department Analysis Page Help Manufacturing Teams?
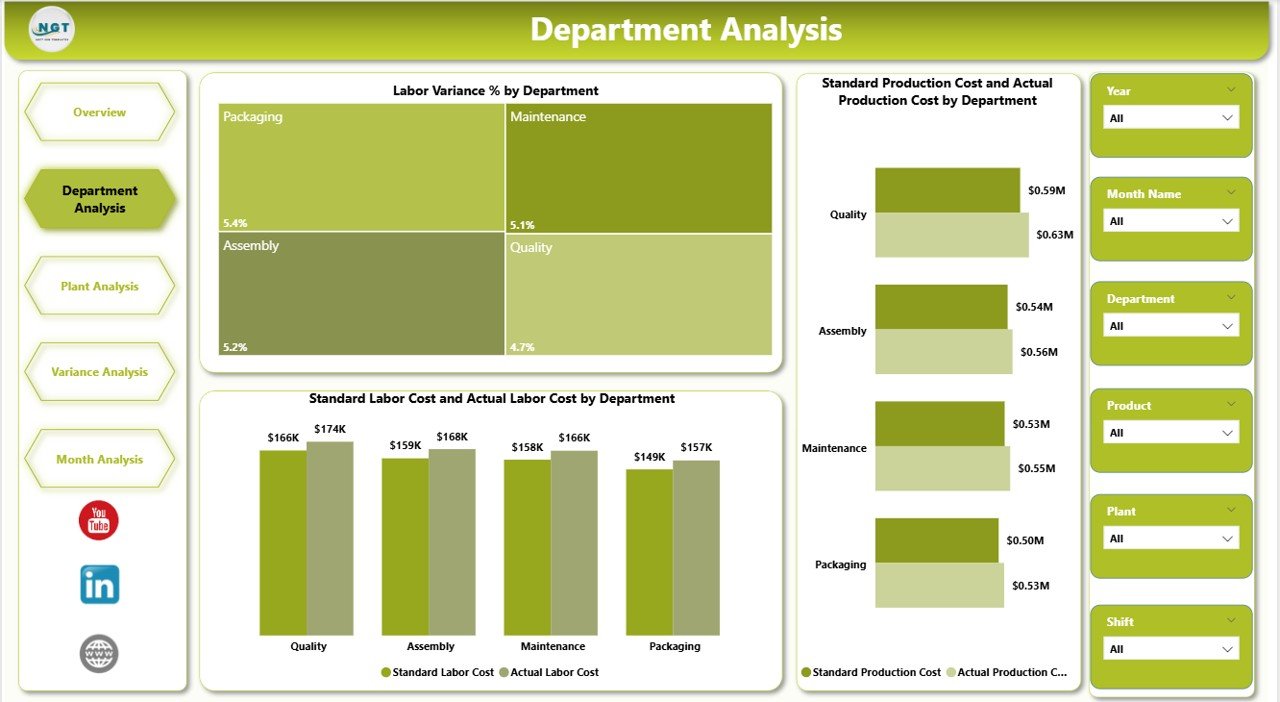
The Department Analysis Page focuses on performance at the department level. This view supports departmental managers who need deeper insights into their cost performance.
Key Charts on the Department Analysis Page
This page includes the following three charts:
-
Labor Variance % by Department
This chart shows how labor efficiency varies across departments. -
Standard Production Cost vs Actual Production Cost by Department
This comparison helps managers identify departments with cost overruns. -
Standard Labor Cost vs Actual Labor Cost by Department
This visual supports workforce planning and productivity improvements. -
Click to Purchases Manufacturing Production Variance Analysis Dashboard in Power BI
Since departments directly influence operational efficiency, this page plays a critical role in cost optimization.
What Insights Does the Plant Analysis Page Provide?
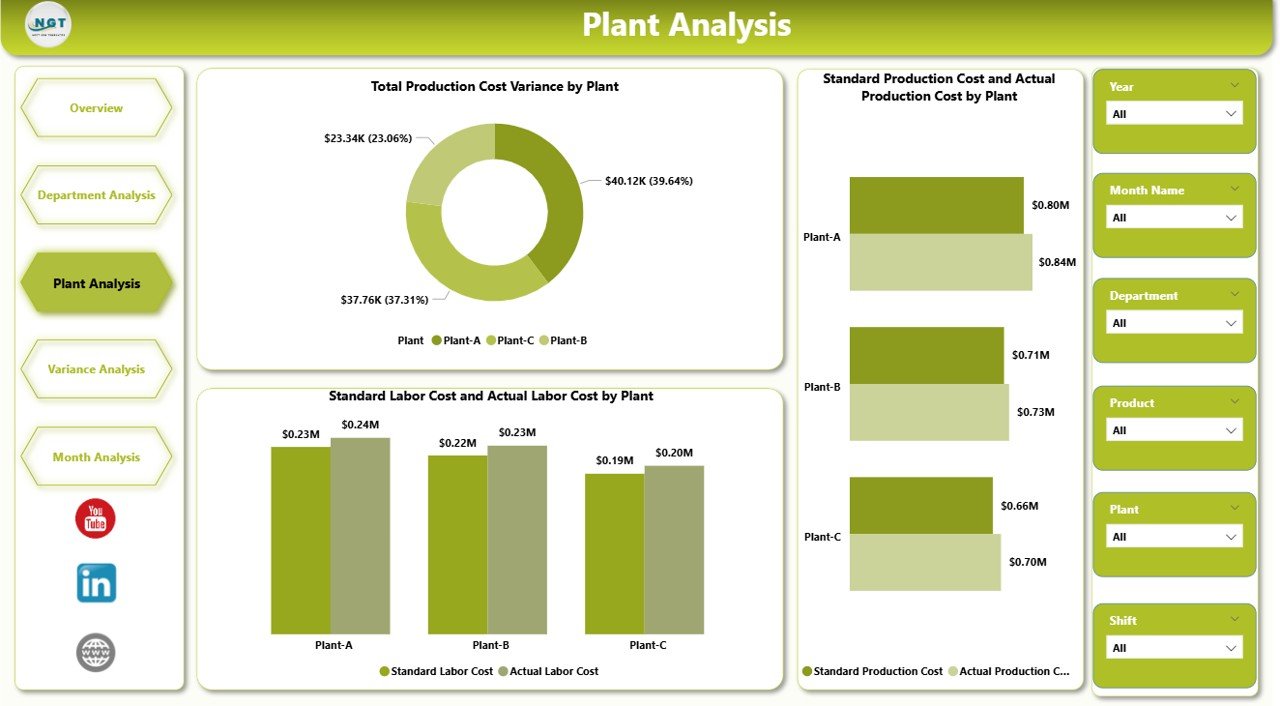
The Plant Analysis Page focuses on plant-level cost performance. Large manufacturing organizations often operate multiple plants, and performance can vary significantly across locations.
Charts on the Plant Analysis Page
This page includes the following three charts:
-
Total Production Cost Variance by Plant
This chart highlights plants with the highest cost deviations. -
Standard Production Cost vs Actual Production Cost by Plant
This comparison helps evaluate how well each plant adheres to budgeted costs. -
Standard Labor Cost vs Actual Labor Cost by Plant
This chart reveals labor efficiency differences across plants.
Because this page provides location-specific insights, leadership teams use it to allocate resources effectively.
Why Is the Variance Analysis Page Critical for Root Cause Identification?

The Variance Analysis Page focuses purely on variance metrics. It allows users to drill deeper into the root causes of deviations.
Charts on the Variance Analysis Page
This page includes three essential variance-focused charts:
-
Production Cost Variance % by Plant
This chart shows how total cost variance differs across plants. -
Material Variance % by Line
This visual highlights material waste or inefficiencies at the line level. -
Labor Variance % by Shift
This chart identifies shifts with lower productivity or higher labor costs.
Because this page highlights variances clearly, managers can act quickly and prevent recurring issues.
Click to Purchases Manufacturing Production Variance Analysis Dashboard in Power BI
How Does the Monthly Trends Page Support Long-Term Planning?
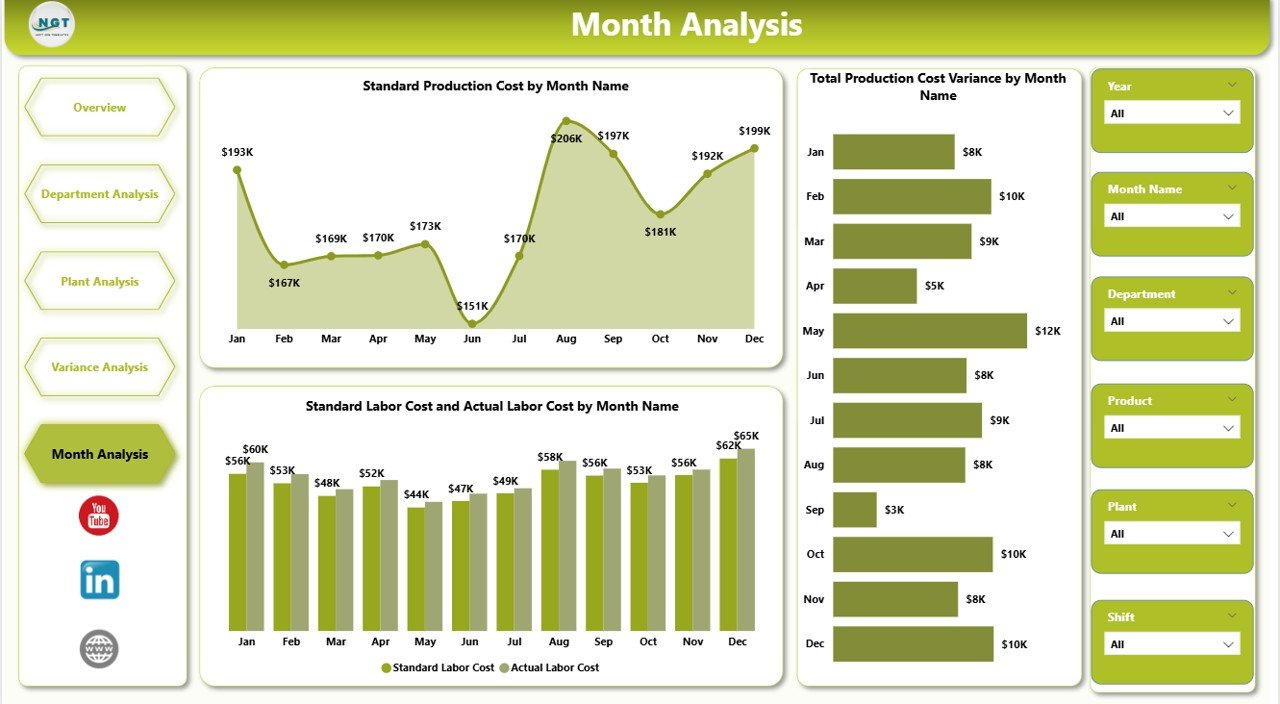
The Monthly Trends Page focuses on historical performance. It helps organizations understand whether cost control improves or worsens over time.
Charts on the Monthly Trends Page
This page includes:
-
Total Production Cost Variance by Month
-
Standard Production Cost by Month
-
Standard Labor Cost vs Actual Labor Cost by Month
By reviewing monthly trends, leadership teams identify seasonal patterns, forecast future costs, and plan corrective actions proactively.
Advantages of Manufacturing Production Variance Analysis Dashboard in Power BI
The dashboard delivers multiple business advantages across operational and strategic levels.
Key Advantages
-
Improved Cost Control
Teams track deviations instantly and prevent cost overruns. -
Faster Decision-Making
Interactive visuals reduce analysis time significantly. -
Higher Operational Efficiency
Managers identify inefficiencies at line, department, and plant levels. -
Better Accountability
Performance transparency improves responsibility across teams. -
Accurate Budget Monitoring
Organizations compare planned vs actual costs continuously. -
Scalable and Flexible Reporting
Power BI adapts easily to changing business needs.
Best Practices for Manufacturing Production Variance Analysis Dashboard in Power BI
To get maximum value from the dashboard, organizations should follow proven best practices.
Recommended Best Practices
-
Maintain clean and structured data sources.
-
Define clear standard cost benchmarks.
-
Update data regularly to ensure accuracy.
-
Use consistent naming conventions for departments and plants.
-
Review dashboards during regular production meetings.
-
Train managers to interpret variance insights correctly.
-
Combine variance data with operational KPIs for deeper analysis.
When teams follow these best practices, the dashboard becomes a powerful decision-support system.
How Does This Dashboard Improve Manufacturing Decision-Making?
Click to Purchases Manufacturing Production Variance Analysis Dashboard in Power BI
The dashboard transforms data into actionable insights. Instead of reacting after financial losses occur, teams monitor performance in real time.
As a result:
-
Managers reduce waste.
-
Supervisors improve shift efficiency.
-
Finance teams gain accurate cost visibility.
-
Leadership aligns strategy with operational reality.
Because of this impact, many manufacturers treat this dashboard as a core performance management tool.
Conclusion: Why Should Manufacturers Use a Production Variance Analysis Dashboard in Power BI?
Manufacturing success depends on cost discipline, efficiency, and timely decisions. A Manufacturing Production Variance Analysis Dashboard in Power BI brings all these elements together in one interactive platform.
It simplifies complex variance calculations, highlights problem areas instantly, and supports data-driven decision-making across all levels. Moreover, it eliminates manual reporting, reduces errors, and saves valuable time.
For any manufacturing organization aiming to improve profitability, efficiency, and control, this dashboard delivers measurable value.
Frequently Asked Questions (FAQs)
What is production variance in manufacturing?
Production variance represents the difference between standard production costs and actual production costs.
Why should manufacturers use Power BI for variance analysis?
Power BI offers interactive visuals, real-time analysis, and easy data filtering, making variance analysis faster and clearer.
Can this dashboard handle multiple plants and departments?
Yes, the dashboard supports plant-wise, department-wise, line-wise, and shift-wise analysis.
Does the dashboard require advanced Power BI skills?
No. End users only need basic filtering knowledge to explore insights.
How often should production variance data be updated?
Organizations should update data daily or weekly for best results.
Can this dashboard integrate with Excel data?
Yes, Power BI connects easily with structured Excel files.
Is this dashboard suitable for small manufacturers?
Yes, both small and large manufacturers benefit from this dashboard.
Visit our YouTube channel to learn step-by-step video tutorials