Marketing success today depends on data-driven decision-making. Businesses cannot rely only on guesswork or intuition. Instead, they need clear insights into how campaigns, channels, and managers perform over time. This is where a Marketing Analytics Dashboard in Excel becomes invaluable.
A well-structured dashboard provides a single view of marketing KPIs, enabling marketers to compare cost vs. revenue, analyze campaign efficiency, and optimize future investments. While there are many expensive analytics tools in the market, Excel remains one of the most cost-effective and flexible solutions for businesses of all sizes.
In this article, we will explore everything you need to know about a Marketing Analytics Dashboard in Excel, its features, benefits, best practices, and real-life applications. We will also share how the prebuilt template can save you time and effort in managing marketing data.
Click to Purchases Marketing Analytics Dashboard in Excel
What is a Marketing Analytics Dashboard in Excel?
A Marketing Analytics Dashboard in Excel is a structured and interactive template that consolidates marketing data into charts, tables, and KPIs. Instead of analyzing raw data manually, marketers can use the dashboard to:
-
Track campaign performance in real-time.
-
Compare cost vs. revenue across channels.
-
Monitor conversion rates by campaign, channel, or manager.
-
Evaluate monthly marketing trends.
-
Identify opportunities to reduce costs and maximize ROI.
By using Excel’s pivot tables, slicers, formulas, and charts, businesses can build an interactive dashboard that works like a professional marketing analytics platform without recurring subscription fees.
Key Features of the Marketing Analytics DashboardTeam Performance Dashboard in Excel
This dashboard is designed with five key analytical pages plus supporting sheets. Let’s explore each one in detail:
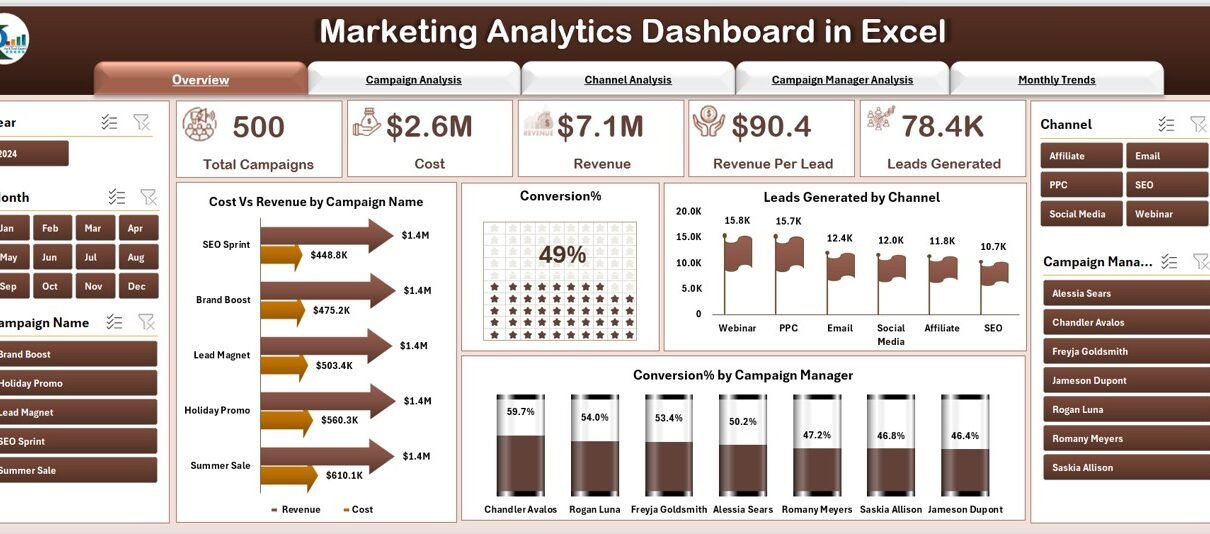
Overview Page
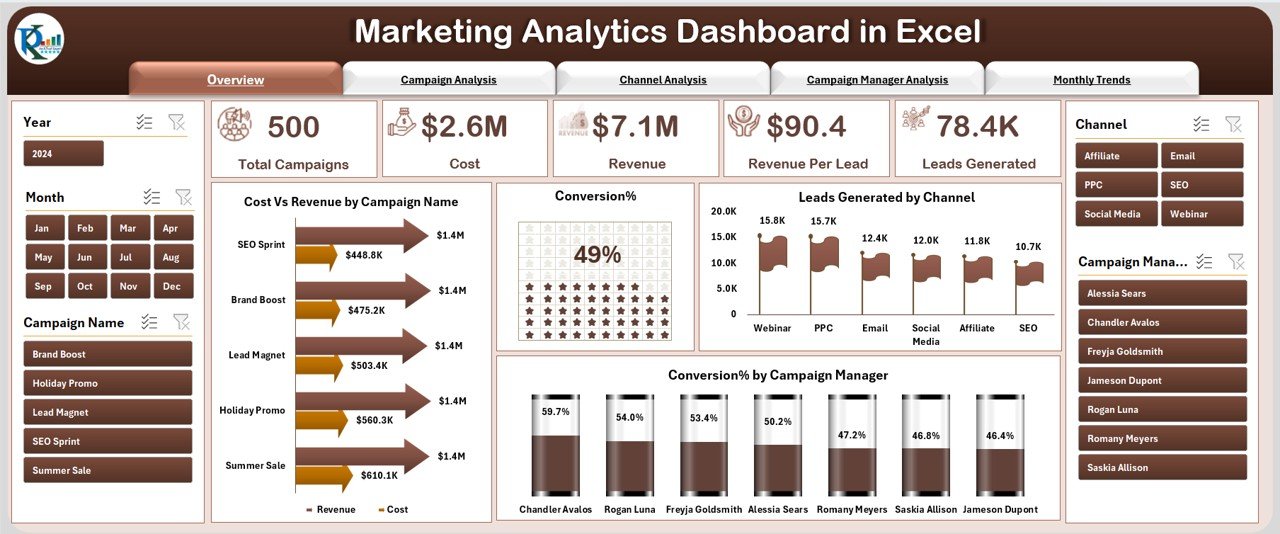
The Overview Page acts as the main control panel of the dashboard. On the left side, a page navigator allows smooth movement across different sections.
On this page, you will find five key cards and charts:
-
Cost vs. Revenue by Campaign Name – Shows profitability of each campaign.
-
Conversion % – Displays how many leads convert into customers.
-
Leads Generated by Channel – Breaks down lead volume across marketing channels.
-
Conversion % by Campaign Manager – Compares performance between managers.
This gives stakeholders a quick snapshot of marketing effectiveness.
Campaign Analysis
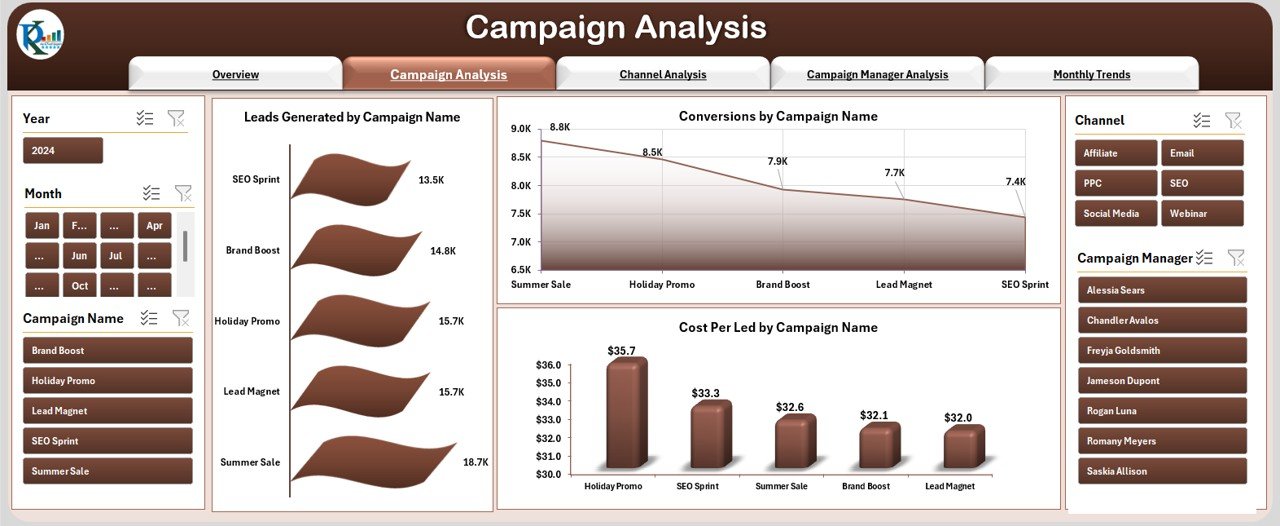
The Campaign Analysis page provides detailed insights into individual campaigns. It highlights three crucial metrics:
-
Leads Generated by Campaign Name – Identifies which campaigns attract the most prospects.
-
Conversion by Campaign Name – Shows which campaigns deliver actual sales.
-
Cost Per Lead by Campaign Name – Helps assess cost-efficiency.
This section makes it easy to determine which campaigns deserve more investment and which ones require adjustments.
Channel Analysis
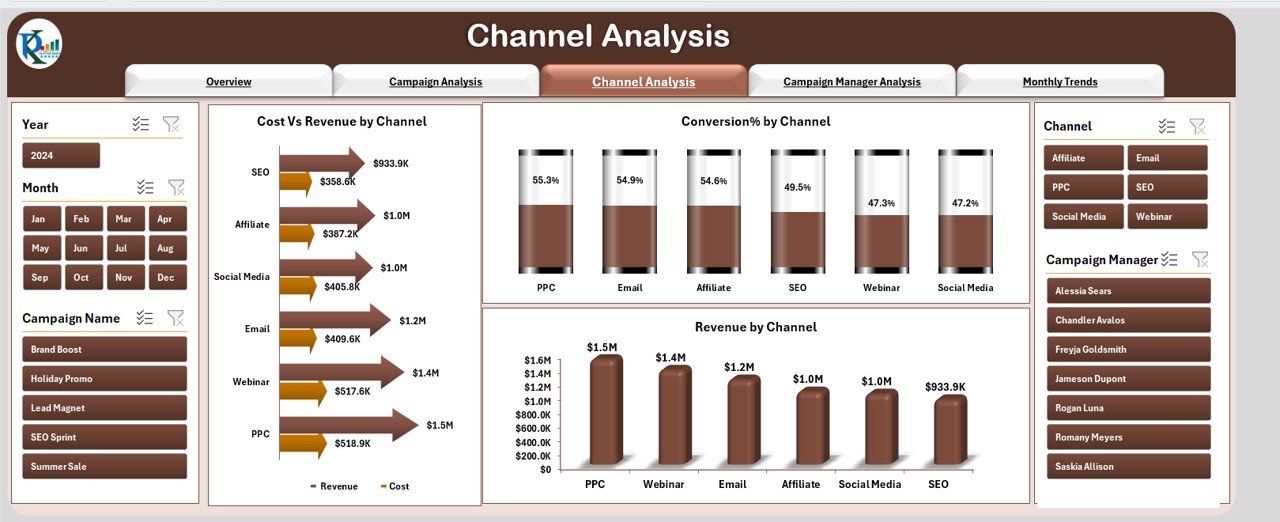
Marketing is rarely limited to a single channel. The Channel Analysis page breaks performance down by marketing channel. It includes:
-
Cost vs. Revenue by Channel – Compares spend with income for each channel.
-
Conversion % by Channel – Highlights conversion efficiency across platforms.
-
Revenue by Channel – Shows which channels drive maximum sales.
With this data, businesses can shift budgets toward high-performing channels.
Campaign Manager Analysis
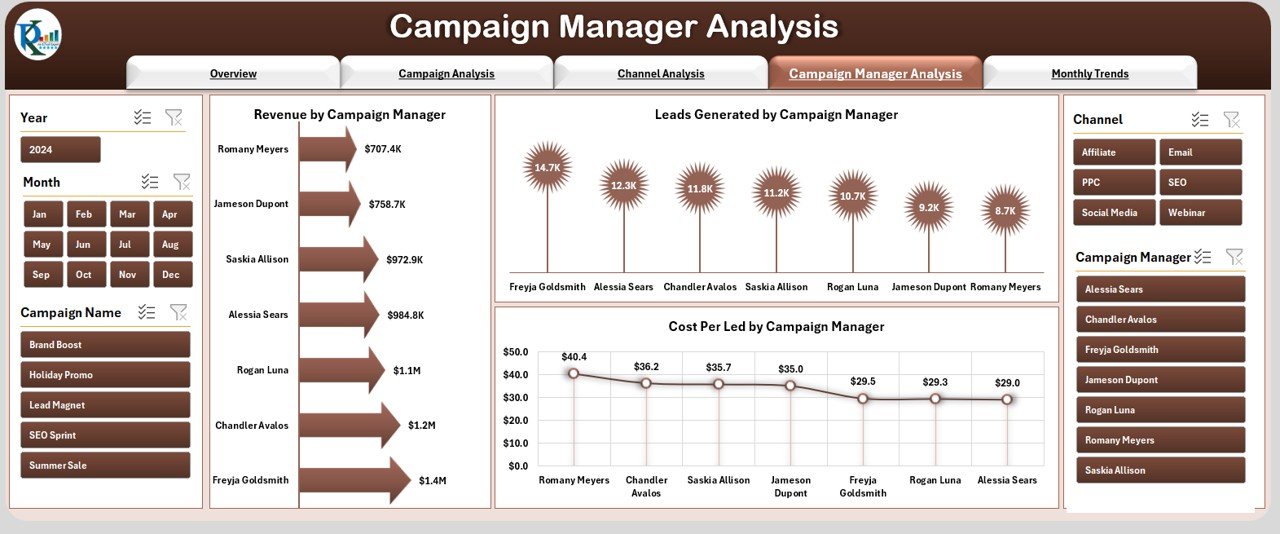
Marketing campaigns succeed only when managers execute them effectively. This page evaluates manager performance using three charts:
-
Revenue by Campaign Manager – Highlights contribution of each manager to revenue.
-
Leads Generated by Campaign Manager – Compares lead generation abilities.
-
Cost Per Lead by Campaign Manager – Evaluates cost efficiency by manager.
This ensures fair performance reviews and supports resource optimization.
Click to Purchases Marketing Analytics Dashboard in Excel
Monthly Trends
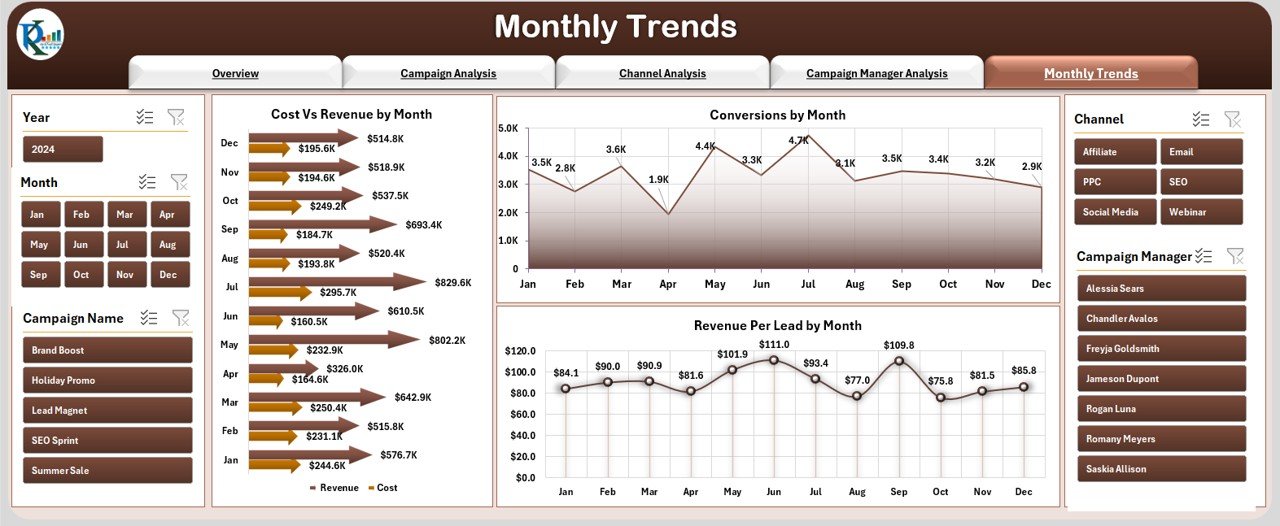
The Monthly Trends page focuses on time-based analysis. Marketers can see patterns and seasonality in performance. It includes:
-
Cost vs. Revenue by Month – Tracks profitability trends.
-
Conversion by Month – Shows how conversion rates change over time.
-
Revenue per Lead by Month – Calculates income generated per lead.
This page is especially useful for quarterly reviews and annual budget planning.
Data Sheet
The Data Sheet is the backbone of the dashboard. All raw marketing data—such as campaign costs, leads, conversions, and revenues—are stored here. The dashboard uses this sheet to update charts and KPIs dynamically.
Support Sheet
The Support Sheet contains lookup lists, dropdown menus, and reference tables that make the dashboard interactive and user-friendly.
Advantages of Marketing Analytics Dashboard in Excel
Using an Excel-based marketing dashboard provides several key advantages:
✅ Cost-Effective – No need to invest in costly BI tools.
✅ Customizable – Easily add or remove KPIs as per business needs.
✅ User-Friendly – Requires only basic Excel knowledge.
✅ Centralized Data – All marketing data in one place.
✅ Faster Decision-Making – Visual KPIs reduce time spent analyzing raw numbers.
✅ Scalable – Works for small businesses as well as larger teams.
Opportunities for Improvement
While Excel dashboards are powerful, there are areas to enhance:
⚡ Data Integration – Manually updating data can be time-consuming. Linking with CRM or Google Analytics improves automation.
⚡ Advanced Visuals – Tools like Power BI provide richer visualization compared to Excel.
⚡ Collaboration – Sharing dashboards in Excel requires version control. Cloud solutions like Google Sheets or Power BI streamline teamwork.
⚡ Data Security – Sensitive campaign data should be protected with password controls.
Best Practices for Marketing Analytics Dashboards
To make the most of your dashboard, follow these best practices:
📊 Define KPIs Clearly – Focus on metrics like Cost per Lead, Conversion Rate, and ROI.
🔍 Use Slicers & Filters – Allow managers to drill down into campaigns or channels.
🗓 Update Data Regularly – Keep the Data Sheet refreshed with the latest numbers.
🎯 Keep Layout Simple – Avoid clutter and use consistent chart colors.
🚀 Automate Reports – Use Excel macros or Power Query to reduce manual work.
📈 Review Monthly Trends – Use trend analysis to plan future campaigns.
How Businesses Can Use This Dashboard
Businesses across industries can apply this template in different ways:
-
Small Businesses – Track performance without expensive software.
-
Marketing Agencies – Showcase campaign results to clients.
-
E-commerce Stores – Monitor ad spend vs. revenue by platform.
-
Corporate Teams – Review manager performance and optimize budget allocations.
Step-by-Step Guide to Using the Dashboard
Enter Raw Data in the Data Sheet (campaign names, costs, leads, conversions, and revenue).
Navigate through Pages using the page navigator on the left.
Apply Filters to analyze performance by campaign, channel, or manager.
Review Monthly Trends to identify seasonal performance.
Generate Reports by exporting visuals into presentations or PDFs.
Conclusion
The Marketing Analytics Dashboard in Excel is a practical and affordable solution for businesses that want to make data-driven marketing decisions. With features such as campaign analysis, channel breakdown, manager insights, and monthly trends, this dashboard provides a 360-degree view of marketing performance.
By adopting best practices and updating data regularly, businesses can use this template to optimize campaigns, reduce costs, and maximize revenue.
Frequently Asked Questions (FAQs)
1. Why should I use Excel for a Marketing Analytics Dashboard?
Excel is cost-effective, widely accessible, and flexible. It provides the same analytical power as many expensive tools but at a fraction of the cost.
2. What data do I need to maintain this dashboard?
You need campaign names, costs, leads, conversions, revenue, and campaign managers. These inputs feed into the Data Sheet and update the dashboard automatically.
3. Can this dashboard track ROI by campaign?
Yes. With cost and revenue data, you can easily calculate ROI for each campaign.
4. How often should I update the dashboard?
Ideally, you should update the Data Sheet weekly or monthly, depending on your campaign activity.
5. Is this dashboard suitable for small businesses?
Absolutely. It works well for small businesses that cannot afford premium marketing tools.
6. Can I customize the KPIs in this template?
Yes, the template is fully customizable. You can add, remove, or edit KPIs as per your marketing needs.
7. Does the dashboard support team collaboration?
If multiple team members need access, you can use Excel Online or convert the template into Google Sheets for real-time collaboration.
8. Can I use this dashboard for client reporting?
Yes, marketing agencies can use this dashboard to create transparent and visually appealing reports for clients.
Visit our YouTube channel to learn step-by-step video tutorials