Marketing teams invest significant budgets across multiple channels, campaigns, and regions. However, many organizations still struggle to measure what actually works. As a result, decision-making often relies on assumptions instead of data. That is exactly why a Marketing ROI Dashboard in Excel becomes an essential tool for modern marketers.
In this detailed article, you will understand what a Marketing ROI Dashboard in Excel is, how it works, why it matters, how to use it effectively, and how each dashboard sheet helps you unlock actionable insights. Moreover, this guide explains dashboard structure, key metrics, advantages, best practices, and frequently asked questions in a clear and practical way.
What Is a Marketing ROI Dashboard in Excel?
A Marketing ROI Dashboard in Excel is a ready-to-use analytical tool that tracks marketing performance by comparing revenue, spend, budget, and returns across campaigns, channels, regions, and time periods.
Instead of reviewing multiple spreadsheets or static reports, this dashboard consolidates all critical marketing KPIs into one interactive Excel file. As a result, marketing managers, analysts, and business owners can quickly evaluate performance and improve ROI.
Most importantly, Excel makes the dashboard easy to use, flexible, and scalable without requiring advanced tools like Power BI or complex software.
Why Do Businesses Need a Marketing ROI Dashboard in Excel?
Marketing budgets continue to rise every year. However, without proper measurement, teams often waste money on low-performing campaigns. Therefore, businesses need a structured way to track results.
A Marketing ROI Dashboard in Excel helps because it:
- Shows exactly where marketing money goes
- Highlights profitable and underperforming channels
- Tracks ROI across campaigns and regions
- Supports faster, data-driven decisions
- Improves accountability across marketing teams
As a result, organizations gain complete visibility into their marketing effectiveness.
What Sheets Are Available in the Marketing ROI Dashboard in Excel?
This ready-to-use dashboard includes multiple structured sheet tabs. Each sheet focuses on a specific type of analysis. Let us explore each one in detail.
Overview Sheet: What Does the Overview Tab Show?
The Overview Sheet acts as the executive summary of the entire dashboard. It provides high-level insights at a glance. Because of this, leadership teams often rely on this sheet for quick reviews.
Key KPIs on the Overview Sheet
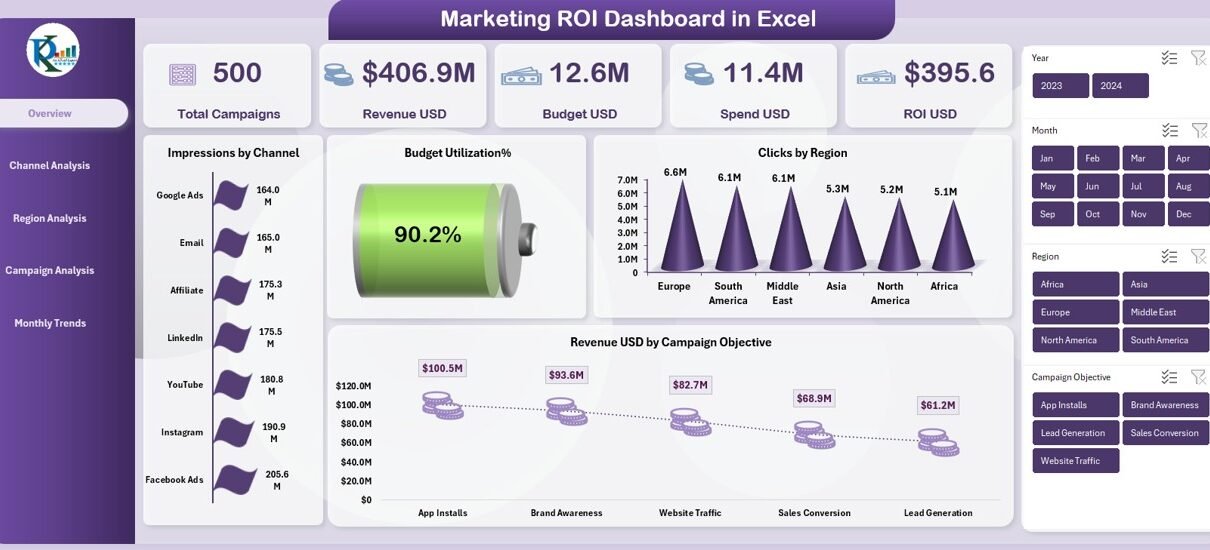
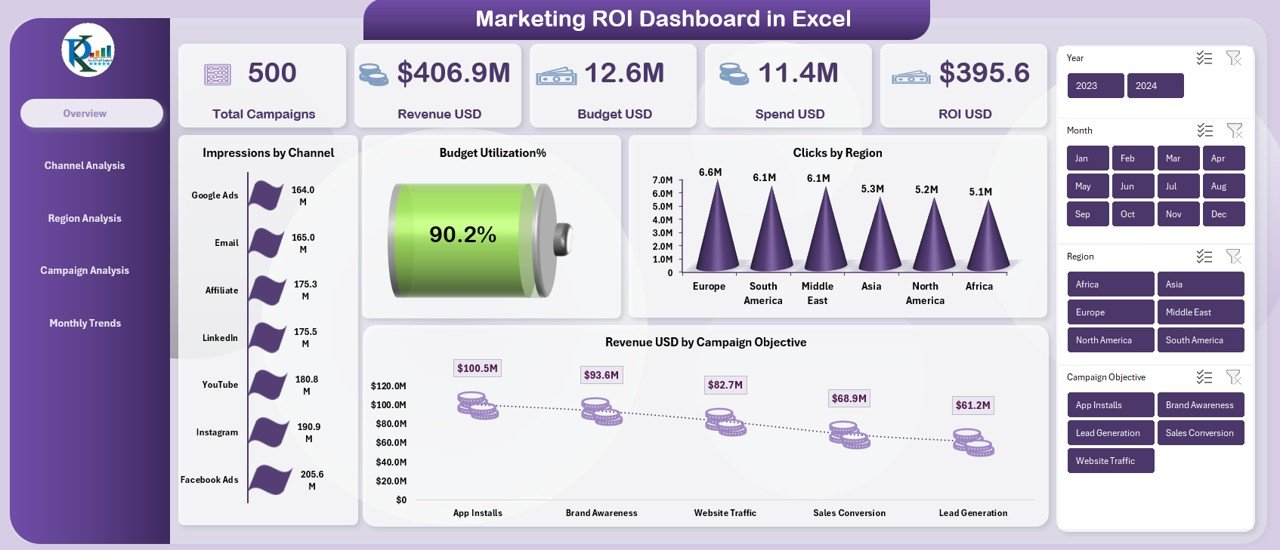
The Overview tab includes powerful KPI cards such as:
- Total Campaigns
- Revenue USD
- Budget USD
- Spend USD
- ROI USD
- Budget Utilization %
These metrics instantly explain overall marketing performance.
Visuals Included in the Overview Sheet
- Impressions by Channel
This chart shows which channels generate the highest reach. - Clicks by Region
This visualization helps identify top-performing geographic markets. - Revenue USD by Campaign Objective
This chart highlights which objectives deliver the highest revenue.
Because of this clean layout, decision-makers can quickly spot growth opportunities and risks.
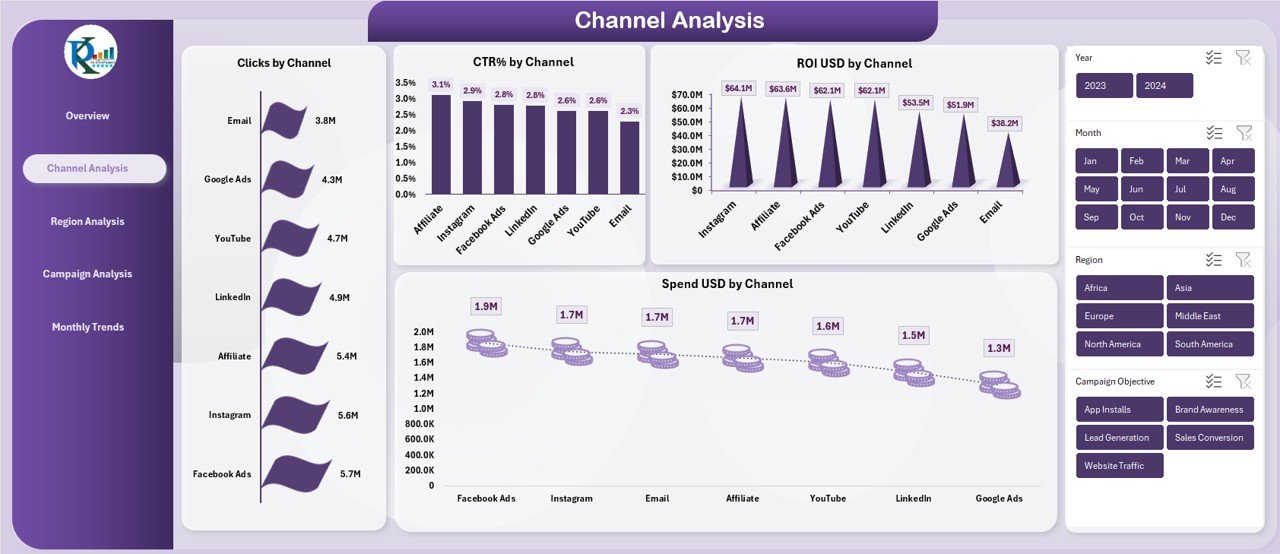
Channel Analysis Sheet: How Do Channels Perform?
Marketing success heavily depends on channel performance. Therefore, the Channel Analysis Sheet dives deeper into channel-wise metrics.
KPIs and Charts in Channel Analysis
- Clicks by Channel
- CTR % by Channel
- ROI USD by Channel
- Spend USD by Channel
This sheet helps marketers understand which channels drive engagement and which ones generate returns.
For example, a channel may generate high clicks but low ROI. As a result, the team can adjust targeting or reduce spend.
Region Analysis Sheet: Which Regions Deliver Results?
Regional performance plays a major role in global and multi-location marketing strategies. Therefore, the Region Analysis Sheet focuses on geography-based insights.
Charts Available in Region Analysis
- Budget USD by Region
- Budget Utilization % by Region
- Impressions by Region
- Conversions by Region
This sheet allows marketers to identify high-growth regions while also detecting underperforming markets.
Because of this clarity, businesses can reallocate budgets more effectively.

Campaign Analysis Sheet: Which Campaign Objectives Perform Best?
Every marketing campaign has a specific objective. However, not all objectives generate equal returns. Therefore, the Campaign Analysis Sheet highlights campaign-level performance.
Key Visuals in Campaign Analysis
- Budget USD by Campaign Objective
- Impressions by Campaign Objective
- Conversions % by Campaign Objective
- ROI USD by Campaign Objective
This sheet answers one critical question:
Which objectives deliver the highest ROI?
As a result, marketing teams can refine campaign strategy and prioritize high-return objectives.

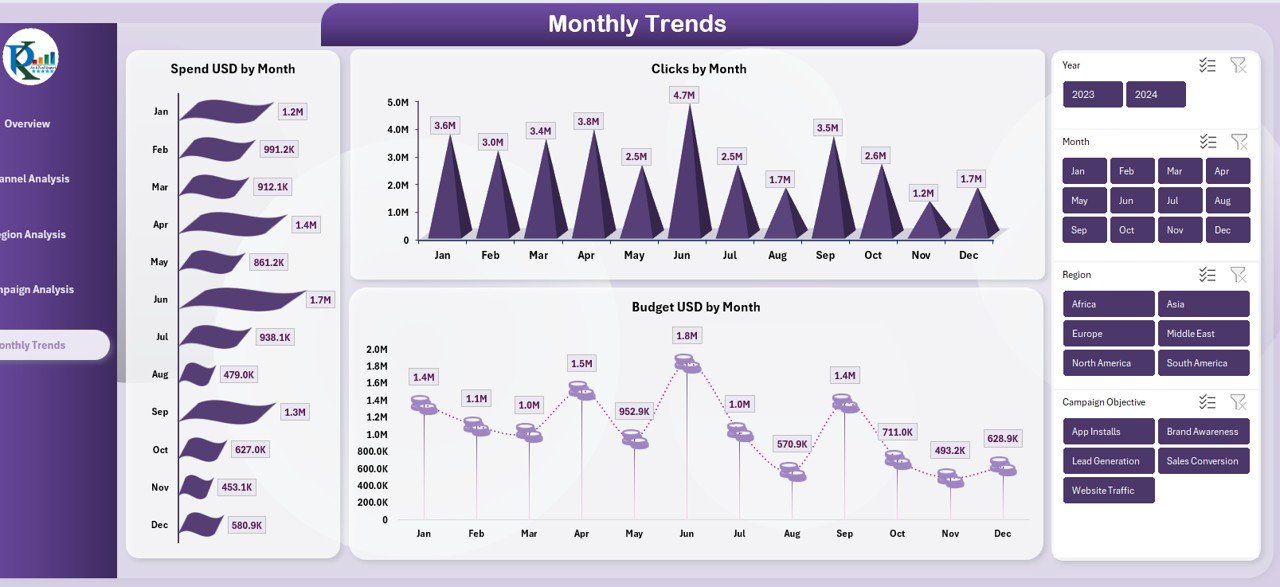
Monthly Trends Sheet: How Does Performance Change Over Time?
Marketing performance does not remain static. Therefore, tracking trends helps teams understand seasonality and timing.
Metrics in Monthly Trends Sheet
- Spend USD by Month
- Clicks by Month
- Budget USD by Month
These charts reveal spending patterns, engagement cycles, and budget shifts across months.
As a result, teams can plan future campaigns more accurately.
How Does the Marketing ROI Dashboard in Excel Improve Decision-Making?
This dashboard improves decision-making because it:
- Combines all KPIs in one file
- Displays data visually for quick understanding
- Supports real-time performance tracking
- Reveals gaps and opportunities instantly
Moreover, Excel enables easy customization based on business needs.
Advantages of Marketing ROI Dashboard in Excel
Centralized Performance Tracking
- Access all marketing KPIs from one dashboard.
- Eliminate scattered spreadsheets and reports.
Cost-Effective Solution
- Use Excel without investing in expensive BI tools.
- Reduce dependency on complex software.
Easy to Use
- No advanced technical skills required.
- Simple navigation across sheet tabs.
Data-Driven Optimization
- Identify high-ROI campaigns instantly.
- Reduce wasteful spending.
Customizable and Scalable
- Add new channels, regions, or campaigns easily.
- Adapt the dashboard as business grows.
Who Can Use a Marketing ROI Dashboard in Excel?
This dashboard benefits multiple roles:
- Marketing Managers for performance tracking
- Digital Marketers for campaign optimization
- Business Owners for ROI visibility
- Marketing Analysts for insights and reporting
- Startups and SMEs for budget control
Because Excel remains widely used, adoption becomes easy across teams.
How to Use the Marketing ROI Dashboard in Excel Effectively?
- First, update campaign data regularly.
- Then, review the Overview Sheet for quick insights.
- Next, analyze channels and regions in detail.
- After that, compare campaign objectives.
- Finally, evaluate monthly trends for future planning.
When teams follow this sequence, decisions become more accurate and timely.
Best Practices for the Marketing ROI Dashboard in Excel
Keep Data Clean and Consistent
- Use standardized naming for channels and campaigns.
- Avoid duplicate or missing entries.
Track Both Spend and Revenue
- Always update spend, budget, and revenue values.
- Calculate ROI accurately.
Review Data Weekly or Monthly
- Schedule regular performance reviews.
- Avoid long gaps between evaluations.
Focus on Actionable Metrics
- Prioritize ROI, CTR, conversions, and budget utilization.
- Ignore vanity metrics that add no value.
Customize for Business Goals
- Align KPIs with company objectives.
- Add new charts when needed.
Common Challenges Without a Marketing ROI Dashboard
Without a dashboard, businesses often face:
- Unclear ROI across campaigns
- Budget overspending
- Delayed performance tracking
- Poor allocation of resources
- Limited visibility into regional performance
However, this Excel dashboard solves all these problems efficiently.
Why Choose Excel for a Marketing ROI Dashboard?
Excel remains one of the most trusted tools for analytics. It offers:
- Wide accessibility
- Easy formula integration
- Strong visualization options
- Offline availability
- Seamless data updates
Because of these benefits, Excel continues to dominate marketing analytics.
Conclusion: Why a Marketing ROI Dashboard in Excel Is Essential
A Marketing ROI Dashboard in Excel empowers marketers to move from guesswork to precision. It combines clarity, flexibility, and actionable insights into one powerful tool.
By using this dashboard, organizations gain complete control over marketing budgets, channel performance, regional results, and campaign effectiveness. Moreover, Excel makes analytics accessible without complexity or high cost.
Ultimately, this dashboard transforms marketing data into smarter decisions and higher returns.
Frequently Asked Questions (FAQs)
What is a Marketing ROI Dashboard in Excel?
A Marketing ROI Dashboard in Excel tracks revenue, budget, spend, and ROI across campaigns, channels, and regions using visual analytics.
Can beginners use this dashboard?
Yes. The dashboard uses simple Excel features and clear visual layouts.
Does this dashboard support multiple campaigns?
Yes. You can analyze multiple campaigns, objectives, channels, and regions.
Is Excel better than BI tools for ROI tracking?
Excel works best for small to medium teams due to flexibility and low cost.
How often should data be updated?
You should update data weekly or monthly for accurate insights.
Can I customize this dashboard?
Yes. You can easily add new KPIs, charts, or filters.
Visit our YouTube channel to learn step-by-step video tutorials