Healthcare organizations continuously focus on improving patient care, operational efficiency, and medical outcomes. This responsibility becomes even more important in maternity hospitals because they handle sensitive cases such as pregnancy care, childbirth, maternal health, and newborn care. Therefore, hospital administrators must monitor multiple performance indicators regularly.
However, many maternity hospitals still rely on scattered spreadsheets, manual reports, or delayed data analysis. As a result, managers struggle to track important metrics such as delivery success rate, patient satisfaction, maternal complications, bed utilization, and staff efficiency. Without a structured monitoring system, decision-making becomes slow and less effective.
Therefore, healthcare organizations increasingly use analytics dashboards to track hospital performance. One powerful solution is the Maternity Hospitals KPI Dashboard in Power BI. This dashboard helps hospital administrators monitor key performance indicators, analyze trends, and improve operational efficiency through interactive visualizations.
In this article, you will learn everything about the Maternity Hospitals KPI Dashboard in Power BI, including what it is, why hospitals need it, how it works, its key features, advantages, best practices, and frequently asked questions.
Click to buy Maternity Hospitals KPI Dashboard in Power BI
What is a Maternity Hospitals KPI Dashboard in Power BI?
A Maternity Hospitals KPI Dashboard in Power BI is a data analytics tool that helps hospitals monitor and evaluate maternity-related performance indicators. It collects data from different hospital systems and presents it in a visual dashboard format.
Power BI allows hospitals to transform raw data into interactive charts, tables, and KPI indicators. Consequently, hospital managers can quickly analyze performance, detect problems, and improve healthcare services.
For example, maternity hospitals often track KPIs such as:
- Number of deliveries
- Cesarean section rate
- Maternal mortality rate
- Neonatal mortality rate
- Patient satisfaction score
- Bed occupancy rate
- Average length of stay
Instead of analyzing these metrics manually, hospitals can view them in a centralized Power BI dashboard. As a result, decision-makers gain clear insights into hospital operations.
Why Do Maternity Hospitals Need a KPI Dashboard?
Maternity hospitals handle complex operations involving doctors, nurses, medical equipment, and patient care. Therefore, managers must monitor performance continuously.
Without proper monitoring tools, hospitals face several challenges.
Common Challenges Without KPI Dashboards
- Lack of centralized performance monitoring
- Delayed reporting and analysis
- Difficulty identifying operational issues
- Poor visibility into patient outcomes
- Inefficient resource utilization
However, a Power BI KPI dashboard solves these challenges by providing real-time insights and visual reporting.
Key Reasons Hospitals Use KPI Dashboards
- Monitor hospital performance efficiently
- Improve patient care quality
- Track operational efficiency
- Identify performance gaps quickly
- Support data-driven decision making
Consequently, hospitals can improve maternal and neonatal care while also optimizing operational processes.
How Does the Maternity Hospitals KPI Dashboard in Power BI Work?
The Maternity Hospitals KPI Dashboard in Power BI works by collecting hospital data, processing it, and presenting it in interactive visual reports.
First, users enter data into Excel sheets. Then Power BI connects to the Excel file and transforms the data into visual dashboards.
After that, hospital managers can analyze KPIs using slicers, charts, and performance indicators.
Workflow of the Dashboard
- Hospital staff enters KPI data into Excel sheets.
- Power BI connects to the Excel data source.
- The dashboard processes the data and calculates KPI metrics.
- Visual reports display the performance indicators.
- Managers analyze trends and take corrective actions.
Therefore, the dashboard helps hospitals convert raw data into meaningful insights.
Key Features of the Maternity Hospitals KPI Dashboard in Power BI
The dashboard includes three main pages in the Power BI Desktop file. Each page serves a specific analytical purpose.
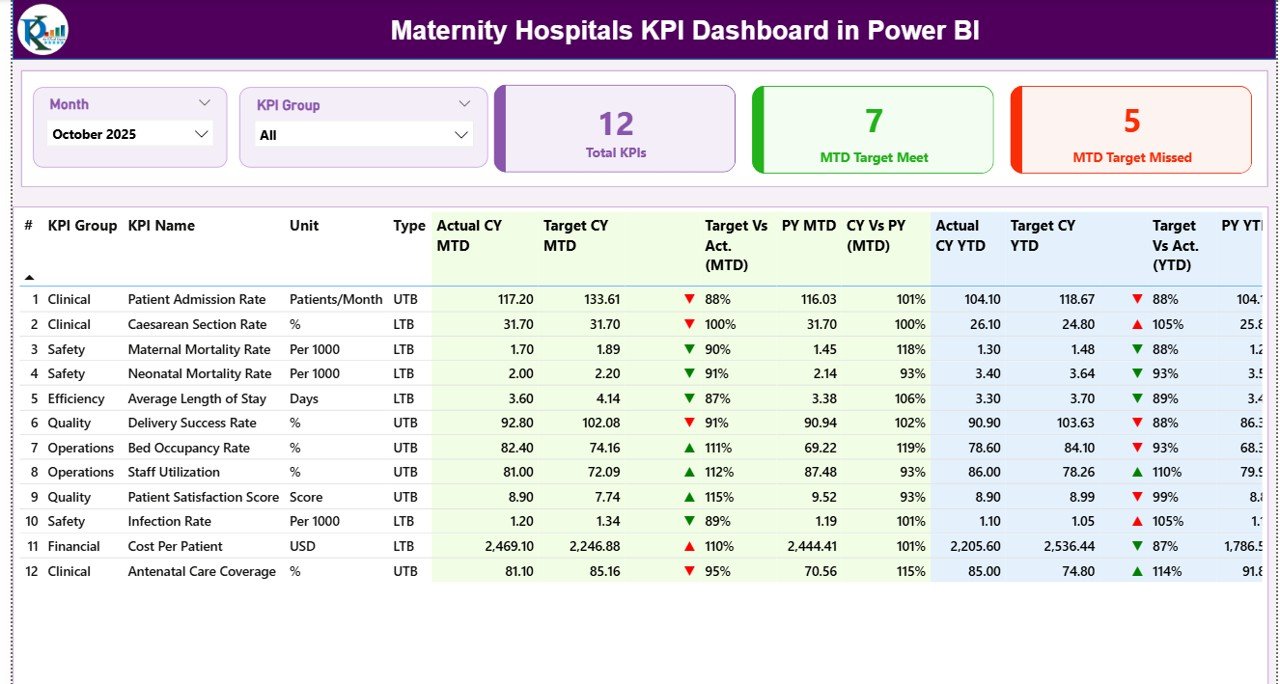
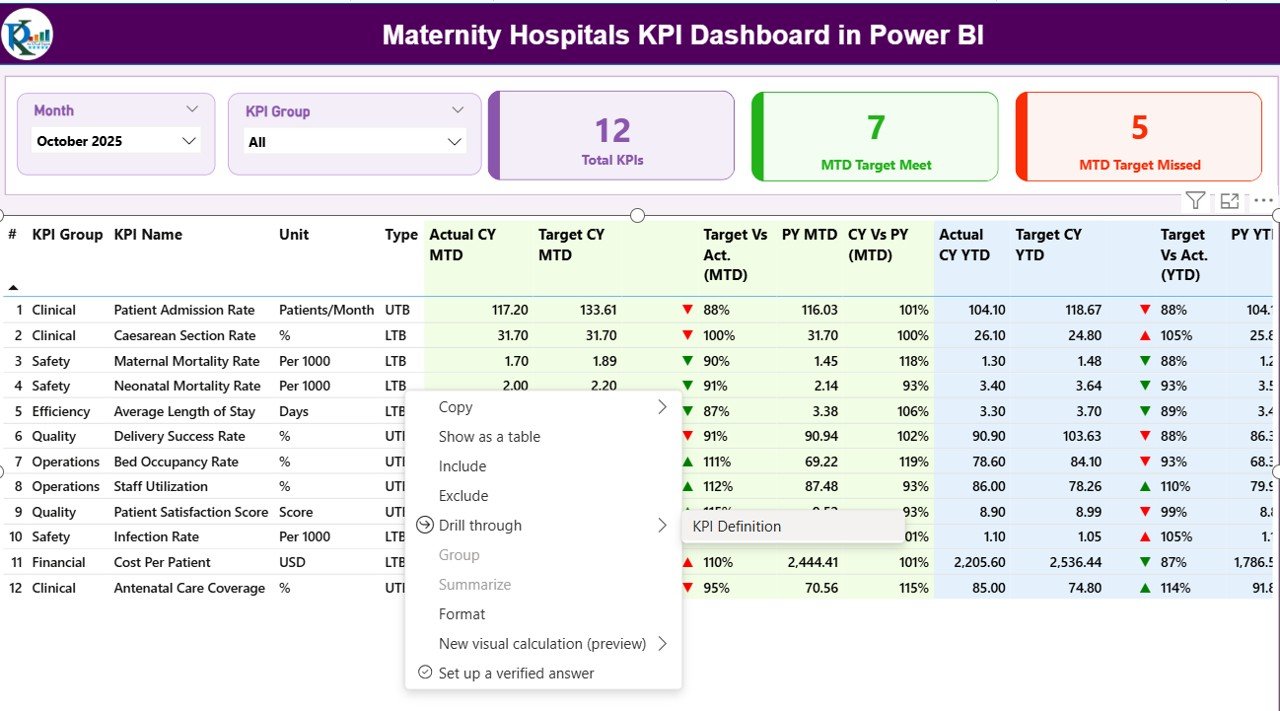
Summary Page
The Summary Page acts as the main overview page of the dashboard. It provides a quick snapshot of hospital KPI performance.
Dashboard Filters
At the top of the dashboard, users can select:
- Month slicer
- KPI Group slicer
These filters allow users to analyze specific periods or KPI categories.
KPI Cards
The dashboard displays three key performance cards:
- Total KPIs Count
- MTD Target Meet Count
- MTD Target Missed Count
These KPI cards help administrators understand overall performance instantly.
Detailed KPI Table
The dashboard also includes a detailed table containing the following information:
KPI Number
Sequence number assigned to each KPI.
KPI Group
Category or group of the KPI.
KPI Name
Name of the performance indicator.
Unit
Measurement unit used for the KPI.
Type
Indicates whether the KPI is:
- LTB (Lower the Better)
- UTB (Upper the Better)
MTD Performance Metrics
The dashboard tracks Month-to-Date (MTD) performance metrics.
These include:
- Actual CY MTD – Current year actual MTD value
- Target CY MTD – Target MTD value
- MTD Icon – Visual indicator showing KPI status
- Target vs Actual (MTD) – Percentage comparison
- PY MTD – Previous year MTD value
- CY vs PY (MTD) – Comparison between current and previous year
Visual icons such as green ▲ and red ▼ help users quickly identify KPI performance.
YTD Performance Metrics
Similarly, the dashboard tracks Year-to-Date (YTD) metrics.
These include:
- Actual CY YTD
- Target CY YTD
- YTD Icon
- Target vs Actual (YTD)
- PY YTD
- CY vs PY (YTD)
These metrics allow hospital administrators to analyze long-term performance trends.
Click to buy Maternity Hospitals KPI Dashboard in Power BI
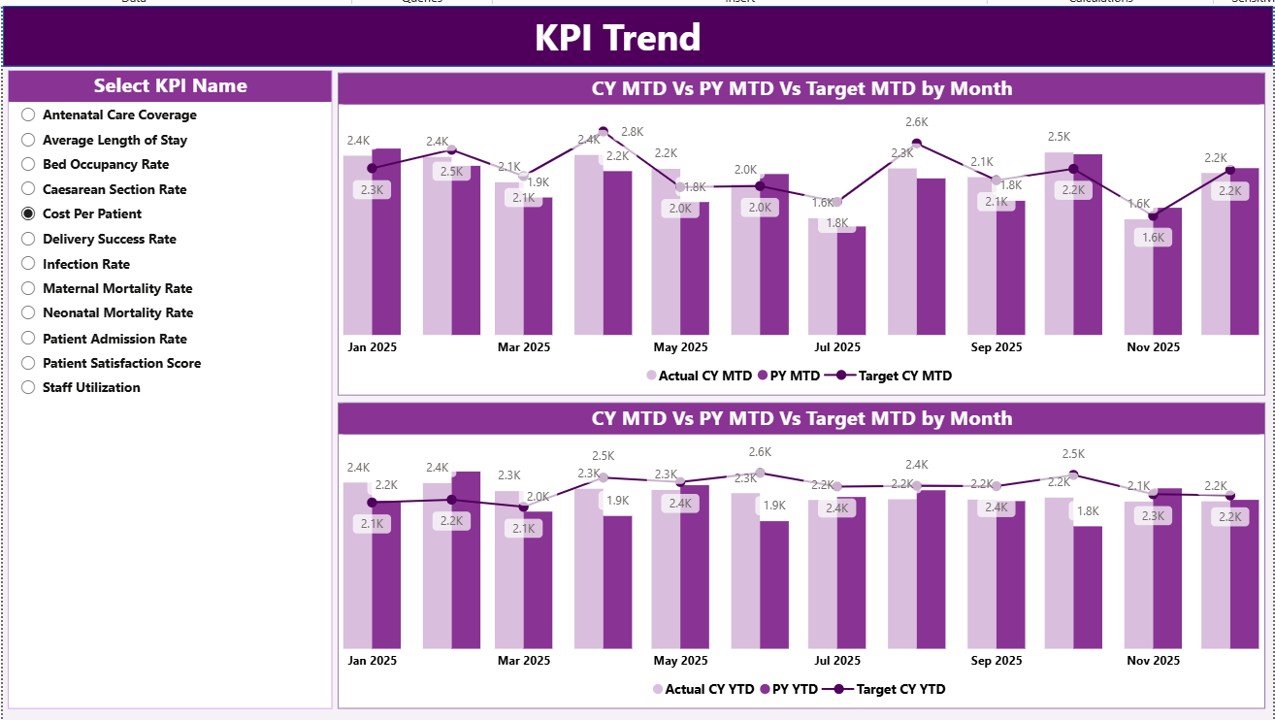
KPI Trend Page
The KPI Trend Page focuses on performance trends over time.
This page contains two combo charts that display:
- Current year actual values
- Previous year values
- Target values
The charts show both MTD and YTD trends, allowing users to track performance changes.
Additionally, a KPI Name slicer allows users to select any KPI and analyze its trend.
Therefore, administrators can quickly identify patterns or performance fluctuations.
Click to buy Maternity Hospitals KPI Dashboard in Power BI
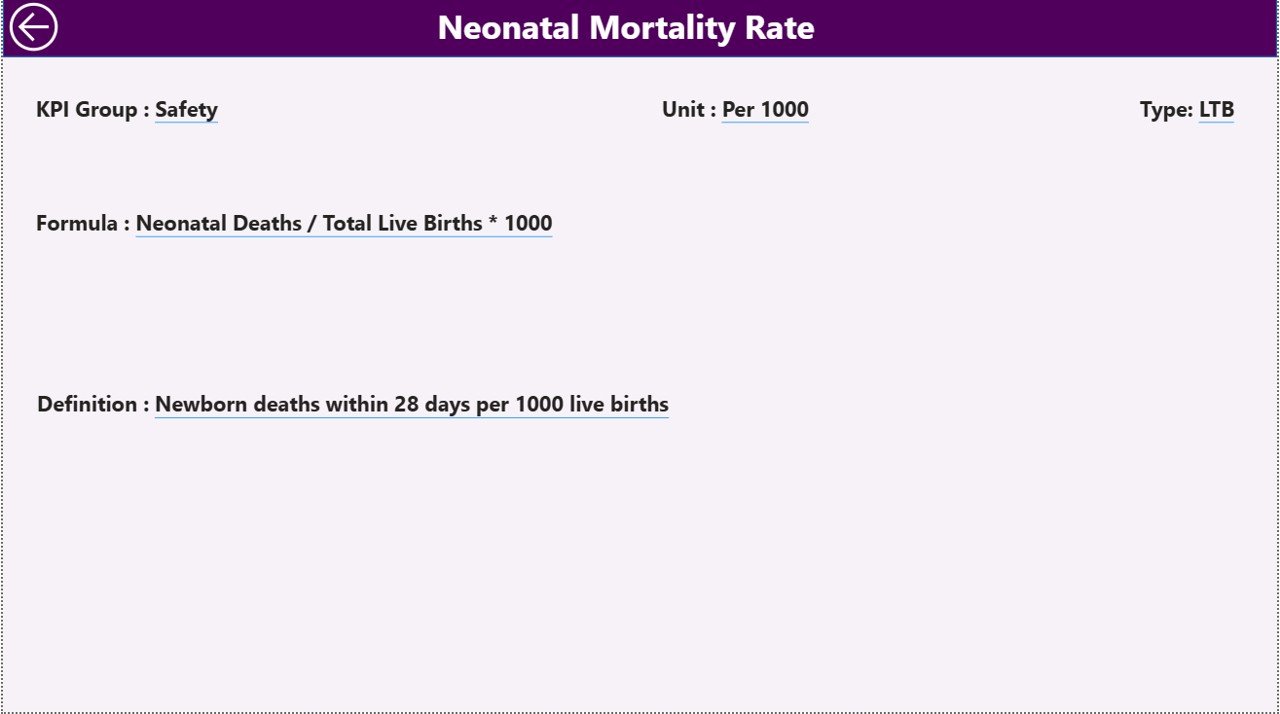
KPI Definition Page
The KPI Definition Page provides detailed explanations for each KPI.
This page remains hidden and works as a drill-through page.
From the Summary Page, users can drill through to see detailed KPI information, including:
- KPI formula
- KPI definition
- KPI unit
- KPI category
Furthermore, users can return to the main page by clicking the back button located in the top left corner.
Click to buy Maternity Hospitals KPI Dashboard in Power BI
Excel Data Source Structure
The dashboard uses an Excel file as the data source. Users must fill three worksheets in the Excel file.
Input_Actual Sheet
In this sheet, users enter the actual performance data.
Required fields include:
- KPI Name
- Month (first date of month)
- MTD value
- YTD value
This sheet records actual hospital performance metrics.
Click to buy Maternity Hospitals KPI Dashboard in Power BI
Input_Target Sheet
This sheet stores target values for each KPI.
Users must enter:
- KPI Name
- Month
- MTD target
- YTD target
These targets allow the dashboard to compare performance against expectations.
KPI Definition Sheet
This sheet contains the metadata of KPIs.
Required information includes:
- KPI Number
- KPI Group
- KPI Name
- Unit
- Formula
- Definition
- KPI Type (LTB or UTB)
This information helps users understand the purpose of each KPI.
Advantages of the Maternity Hospitals KPI Dashboard in Power BI
The dashboard provides several important benefits for healthcare organizations.
- Improved Performance Monitoring
Hospital managers can monitor multiple KPIs in a single dashboard. Consequently, they gain better visibility into hospital operations.
- Faster Decision Making
Interactive dashboards allow administrators to analyze data quickly. Therefore, hospitals can make faster and more informed decisions.
- Better Patient Care
By monitoring KPIs such as maternal outcomes and delivery success rates, hospitals can improve patient care quality.
- Operational Efficiency
Hospitals can track staff productivity, bed utilization, and service efficiency. As a result, they can optimize resource allocation.
- Real-Time Data Insights
Power BI dashboards update automatically when new data enters the Excel sheets. Therefore, administrators always see updated information.
- Easy Data Visualization
Charts, icons, and color indicators make the data easy to understand.
- Customizable Reporting
Hospitals can modify the dashboard according to their specific KPIs.
Best Practices for the Maternity Hospitals KPI Dashboard in Power BI
Hospitals should follow certain best practices to maximize the benefits of the dashboard.
- Define Clear KPIs
Hospitals must define KPIs that align with healthcare objectives.
Examples include:
- Delivery success rate
- Maternal complication rate
- Neonatal survival rate
Clear KPIs ensure accurate performance tracking.
- Maintain Accurate Data Entry
Staff should update Excel data regularly and accurately.
Incorrect data leads to misleading analytics.
- Monitor KPIs Regularly
Hospital administrators should review dashboard reports frequently. Regular monitoring helps identify issues early.
- Train Hospital Staff
Staff members should understand how to interpret dashboard reports. Proper training improves decision-making.
- Focus on Data-Driven Decisions
Managers should use dashboard insights to guide operational improvements.
- Customize KPIs for Hospital Goals
Different hospitals may require different KPIs. Therefore, hospitals should customize the dashboard according to their priorities.
Who Can Benefit from This Dashboard?
Several healthcare professionals can benefit from this dashboard.
Hospital Administrators
They can monitor operational performance and strategic KPIs.
Doctors and Medical Staff
They can track treatment outcomes and quality indicators.
Healthcare Analysts
They can analyze performance trends and generate insights.
Hospital Management Teams
They can monitor financial and operational performance.
Healthcare Consultants
They can use the dashboard to evaluate hospital performance.
Conclusion
Maternity hospitals play a crucial role in ensuring safe pregnancies, healthy childbirth, and proper maternal care. Therefore, hospital administrators must continuously monitor operational performance and patient outcomes.
The Maternity Hospitals KPI Dashboard in Power BI provides a powerful solution for tracking hospital performance. It organizes complex healthcare data into clear visual reports, making it easier for administrators to analyze KPIs.
Furthermore, the dashboard helps hospitals monitor performance trends, compare targets with actual results, and improve operational efficiency. As a result, hospitals can enhance patient care quality while also optimizing resource management.
Therefore, healthcare organizations that adopt KPI dashboards gain a strong advantage in performance monitoring and decision-making.
Frequently Asked Questions (FAQs)
What is a KPI dashboard in healthcare?
A KPI dashboard in healthcare is a visual reporting tool that displays key performance indicators related to hospital operations, patient care, and medical outcomes.
Why do maternity hospitals need KPI dashboards?
Maternity hospitals need KPI dashboards to monitor patient outcomes, track operational performance, and improve healthcare quality.
What are common maternity hospital KPIs?
Common KPIs include:
- Delivery success rate
- Cesarean section rate
- Maternal mortality rate
- Neonatal mortality rate
- Patient satisfaction score
Can Power BI connect with Excel data?
Yes. Power BI easily connects with Excel files and transforms data into interactive dashboards.
Is the Maternity Hospitals KPI Dashboard customizable?
Yes. Hospitals can modify KPIs, charts, and reports according to their operational needs.
Is Power BI suitable for healthcare analytics?
Watch the step-by-step video tutorial:
Yes. Power BI provides powerful data visualization and analytics tools, making it suitable for healthcare performance monitoring.
Click to buy Maternity Hospitals KPI Dashboard in Power BI
Visit our YouTube channel to learn step-by-step video tutorials