Media and entertainment businesses move fast. Every day, studios, OTT platforms, broadcasters, and digital creators track revenue, costs, ratings, views, and audience engagement. However, when data stays scattered across multiple Excel files, reports, and emails, decision-making slows down. As a result, teams miss trends, waste budgets, and lose growth opportunities.
That is exactly why a Media and Entertainment Dashboard in Excel becomes a game-changer.
In this detailed, SEO-friendly, and easy-to-understand article, you will learn what a Media and Entertainment Dashboard in Excel is, why it matters, how it works, and how each dashboard sheet supports smarter decisions. Moreover, you will explore advantages, best practices, and frequently asked questions, so you can confidently implement this dashboard in real-world media operations.
Click to buy Media and Entertainment Dashboard in Excel
What Is a Media and Entertainment Dashboard in Excel?
A Media and Entertainment Dashboard in Excel is a ready-to-use analytical tool designed to track, analyze, and visualize key performance indicators across content production, marketing, distribution, and audience engagement.
Instead of relying on static reports, this dashboard consolidates all critical metrics into one interactive Excel file. Consequently, decision-makers gain instant visibility into revenue, costs, profits, ratings, views, platforms, regions, and monthly trends.
Because Excel remains widely used, this dashboard offers flexibility, familiarity, and powerful analysis without complex software.
Why Do Media and Entertainment Businesses Need a Dashboard?
Media and entertainment operations involve multiple moving parts. Therefore, tracking performance manually creates confusion and delays.
Key challenges without a dashboard
- Data spreads across multiple sheets and systems
- Revenue and cost visibility remains unclear
- Platform and region performance stays hidden
- Monthly trends take time to analyze
- Leadership decisions rely on outdated data
However, a centralized Excel dashboard solves these problems by presenting everything visually and logically.
How Does a Media and Entertainment Dashboard in Excel Work?
This dashboard works by connecting structured data tables to pivot tables, charts, and KPIs. Then, Excel transforms raw numbers into interactive insights.
Because the dashboard uses multiple sheet tabs, users can quickly switch between overview and deep-dive analysis. As a result, teams analyze performance from multiple angles without rebuilding reports.
What Sheets Are Included in the Media and Entertainment Dashboard in Excel?
This ready-to-use dashboard includes five powerful analytical sheet tabs, each designed for a specific business purpose.
Overview Sheet Tab: How Do You Get a Complete Performance Snapshot?
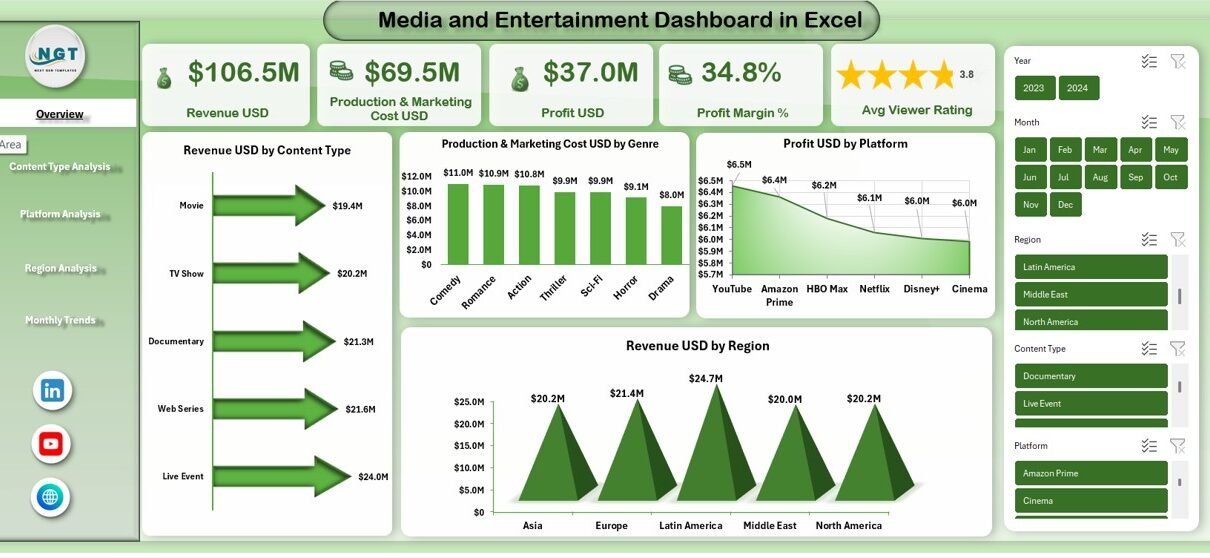
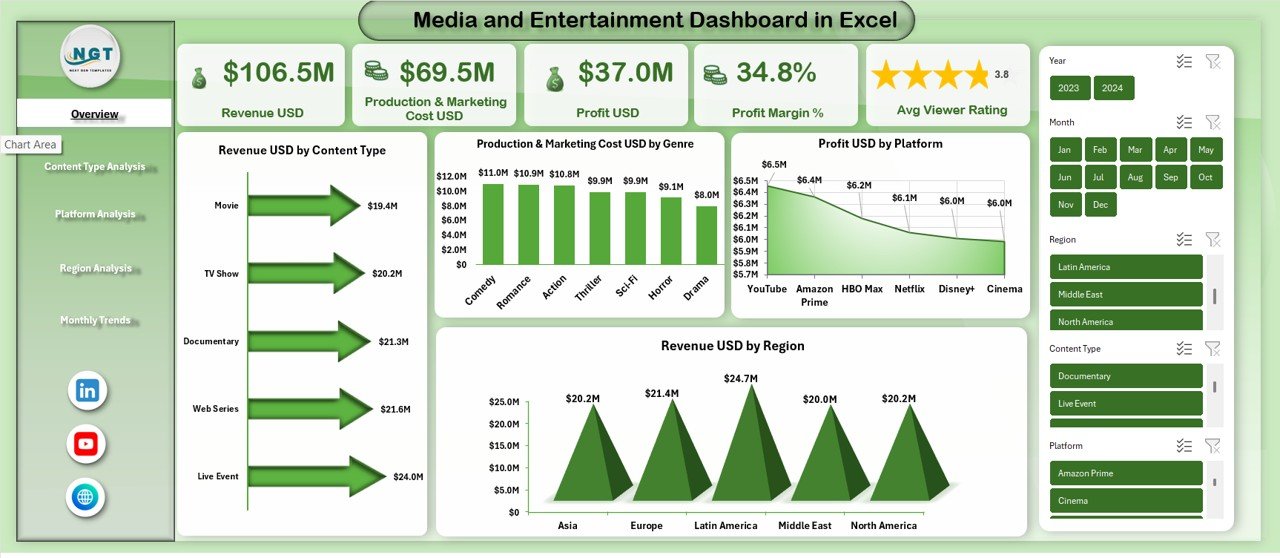
The Overview Sheet acts as the command center of the dashboard. First, it presents high-level KPIs. Then, it summarizes performance across content, platforms, and regions.
Key KPIs on the Overview Sheet
- Revenue USD
- Production & Marketing Cost USD
- Profit USD
- Profit Margin %
- Average Viewer Rating
Because these KPIs appear at the top, decision-makers instantly understand overall business health.
Key Charts on the Overview Sheet
- Revenue USD by Content Type
- Production & Marketing Cost USD by Genre
- Profit USD by Platform
- Revenue USD by Region
As a result, users quickly identify which content types earn more, which genres cost more, and which platforms deliver higher profits.
Click to buy Media and Entertainment Dashboard in Excel
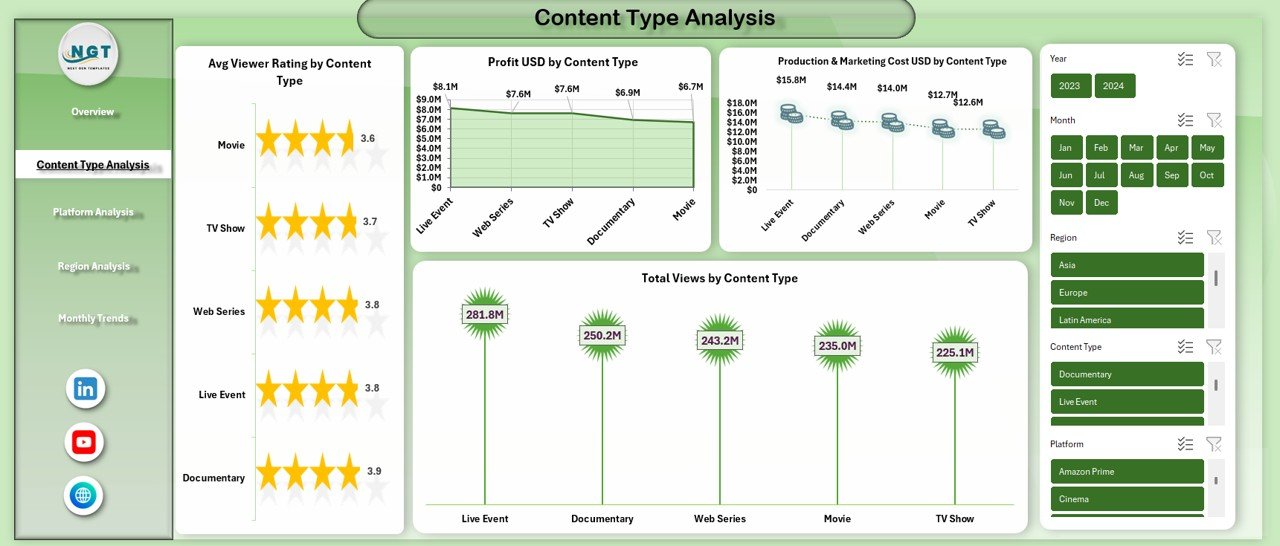
Content Type Analysis: Which Content Performs Best?
Content drives the media business. Therefore, understanding performance by content type becomes essential.
Metrics analyzed in Content Type Analysis
- Average Viewer Rating by Content Type
- Profit USD by Content Type
- Production & Marketing Cost USD by Content Type
- Total Views by Content Type
Because this sheet breaks down performance clearly, teams can:
- Invest more in high-performing content
- Improve underperforming formats
- Balance quality, cost, and reach
Moreover, this analysis supports smarter greenlighting and content renewal decisions.
Click to buy Media and Entertainment Dashboard in Excel
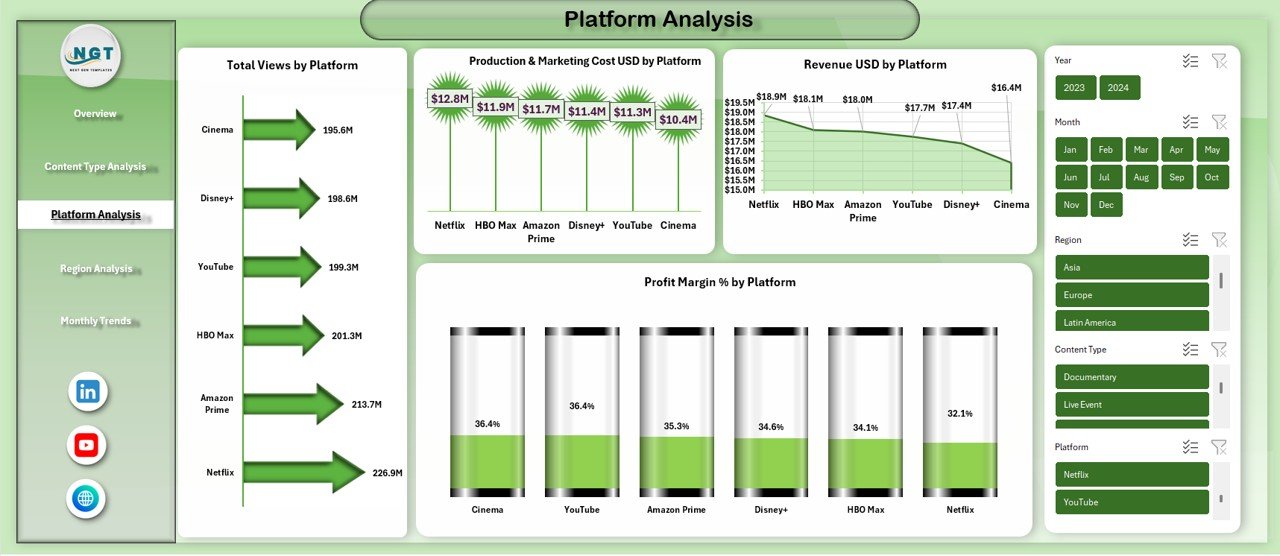
Platform Analysis: Which Platforms Deliver Maximum Value?
Media companies distribute content across multiple platforms. However, not every platform delivers equal returns.
Key metrics on the Platform Analysis sheet
- Total Views by Platform
- Production & Marketing Cost USD by Platform
- Revenue USD by Platform
- Profit Margin % by Platform
Because this sheet highlights profitability and reach together, teams can:
- Optimize platform investments
- Renegotiate platform deals
- Focus on high-margin platforms
As a result, platform strategy becomes data-driven instead of assumption-based.
Click to buy Media and Entertainment Dashboard in Excel
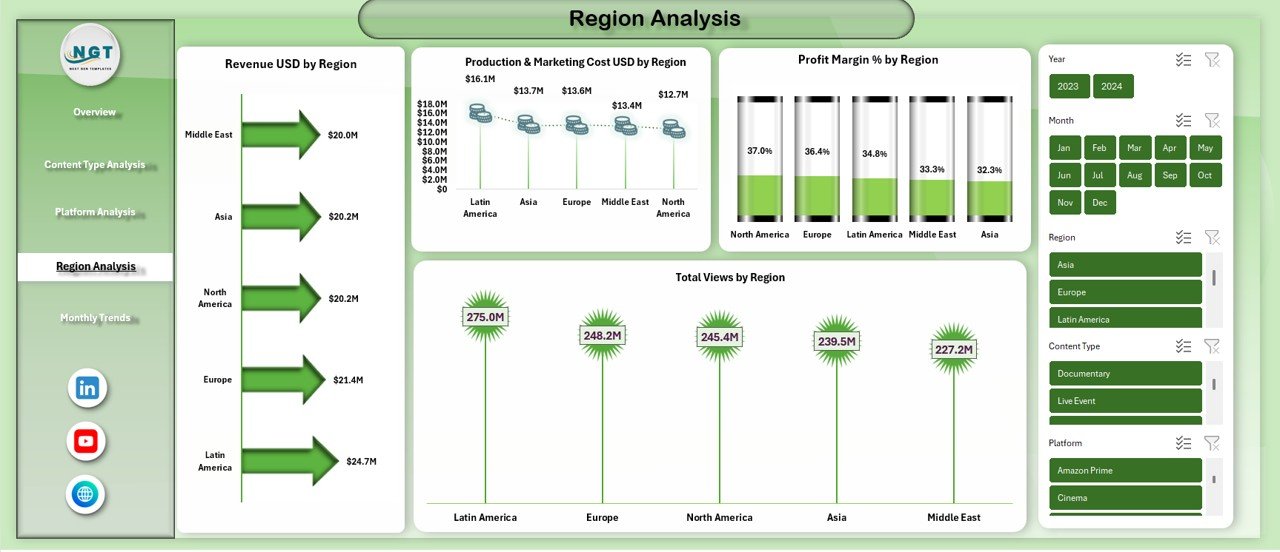
Region Analysis: Where Does Your Content Perform Best?
Audience preferences vary by region. Therefore, regional insights matter.
Metrics on the Region Analysis sheet
- Revenue USD by Region
- Production & Marketing Cost USD by Region
- Profit Margin % by Region
- Total Views by Region
Because this analysis shows regional strengths and weaknesses, businesses can:
- Customize content strategies by geography
- Adjust marketing budgets region-wise
- Identify emerging markets
Moreover, leadership gains clarity on global expansion opportunities.
Click to buy Media and Entertainment Dashboard in Excel
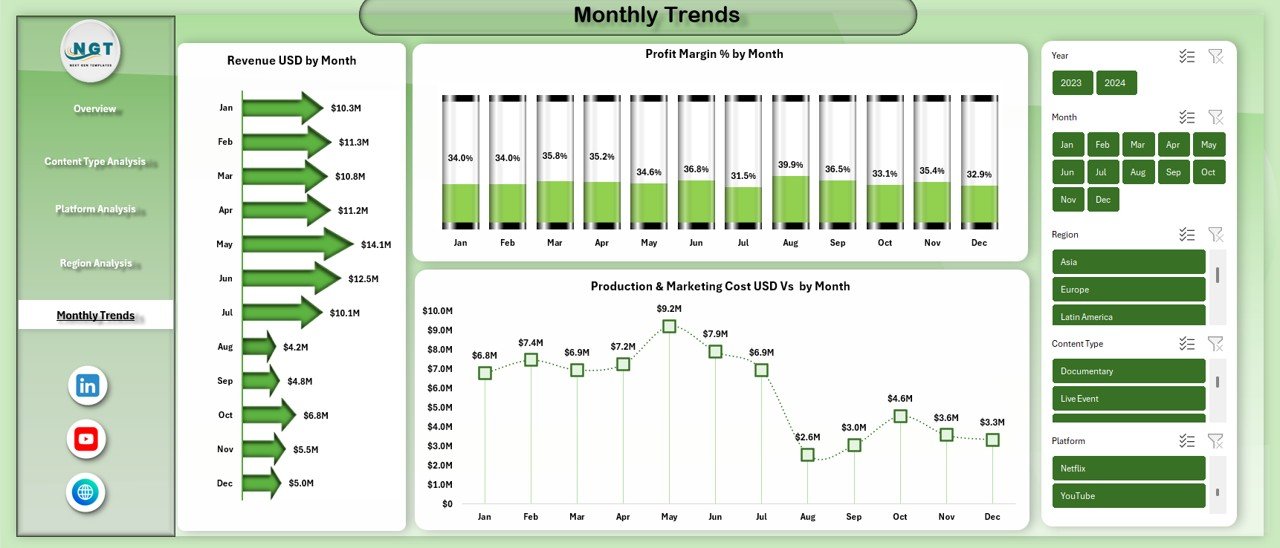
Monthly Trends: How Is Performance Changing Over Time?
Trends reveal growth, decline, and seasonality. Therefore, the Monthly Trends Sheet plays a critical role.
Monthly trend metrics included
- Revenue USD by Month
- Profit Margin % by Month
- Production & Marketing Cost USD by Month
Because trends appear visually, users can quickly spot:
- Revenue growth patterns
- Cost spikes
- Profitability changes
As a result, forecasting and planning become more accurate.
Click to buy Media and Entertainment Dashboard in Excel
What Types of Analysis Can You Perform with This Dashboard?
This dashboard supports multiple analytical perspectives, including:
- Revenue analysis
- Cost control analysis
- Profitability tracking
- Platform comparison
- Content performance evaluation
- Regional market assessment
- Monthly trend analysis
Because Excel allows filters and slicers, users can drill down instantly.
Advantages of Media and Entertainment Dashboard in Excel
Why Should You Use This Dashboard?
Using a Media and Entertainment Dashboard in Excel offers several practical advantages.
Key advantages
- Centralized performance tracking
- Faster decision-making
- Better revenue and cost visibility
- Improved content strategy
- Clear regional insights
- Strong trend analysis
- Easy-to-understand visuals
Because everything stays in Excel, teams avoid steep learning curves.
How Does This Dashboard Improve Decision-Making?
This dashboard converts raw data into actionable insights. Therefore, leaders no longer guess performance.
- Content teams decide what to produce next
- Finance teams control budgets better
- Marketing teams optimize campaigns
- Executives review performance instantly
As a result, decisions become faster, smarter, and more confident.
Who Can Use a Media and Entertainment Dashboard in Excel?
This dashboard suits a wide range of professionals, including:
- Media production houses
- OTT and streaming platforms
- Television networks
- Digital content creators
- Marketing teams
- Finance and revenue teams
- Media consultants
Because the dashboard stays flexible, both small studios and large enterprises can use it.
How Does This Dashboard Support Revenue Growth?
Revenue growth depends on clarity. Therefore, this dashboard helps by:
- Highlighting top-performing content
- Identifying profitable platforms
- Revealing high-revenue regions
- Tracking monthly revenue growth
As a result, businesses scale what works and fix what does not.
Best Practices for the Media and Entertainment Dashboard in Excel
How Can You Get the Best Results from This Dashboard?
Following best practices ensures long-term success.
Data management best practices
- Keep data clean and structured
- Use consistent content and platform names
- Update data regularly
Dashboard usage best practices
- Review KPIs weekly or monthly
- Compare trends, not just totals
- Use filters to explore deeper insights
Decision-making best practices
- Act quickly on negative trends
- Reallocate budgets based on performance
- Align content strategy with data
Because discipline matters, these practices maximize dashboard value.
How Can You Customize This Dashboard?
Excel allows endless customization. Therefore, users can:
- Add new KPIs
- Create additional charts
- Insert slicers for time, platform, or region
- Adjust color themes to brand guidelines
As a result, the dashboard evolves with business needs.
Conclusion: Why Is a Media and Entertainment Dashboard in Excel Essential?
The media and entertainment industry thrives on insights, speed, and creativity. However, without structured analytics, even the best content strategies fail.
A Media and Entertainment Dashboard in Excel provides a centralized, visual, and decision-ready system to track revenue, costs, profits, ratings, platforms, regions, and trends. Because it combines flexibility with simplicity, teams gain clarity without complexity.
If you want to improve performance, control costs, and grow revenue, this dashboard becomes an essential business tool.
Frequently Asked Questions (FAQs)
What is a Media and Entertainment Dashboard in Excel used for?
A Media and Entertainment Dashboard in Excel tracks revenue, costs, profits, ratings, views, platforms, regions, and monthly trends in one interactive file.
Who should use a Media and Entertainment Dashboard in Excel?
Media companies, OTT platforms, production houses, digital creators, finance teams, and marketing teams can all use this dashboard.
Can beginners use this Excel dashboard?
Yes. Because the dashboard uses simple visuals and clear KPIs, even beginners can use it easily.
Does this dashboard support monthly trend analysis?
Yes. The Monthly Trends sheet tracks revenue, profit margin, and production costs by month.
Can I customize the dashboard for my business?
Absolutely. You can add KPIs, charts, filters, and branding elements based on your needs.
How often should I update the dashboard data?
You should update the data monthly or weekly, depending on reporting frequency.
Does this dashboard help improve profitability?
Yes. By highlighting cost drivers and high-margin content, the dashboard supports smarter profitability decisions.
Is Excel suitable for media analytics?
Yes. Excel remains powerful, flexible, and widely used for media and entertainment analytics.
Visit our YouTube channel to learn step-by-step video tutorials
Watch the step-by-step video tutorial:
Click to buy Media and Entertainment Dashboard in Excel