Metro rail projects play a crucial role in modern urban transportation. As cities expand rapidly, governments and transport authorities invest heavily in metro rail infrastructure. However, managing metro rail projects involves massive data related to budgets, contractors, phases, funding sources, timelines, and zones. Therefore, teams need a powerful yet simple analytical tool to track progress accurately.
That is exactly where a Metro Rail Projects Dashboard in Excel becomes extremely valuable.
A Metro Rail Projects Dashboard in Excel is a ready-to-use, interactive management tool that helps project teams, planners, engineers, and decision-makers monitor project performance visually. Instead of reviewing multiple spreadsheets and reports, users can access all key insights in one central dashboard. As a result, planning improves, delays reduce, and decisions become data-driven.
In this detailed guide, you will learn what a Metro Rail Projects Dashboard in Excel is, how it works, what pages it includes, its advantages, best practices, and frequently asked questions.
Click to Purchases Metro Rail Projects Dashboard in Excel
What Is a Metro Rail Projects Dashboard in Excel?
A Metro Rail Projects Dashboard in Excel is a structured analytical dashboard designed to monitor metro construction projects using charts, KPI cards, slicers, and tables. It converts raw project data into visual insights that help teams track cost, progress, funding, and execution status easily.
Moreover, because the dashboard runs entirely in Excel, it remains flexible, cost-effective, and user-friendly. Even non-technical users can analyze complex project data without writing any code.
Instead of static reports, this dashboard delivers real-time insights using filters, slicers, and dynamic charts. Consequently, project stakeholders gain instant clarity on project health.
Why Do Metro Rail Projects Need a Dashboard in Excel?
Metro rail projects involve thousands of activities and stakeholders. Therefore, manual tracking quickly becomes inefficient and error-prone. However, with a dashboard, teams gain clarity and control.
Here are a few key reasons why this dashboard is essential:
-
It centralizes project data in one place
-
It improves visibility across zones, phases, and funding sources
-
It highlights cost overruns early
-
It supports data-driven decision-making
-
It saves time by automating reporting
As a result, metro authorities can complete projects faster and within budget.
Key Features of the Metro Rail Projects Dashboard in Excel
This Metro Rail Projects Dashboard in Excel is ready to use and professionally structured. It includes a page navigator, multiple analytical pages, KPI cards, and slicers to filter information effectively.
Page Navigator for Easy Navigation
The Page Navigator, located on the left side, allows users to move quickly between different dashboard pages. Therefore, users do not waste time scrolling or searching for sheets.
How Many Pages Does This Dashboard Include?
The dashboard includes 5 analytical pages inside the Excel desktop application file. Each page focuses on a specific aspect of metro rail project monitoring.
What Does the Overview Page Show?
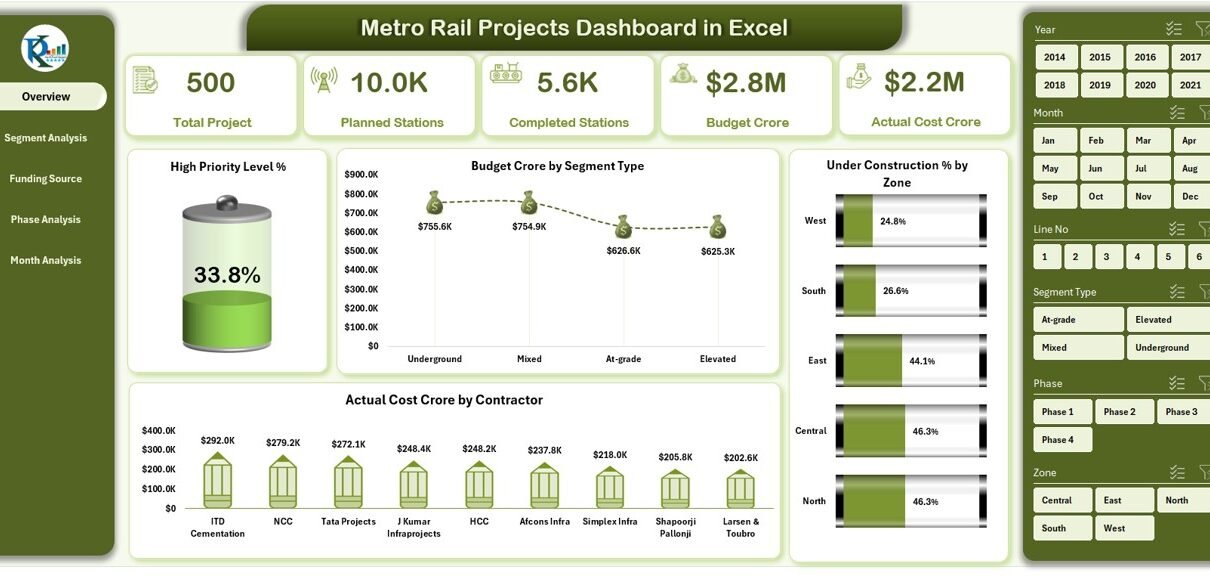
Overview Page – Project Summary at a Glance
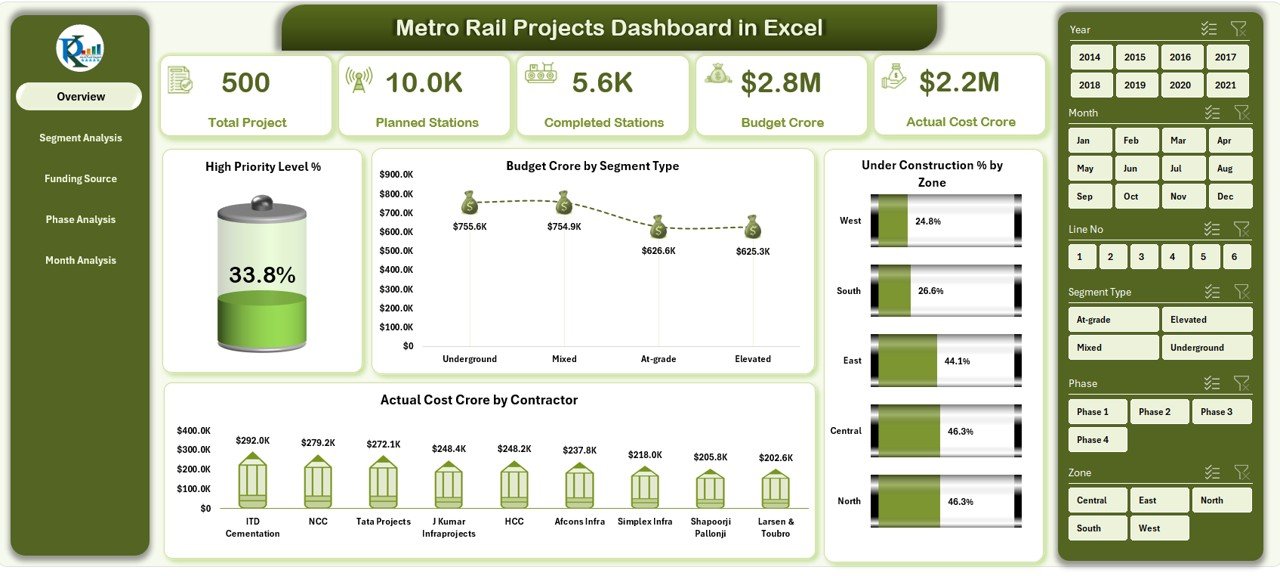
The Overview Page acts as the main summary page of the dashboard. It gives top-level insights into project performance.
Key Elements of the Overview Page:
-
Right-side slicer for filtering data
-
5 KPI cards, such as:
-
High Priority Level %
-
Budget Crore
-
Actual Cost Crore
-
Under Construction %
-
Completed Status Indicators
-
Key Charts on the Overview Page:
-
High Priority Level %
-
Budget Crore by Segment Type
-
Under Construction % by Zone
-
Actual Cost Crore by Contractor
As a result, decision-makers get a quick snapshot of overall project health.
Click to Purchases Metro Rail Projects Dashboard in Excel
What Insights Does the Segment Analysis Page Provide?
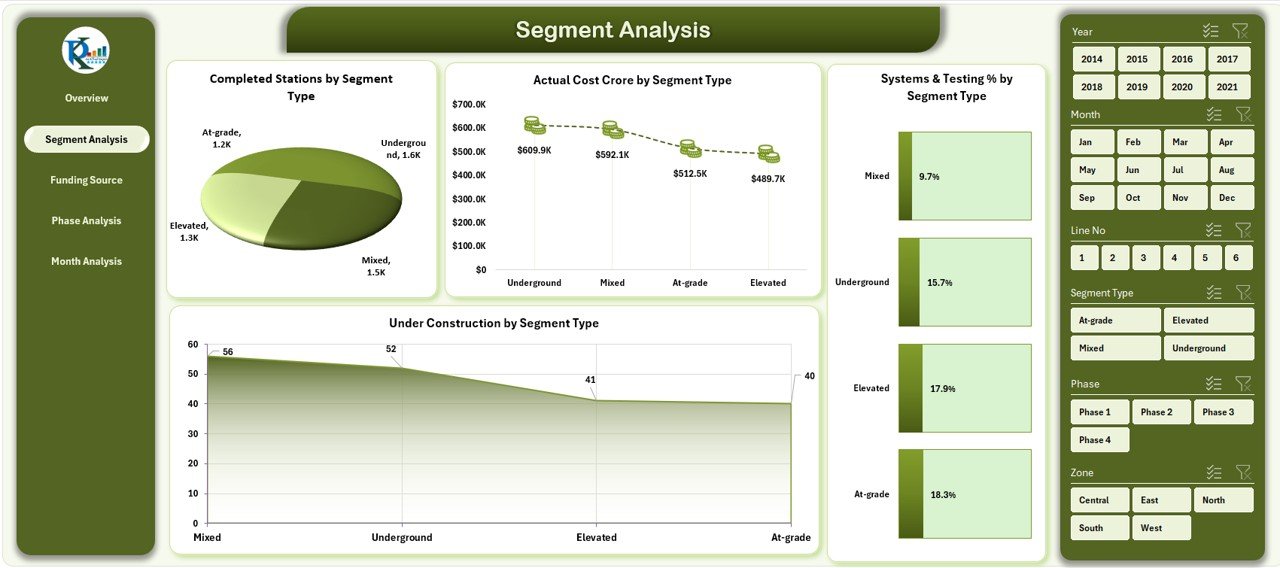
Segment Analysis Page – Tracking Project Segments
Metro rail projects divide into multiple segments. Therefore, segment-wise analysis becomes essential.
Features of the Segment Analysis Page:
-
Right-side slicer for filtering
-
Clear segment-level charts
Key Charts Included:
-
Completed Stations by Segment Type
-
Actual Cost Crore by Segment Type
-
System & Testing by Segment Type
-
Under Construction % by Segment Type
Because of this layout, users can compare progress across different segment types easily.
Why Is Funding Source Analysis Important?
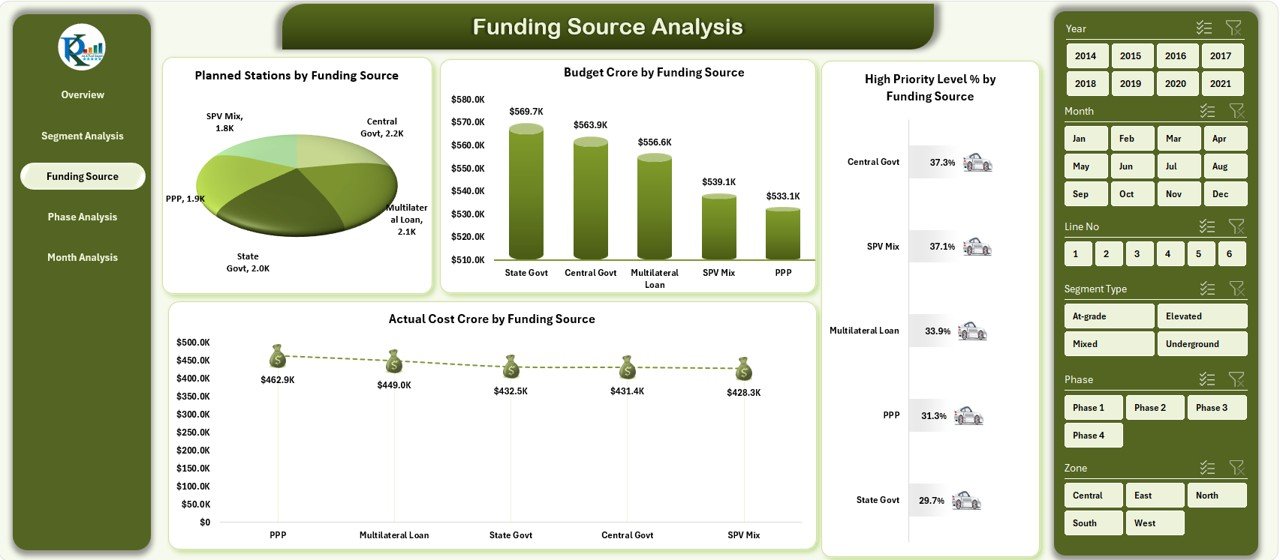
Funding Source Analysis Page – Monitoring Financial Sources
Every metro rail project uses multiple funding sources such as government grants, loans, or public-private partnerships. Therefore, tracking funding sources ensures financial transparency.
Key Elements on This Page:
-
Right-side slicer for dynamic filtering
Key Charts Included:
-
Planned Stations by Funding Source
-
Budget Crore by Funding Source
-
High Priority Level % by Funding Source
-
Actual Cost Crore by Funding Source
As a result, finance teams can track cost flow and funding efficiency accurately.
How Does the Phase Analysis Page Help?
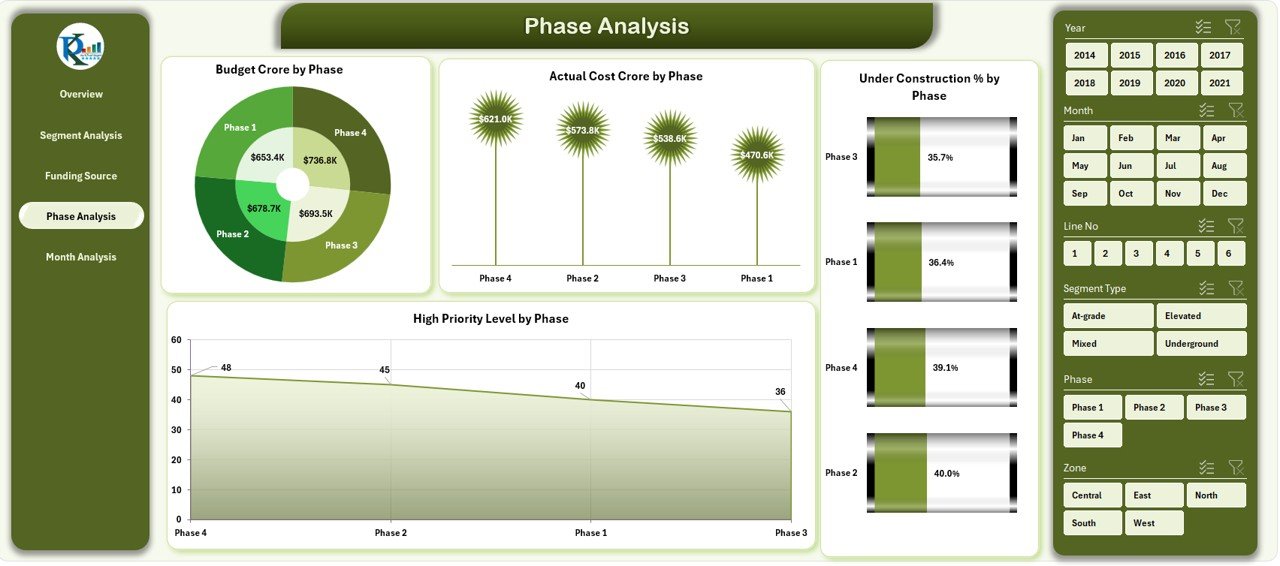
Phase Analysis Page – Project Lifecycle Control
Metro rail projects run through multiple phases such as planning, construction, testing, and commissioning. Hence, phase-wise tracking helps avoid delays.
Key Charts Included:
-
Budget Crore by Phase
-
Actual Cost by Phase
-
Under Construction % by Phase
-
High Priority Level by Phase
This page makes it easier to identify problem phases early.
Click to Purchases Metro Rail Projects Dashboard in Excel
Why Use Month-Wise Analysis for Metro Projects?
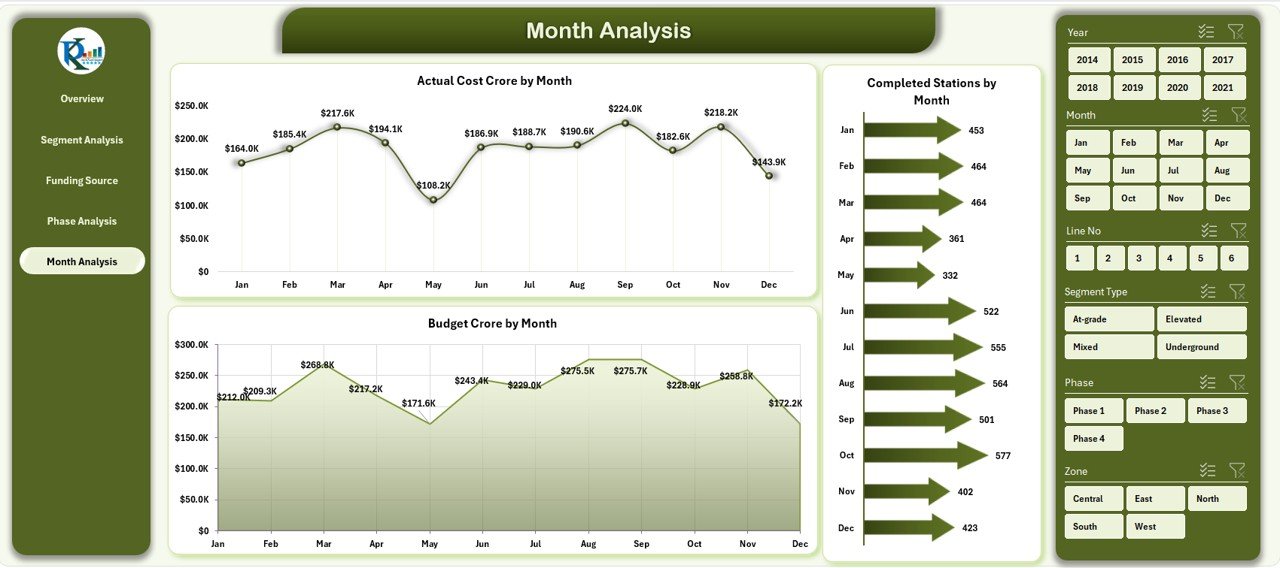
Month Analysis Page – Time-Based Performance Monitoring
Time plays a critical role in metro rail projects. Therefore, monthly trend analysis becomes essential.
Key Charts on the Month Analysis Page:
-
Actual Cost Crore by Month
-
Completed Stations by Month
-
Budget Crore by Month
Using this page, teams can track trends, forecast costs, and monitor deadlines.
What Is the Role of the Data Sheet?
Data Sheet – Backbone of the Dashboard
The Data Sheet acts as the foundation of the dashboard. All calculations, charts, and KPIs connect directly to this sheet.
Why the Data Sheet Matters:
-
Stores raw project data
-
Enables automation
-
Supports scalability
-
Ensures data consistency
By updating this sheet, the entire dashboard refreshes automatically.
Advantages of Metro Rail Projects Dashboard in Excel
A Metro Rail Projects Dashboard in Excel offers several practical advantages. Below are the key benefits explained clearly.
✅ Improved Project Visibility
-
Visual dashboards replace confusing tables
-
Managers understand project status instantly
✅ Better Cost Control
-
Track budget vs actual cost easily
-
Identify overruns early
✅ Faster Decision-Making
-
Real-time KPIs support quick actions
-
No need to wait for manual reports
✅ Easy to Use
-
Built entirely in Excel
-
No coding or third-party tools required
✅ Highly Customizable
-
Modify charts, KPIs, and visuals as needed
-
Adapt dashboard to new project phases
Who Should Use a Metro Rail Projects Dashboard in Excel?
This dashboard suits many stakeholders, including:
-
Metro rail authorities
-
Government infrastructure departments
-
Project managers and planners
-
Engineering firms
-
Contractors and consultants
-
Financial auditors
Because of its flexibility, it fits both small and large metro rail projects.
How Does This Dashboard Improve Project Governance?
Strong governance requires transparency and accountability. Therefore, dashboards play a key role.
The Metro Rail Projects Dashboard in Excel:
-
Improves reporting accuracy
-
Reduces data duplication
-
Enhances stakeholder confidence
-
Supports compliance monitoring
As a result, organizations maintain tighter project control.
Best Practices for the Metro Rail Projects Dashboard in Excel
To get maximum value from the dashboard, follow these best practices carefully.
✅ Keep the Data Sheet Clean
-
Avoid blank cells
-
Maintain consistent date formats
-
Validate data regularly
✅ Update Data Periodically
-
Refresh data monthly or weekly
-
Keep project status current
✅ Use Slicers Effectively
-
Filter by zone, phase, or funding
-
Focus on specific insights
✅ Review KPIs Regularly
-
Track High Priority Level %
-
Monitor Under Construction %
✅ Standardize Reporting
-
Use the dashboard in review meetings
-
Align all stakeholders on one data source
How Can This Dashboard Support Strategic Planning?
Strategic planning requires accurate historical and current data. Because this dashboard shows trends clearly, it supports:
-
Resource allocation planning
-
Funding requirement forecasting
-
Risk assessment
-
Timeline optimization
Therefore, leadership teams can plan future metro expansions confidently.
Can This Dashboard Be Scaled for Large Metro Networks?
Yes, the dashboard easily scales with larger datasets. Because Excel handles structured data efficiently, users can add:
-
More zones
-
Additional funding sources
-
New contractors
-
Extra phases
Thus, the dashboard grows with the project.
Conclusion: Why Choose a Metro Rail Projects Dashboard in Excel?
A Metro Rail Projects Dashboard in Excel transforms complex project data into clear, actionable insights. It improves visibility, strengthens cost control, and supports faster decision-making. Moreover, because it uses Excel, it remains affordable, flexible, and easy to adopt.
By using this dashboard, organizations reduce risk, improve accountability, and deliver metro projects more efficiently. Therefore, for any city or authority managing metro rail infrastructure, this dashboard becomes a powerful project management asset.
Frequently Asked Questions (FAQs)
What is a Metro Rail Projects Dashboard in Excel?
A Metro Rail Projects Dashboard in Excel is a visual project monitoring tool that tracks cost, progress, phases, segments, and funding sources using charts and KPIs.
Do I need advanced Excel skills to use this dashboard?
No. Basic Excel knowledge is enough. The dashboard uses slicers, charts, and tables that are easy to operate.
Can I customize the dashboard as per my project needs?
Yes. You can modify KPIs, charts, colors, and layouts to match your project requirements.
How often should I update the data?
You should update the data monthly or weekly, depending on project reporting frequency.
Can this dashboard handle multiple metro projects?
Yes. With proper data structuring, you can track multiple projects using the same dashboard.
Does the dashboard support decision-making?
Absolutely. It provides real-time insights that help management identify issues early and take corrective action.
Visit our YouTube channel to learn step-by-step video tutorials