Running a microbrewery feels exciting. However, excitement alone does not build profit. You must track production, sales, quality, wastage, and margins every single month. Otherwise, small leaks in cost or yield will silently reduce your profit.
Therefore, you need clarity.
And you need it in one place.
That is exactly why the Microbreweries KPI Dashboard in Excel becomes powerful. It gives you structured control over your brewing business. Moreover, it transforms scattered numbers into actionable insights.
In this detailed guide, you will learn:
-
What a Microbreweries KPI Dashboard in Excel is
-
Why every craft brewery needs KPI tracking
-
Detailed explanation of all 7 worksheets
-
Key KPIs every microbrewery must monitor
-
Advantages of the Microbreweries KPI Dashboard
-
Best Practices for the Microbreweries KPI Dashboard
-
Frequently Asked Questions with Answers
Let us explore everything step by step.
Click to Purchases Microbreweries KPI Dashboard in Excel
What Is a Microbreweries KPI Dashboard in Excel?
A Microbreweries KPI Dashboard in Excel is a structured performance tracking system built inside Microsoft Excel. It helps brewery owners and managers monitor key performance indicators (KPIs) in one centralized file.
Instead of checking different spreadsheets, notebooks, or accounting tools, you can:
-
Track production volume
-
Monitor brewing yield
-
Compare Actual vs Target
-
Review Previous Year performance
-
Analyze Month-to-Date (MTD) and Year-to-Date (YTD) numbers
-
Identify underperforming KPIs instantly
As a result, you make faster and smarter decisions.
Why Do Microbreweries Need a KPI Dashboard?
Many small breweries focus mainly on taste and branding. However, profitability depends on numbers.
Without KPI tracking:
-
You cannot identify production loss.
-
You cannot measure fermentation efficiency.
-
You cannot control ingredient cost.
-
You cannot compare monthly sales growth.
-
You cannot detect margin decline early.
On the other hand, when you use a KPI Dashboard:
-
You track every brewing cycle clearly.
-
You measure performance month by month.
-
You detect problems early.
-
You protect your profit margin.
Therefore, a KPI dashboard becomes your brewing control center.
Click to Purchases Microbreweries KPI Dashboard in Excel
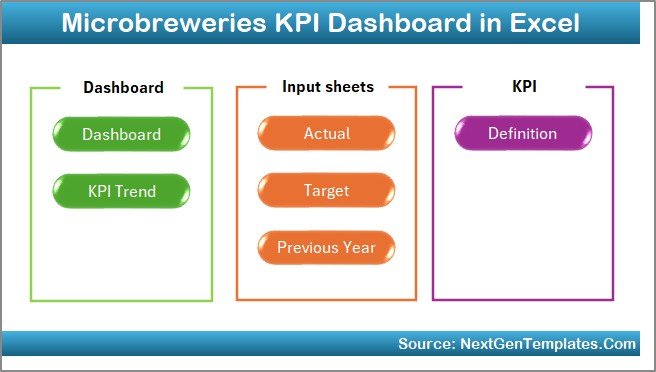
What Are the 7 Worksheets in the Microbreweries KPI Dashboard?
This ready-to-use Microbreweries KPI Dashboard in Excel includes 7 structured worksheets. Each sheet plays an important role.
Let us understand each sheet in detail.
1️⃣ Home Sheet – Your Navigation Center
The Home sheet works as an index page.
Here, you will find 6 navigation buttons. These buttons help you jump directly to the respective worksheet.
Because of this:
-
You save time.
-
You avoid confusion.
-
You improve workflow efficiency.
Moreover, the structured layout gives your dashboard a professional look.
Click to Purchases Microbreweries KPI Dashboard in Excel
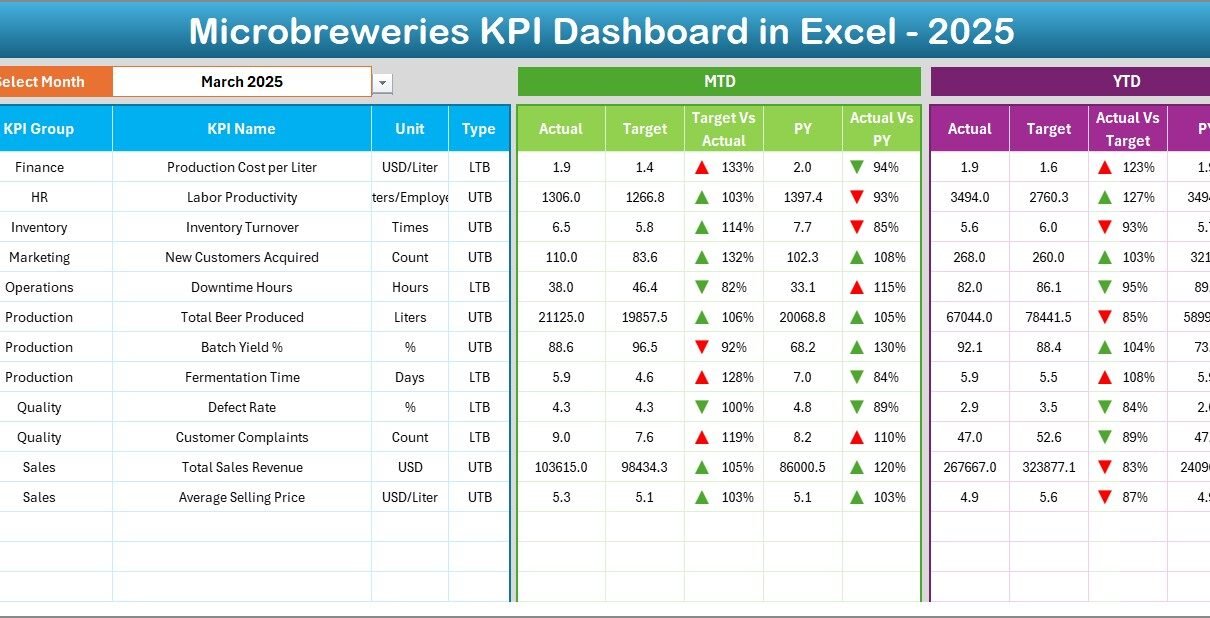
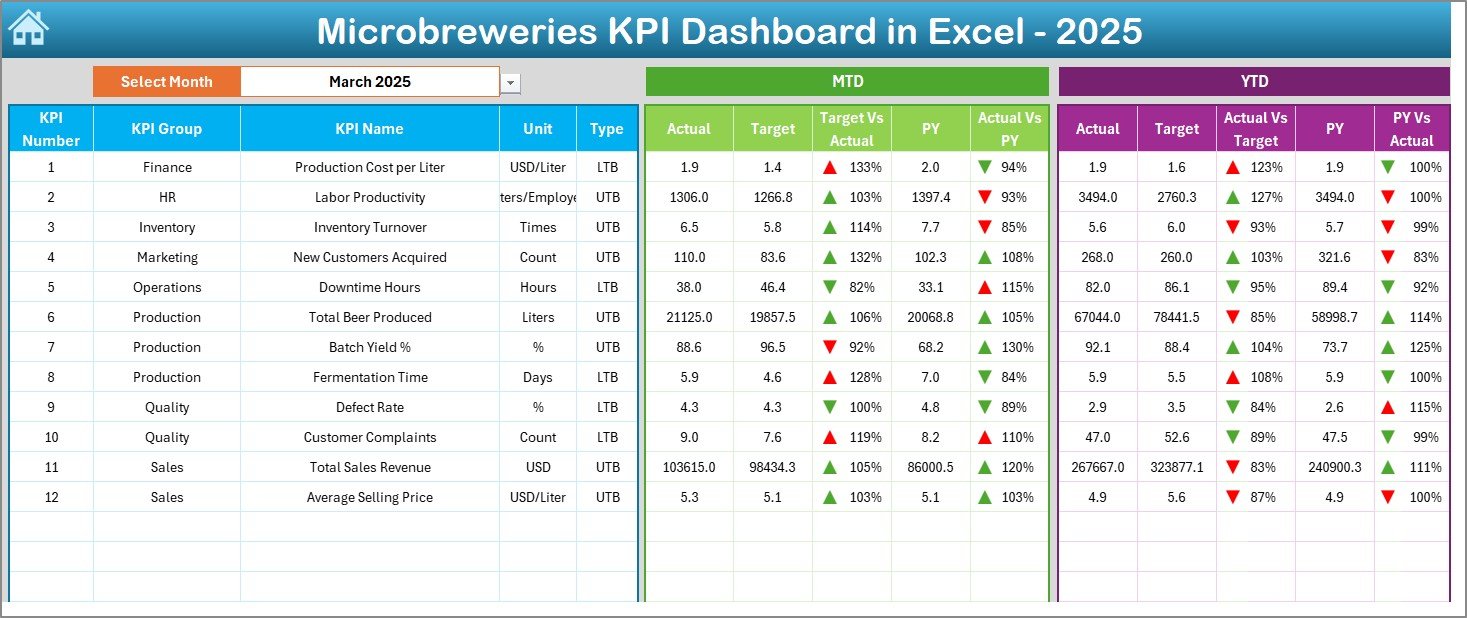
2️⃣ Dashboard Sheet – The Main Performance Overview
This sheet acts as the heart of the entire dashboard.
🔹 Month Selection Feature
On range D3, you can select the month from a drop-down list.
Once you select the month:
-
All numbers change automatically.
-
All charts update instantly.
-
All performance comparisons refresh.
Therefore, you can analyze any month within seconds.
🔹 MTD and YTD Performance Tracking
On this sheet, you can view:
-
MTD Actual
-
MTD Target
-
MTD Previous Year
-
YTD Actual
-
YTD Target
-
YTD Previous Year
Additionally, you can see:
-
Target vs Actual %
-
Previous Year vs Actual %
The dashboard uses conditional formatting with:
-
Up arrows (positive performance)
-
Down arrows (negative performance)
-
Color coding for quick visual interpretation
As a result, you immediately identify strong and weak areas.
Click to Purchases Microbreweries KPI Dashboard in Excel
3️⃣ KPI Trend Sheet – Detailed KPI Analysis
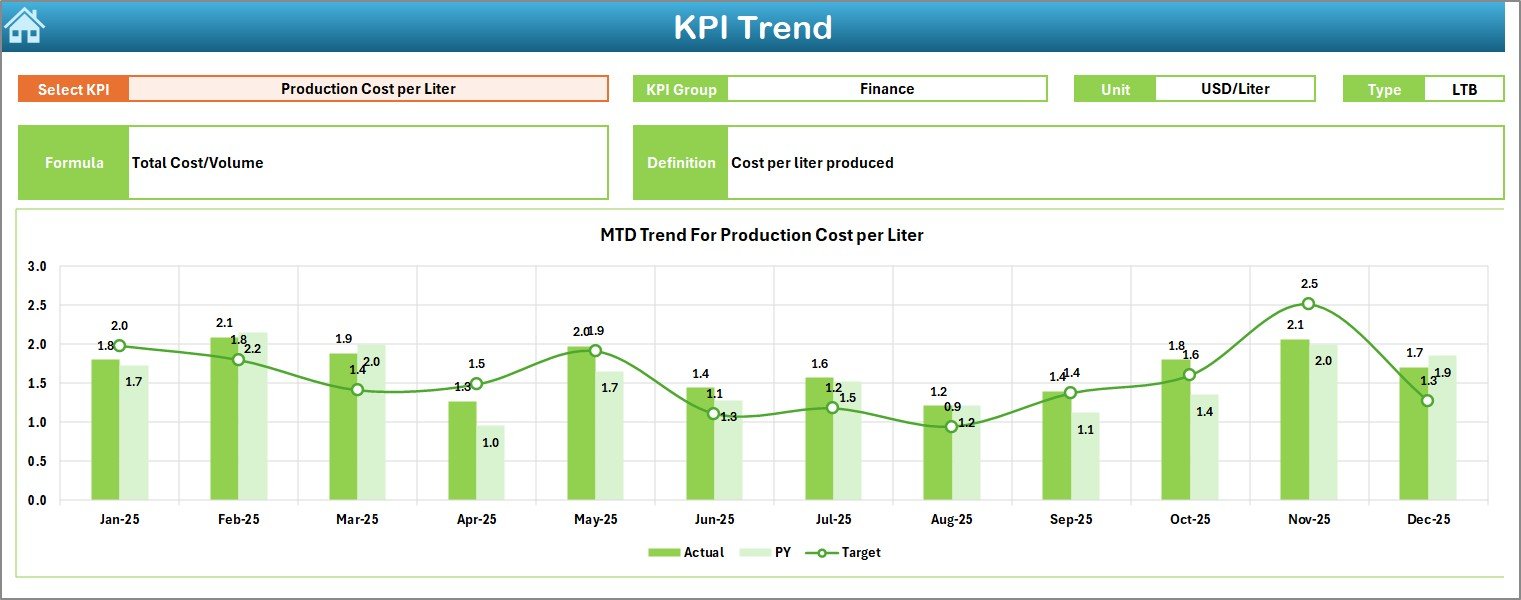
This sheet allows deeper analysis of individual KPIs.
🔹 KPI Selection
On range C3, you can select any KPI from the drop-down list.
After selection, the sheet displays:
-
KPI Group
-
Unit of KPI
-
Type of KPI (Lower the Better or Upper the Better)
-
Formula
-
Definition
Therefore, you always understand what the KPI represents.
🔹 Trend Charts
The sheet displays:
-
MTD Trend (Actual vs Target vs Previous Year)
-
YTD Trend (Actual vs Target vs Previous Year)
Because of these charts:
-
You analyze performance patterns.
-
You identify seasonal trends.
-
You detect consistent underperformance.
-
You evaluate growth trajectory.
Hence, you do not rely only on single-month numbers.
Click to Purchases Microbreweries KPI Dashboard in Excel
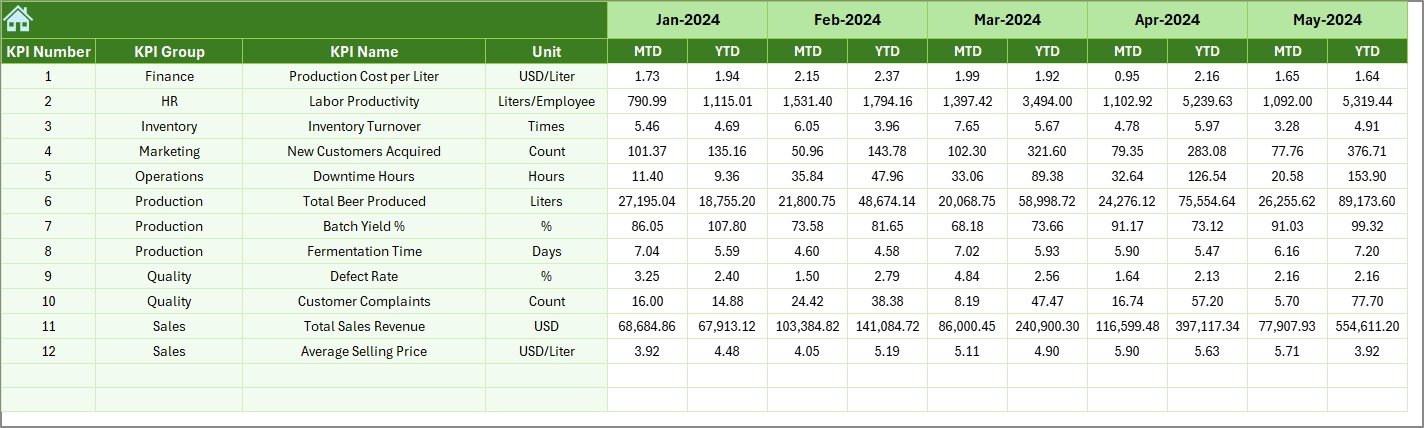
4️⃣ Actual Numbers Input Sheet
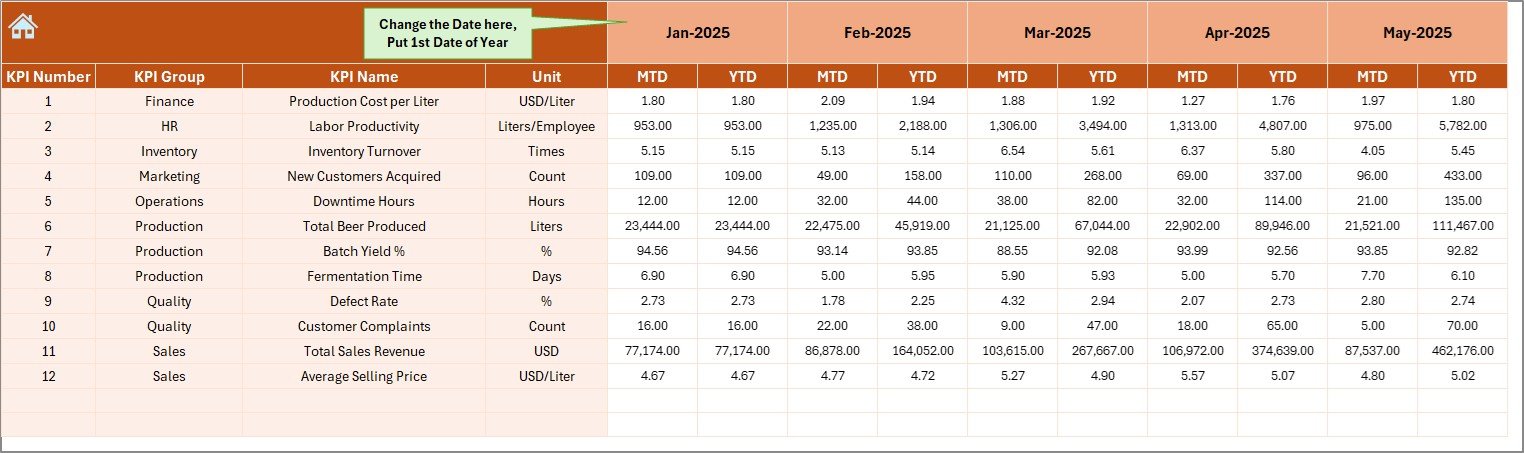
This sheet captures your current year actual data.
How It Works:
-
You set the first month of the year in range E1.
-
You enter MTD and YTD numbers.
-
The dashboard updates automatically.
Therefore, data entry becomes simple and structured.
5️⃣ Target Sheet
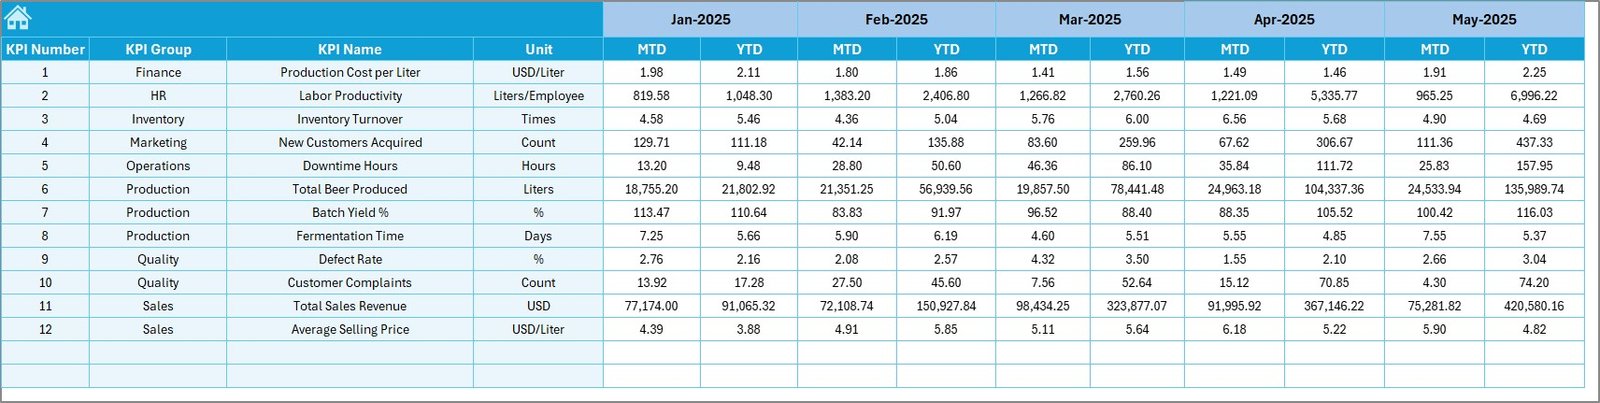
On this sheet, you enter:
-
Monthly MTD targets
-
Monthly YTD targets
Because targets drive performance, this sheet becomes essential.
When you define clear targets:
-
You motivate your team.
-
You measure achievement.
-
You create accountability.
6️⃣ Previous Year Numbers Sheet
Here, you enter last year’s data.
Why is this important?
Because growth matters more than absolute numbers.
When you compare current year vs previous year:
-
You measure business growth.
-
You evaluate marketing success.
-
You analyze production improvement.
7️⃣ KPI Definition Sheet
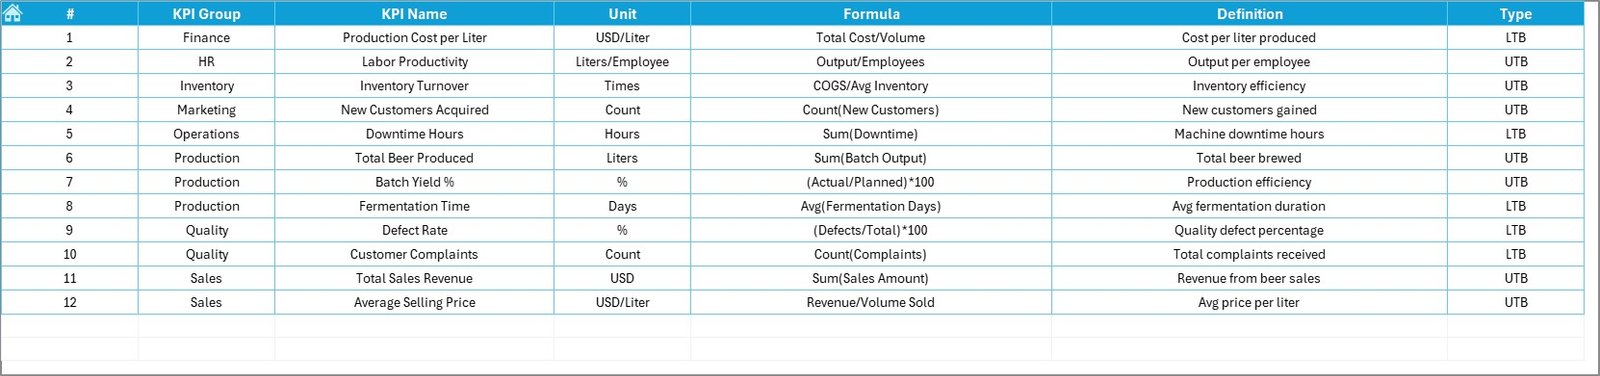
This sheet acts as the knowledge base of your dashboard.
You enter:
-
KPI Name
-
KPI Group
-
Unit
-
Formula
-
KPI Definition
Therefore, every KPI remains standardized.
Moreover, this sheet ensures clarity for:
-
Managers
-
Accountants
-
Production teams
What KPIs Should a Microbrewery Track?
To build a strong dashboard, you must track meaningful KPIs.
Here are some important microbrewery KPIs:
Production KPIs
-
Total Production Volume (Liters)
-
Fermentation Efficiency %
-
Brewing Yield %
-
Batch Success Rate
-
Downtime Hours
Financial KPIs
-
Revenue
-
Cost per Liter
-
Gross Profit Margin %
-
Ingredient Cost %
-
Utility Cost %
Sales KPIs
-
Taproom Sales
-
Distribution Sales
-
Sales per SKU
-
Average Order Value
Quality KPIs
-
Rejected Batch %
-
Alcohol Content Accuracy %
-
Customer Complaint Rate
-
Quality Score %
When you monitor these KPIs regularly, you control your brewery better.
Click to Purchases Microbreweries KPI Dashboard in Excel
Advantages of Microbreweries KPI Dashboard in Excel
Now let us explore the advantages clearly.
✅ 1. Centralized Data Control
You store all production, sales, and financial data in one file. Therefore, you eliminate scattered spreadsheets.
✅ 2. Real-Time Performance Visibility
Once you enter data, the dashboard updates automatically. As a result, you see performance instantly.
✅ 3. Easy Month Comparison
Because of the drop-down month selector, you compare any month within seconds.
✅ 4. Target Accountability
You compare Actual vs Target clearly. Therefore, your team focuses on goals.
✅ 5. Growth Tracking
With Previous Year comparison, you measure true business growth.
✅ 6. Visual Clarity
Conditional formatting, arrows, and trend charts improve understanding. Consequently, decision-making becomes faster.
✅ 7. No Complex Software Required
You use Excel. Therefore:
-
No expensive BI tool needed.
-
No technical coding required.
-
No complex installation required.
How Does the Dashboard Improve Brewery Profitability?
You may ask, “How exactly does this dashboard improve profit?”
Here is how:
-
You detect high ingredient cost early.
-
You reduce production loss.
-
You optimize batch planning.
-
You monitor high-margin products.
-
You identify slow-moving SKUs.
-
You track seasonal demand patterns.
Because of this, you protect margins and improve cash flow.
Click to Purchases Microbreweries KPI Dashboard in Excel
Best Practices for the Microbreweries KPI Dashboard
Now let us understand how to use this dashboard effectively.
🔹 1. Enter Data Monthly Without Delay
Always update actual numbers at month-end. Consistency ensures accuracy.
🔹 2. Define Realistic Targets
Do not set unrealistic targets. Instead, use historical data to define achievable goals.
🔹 3. Review KPIs Weekly
Although the dashboard works monthly, you should review trends weekly. Early action prevents bigger losses.
🔹 4. Keep KPI Definitions Clear
Always define each KPI properly in the KPI Definition sheet. Clarity prevents confusion.
🔹 5. Focus on Actionable KPIs
Avoid tracking unnecessary metrics. Instead, track KPIs that impact:
-
Profit
-
Quality
-
Production efficiency
-
Customer satisfaction
🔹 6. Train Your Team
Make sure your production and finance teams understand:
-
KPI meaning
-
Performance targets
-
Responsibility areas
Who Can Benefit from This Dashboard?
This dashboard benefits:
-
Microbrewery Owners
-
Brewmasters
-
Production Managers
-
Finance Managers
-
Sales Managers
-
Craft Brewery Consultants
If you run a growing brewery, this dashboard becomes essential.
Click to Purchases Microbreweries KPI Dashboard in Excel
Why Choose Excel for Brewery KPI Tracking?
Some businesses choose complex software. However, Excel provides:
-
Flexibility
-
Customization
-
Cost efficiency
-
Easy sharing
-
No technical dependency
Therefore, Excel remains a powerful business tool.
Conclusion: Brew Better with Data-Driven Decisions
Running a microbrewery requires passion. However, passion must align with numbers.
The Microbreweries KPI Dashboard in Excel gives you:
-
Structured performance monitoring
-
Clear month comparison
-
Target accountability
-
Growth tracking
-
Visual performance trends
Therefore, you do not guess.
Instead, you decide based on data.
When you track KPIs consistently, you:
-
Reduce waste
-
Improve yield
-
Increase profit
-
Strengthen growth
Ultimately, you transform your microbrewery into a data-driven success story.
Click to Purchases Microbreweries KPI Dashboard in Excel
Frequently Asked Questions (FAQs)
❓ What is the main purpose of a Microbreweries KPI Dashboard?
The main purpose is to track production, sales, financial, and quality KPIs in one centralized Excel dashboard.
❓ Can beginners use this dashboard?
Yes. The dashboard uses structured input sheets and drop-down selections. Therefore, even beginners can use it easily.
❓ How often should I update the dashboard?
You should update it monthly. However, reviewing trends weekly improves decision-making.
❓ Can I customize KPIs?
Yes. You can add, modify, or remove KPIs in the KPI Definition sheet.
❓ Does the dashboard support multi-year analysis?
Yes. You can modify the structure to include additional years if needed.
❓ Why should I compare Previous Year data?
Because growth matters more than absolute numbers. Previous Year comparison shows real improvement.
Click to Purchases Microbreweries KPI Dashboard in Excel
Visit our YouTube channel to learn step-by-step video tutorials