The mobile gaming industry continues to grow at an incredible pace. Every day, millions of players install games, make in-app purchases, watch ads, and engage with new content. However, success in mobile gaming no longer depends only on creativity or game mechanics. Instead, it depends on how well teams track, analyze, and act on performance data.
That is exactly why a Mobile Gaming KPI Dashboard in Power BI becomes a critical decision-making tool for game studios, publishers, and analytics teams. This dashboard converts raw gaming data into meaningful insights, allowing teams to monitor performance, identify trends, and improve player experience continuously.
In this detailed guide, you will learn what a Mobile Gaming KPI Dashboard in Power BI is, how it works, why it matters, how each dashboard page supports decisions, its advantages, best practices, and frequently asked questions. Moreover, this article explains everything in clear and simple language so that even non-technical users can understand and apply it confidently.
Click to Purchases Mobile Gaming KPI Dashboard in Power BI
What Is a Mobile Gaming KPI Dashboard in Power BI?
A Mobile Gaming KPI Dashboard in Power BI is a structured, interactive analytics solution designed to track and analyze key performance indicators (KPIs) related to mobile game performance.
Instead of relying on scattered Excel sheets, manual reports, or delayed insights, this dashboard centralizes all gaming KPIs into one visual and interactive platform. As a result, gaming teams gain real-time visibility into revenue, engagement, retention, growth, and operational efficiency.
Because the dashboard uses Microsoft Power BI for visualization and Microsoft Excel as the data source, it remains both powerful and easy to maintain. Therefore, teams can update data quickly while still enjoying advanced analytics and visuals.
Why Is a Mobile Gaming KPI Dashboard Important?
Mobile gaming generates massive volumes of data every day. However, data alone does not create value. Value comes from clear insights and fast decisions.
A Mobile Gaming KPI Dashboard in Power BI helps because:
-
It centralizes all critical KPIs in one place
-
It reduces manual reporting and calculation errors
-
It improves visibility across teams and leadership
-
It supports faster, data-driven decisions
-
It highlights performance gaps before they grow
Moreover, when teams track KPIs consistently, they can optimize monetization, improve retention, and enhance player satisfaction.
What KPIs Can You Track in a Mobile Gaming KPI Dashboard?
Although KPIs vary by game and business model, a Mobile Gaming KPI Dashboard typically tracks:
-
Daily Active Users (DAU)
-
Monthly Active Users (MAU)
-
Average Revenue Per User (ARPU)
-
In-App Purchase Revenue
-
Ad Revenue
-
Retention Rate
-
Churn Rate
-
Session Length
-
Crash Rate
-
Conversion Rate
Because the dashboard supports KPI Groups, teams can organize metrics into logical categories such as Revenue, Engagement, Performance, and Growth.
How Does the Mobile Gaming KPI Dashboard in Power BI Work?
The dashboard follows a simple but powerful workflow:
-
You enter data into structured Excel input sheets
-
Power BI reads and processes the data
-
KPIs calculate automatically using predefined formulas
-
Visuals update instantly based on slicer selections
As a result, users spend less time preparing reports and more time analyzing results.
Click to Purchases Mobile Gaming KPI Dashboard in Power BI
What Are the Key Pages in the Mobile Gaming KPI Dashboard?
The Mobile Gaming KPI Dashboard in Power BI contains three well-designed pages, each serving a specific analytical purpose.
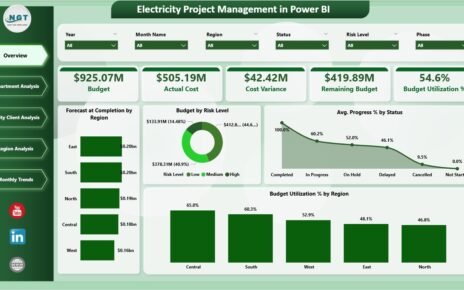
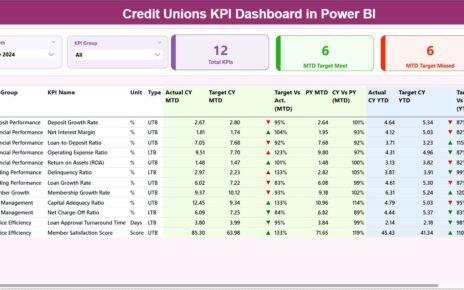
What Is the Summary Page in the Mobile Gaming KPI Dashboard?

The Summary Page acts as the executive overview of the entire dashboard.
Key Elements of the Summary Page
At the top of the page, you see:
-
Month slicer to filter performance by time period
-
KPI Group slicer to focus on specific KPI categories
These slicers allow quick and flexible analysis without changing the underlying data.
KPI Cards on the Summary Page
The Summary Page displays three high-level KPI cards:
-
Total KPIs Count
-
MTD Target Meet Count
-
MTD Target Missed Count
These cards instantly show how many KPIs perform well and how many require attention.
Detailed KPI Table on the Summary Page
Below the cards, a detailed KPI table provides deep insights. This table includes:
-
KPI Number – Sequence number of the KPI
-
KPI Group – Category of the KPI
-
KPI Name – Name of the KPI
-
Unit – Measurement unit
-
Type – LTB (Lower the Better) or UTB (Upper the Better)
MTD Performance Columns
For Month-to-Date analysis, the dashboard shows:
-
Actual CY MTD – Current year actual MTD value
-
Target CY MTD – Target MTD value
-
MTD Icon – Green ▲ or Red ▼ to indicate target achievement
-
Target vs Actual (MTD) – Actual ÷ Target percentage
-
PY MTD – Previous year MTD value
-
CY vs PY (MTD) – Current MTD ÷ Previous year MTD
YTD Performance Columns
For Year-to-Date analysis, the dashboard displays:
-
Actual CY YTD – Current year actual YTD
-
Target CY YTD – Target YTD
-
YTD Icon – Performance indicator
-
Target vs Actual (YTD) – Actual ÷ Target percentage
-
PY YTD – Previous year YTD
-
CY vs PY (YTD) – Current YTD ÷ Previous year YTD
Because of conditional formatting and icons, users can spot issues instantly without reading numbers line by line.
What Is the KPI Trend Page in the Mobile Gaming KPI Dashboard?

The KPI Trend Page focuses on performance trends over time.
Features of the KPI Trend Page
-
Two combo charts for MTD and YTD analysis
-
Actual values for current year
-
Previous year comparison
-
Target values
On the left side, a KPI Name slicer allows users to select any KPI and view its performance trend instantly.
Because trends reveal patterns, this page helps teams understand whether performance improves, declines, or remains stable.
What Is the KPI Definition Page and Why Is It Important?

The KPI Definition Page acts as a reference and governance layer.
Key Characteristics of the KPI Definition Page
-
It works as a drill-through page
-
It remains hidden to keep the dashboard clean
-
Users access it by drilling from the Summary Page
What Information Does It Show?
-
KPI Formula
-
KPI Definition
-
KPI Unit
-
KPI Type (LTB or UTB)
This page ensures clarity, consistency, and transparency, especially when multiple teams use the same dashboard.
How Do You Navigate Back to the Main Page?
Navigation remains simple and user-friendly. A Back button on the top-left corner allows users to return to the Summary Page instantly.
What Is the Excel Data Structure for the Mobile Gaming KPI Dashboard?
The dashboard uses an Excel file as its data source. This design keeps data entry simple and flexible.
What Is the Input_Actual Sheet?
The Input_Actual sheet captures actual KPI values.
Columns You Fill in This Sheet
-
KPI Name
-
Month (first date of the month)
-
MTD Actual Value
-
YTD Actual Value
Because the structure remains consistent, Power BI processes the data smoothly.
What Is the Input_Target Sheet?
The Input_Target sheet captures target values.
Columns You Fill in This Sheet
-
KPI Name
-
Month (first date of the month)
-
MTD Target Value
-
YTD Target Value
Targets help teams evaluate performance objectively.
What Is the KPI Definition Sheet?
The KPI Definition sheet defines each KPI clearly.
Columns in the KPI Definition Sheet
-
KPI Number
-
KPI Group
-
KPI Name
-
Unit
-
Formula
-
Definition
-
Type (LTB or UTB)
This sheet supports strong KPI governance and reduces confusion.
Click to Purchases Mobile Gaming KPI Dashboard in Power BI
Advantages of a Mobile Gaming KPI Dashboard in Power BI
A Mobile Gaming KPI Dashboard in Power BI offers several business-critical advantages.
1. Centralized Performance Visibility
Instead of switching between reports, teams view all KPIs in one dashboard.
2. Faster Decision-Making
Because visuals update instantly, teams act faster and more confidently.
3. Reduced Manual Effort
Automated calculations eliminate repetitive Excel work.
4. Improved Accountability
Clear targets and icons make ownership and performance gaps visible.
5. Better Trend Analysis
MTD, YTD, and previous year comparisons reveal long-term patterns.
How Does This Dashboard Help Different Gaming Teams?
Different roles benefit in different ways.
For Game Producers
They track feature performance and player engagement.
For Marketing Teams
They monitor acquisition efficiency and monetization trends.
For Analysts
They analyze performance deeply without rebuilding reports.
For Leadership
They get a high-level view of business health instantly.
Best Practices for the Mobile Gaming KPI Dashboard in Power BI
To maximize value, follow these best practices.
1. Define KPIs Clearly
Always document formulas and definitions in the KPI Definition sheet.
2. Update Data Consistently
Update actuals and targets on a fixed schedule.
3. Group KPIs Logically
Use meaningful KPI groups such as Revenue or Engagement.
4. Review Targets Regularly
Adjust targets based on business strategy and market changes.
5. Use Trends, Not Just Snapshots
Analyze MTD and YTD trends instead of isolated numbers.
How Can You Scale the Mobile Gaming KPI Dashboard?
As your business grows, you can:
-
Add more KPIs
-
Introduce new KPI Groups
-
Extend trend analysis
-
Integrate additional data sources
Because Power BI supports scalability, the dashboard grows with your needs.
Click to Purchases Mobile Gaming KPI Dashboard in Power BI
Conclusion: Why Should You Use a Mobile Gaming KPI Dashboard in Power BI?
A Mobile Gaming KPI Dashboard in Power BI transforms raw data into actionable intelligence. It simplifies reporting, improves visibility, and supports smarter decisions across teams.
Because the dashboard combines structured Excel input with powerful Power BI visuals, it remains easy to maintain and highly insightful. Whether you manage a single mobile game or a large gaming portfolio, this dashboard helps you stay competitive, data-driven, and future-ready.
Frequently Asked Questions About Mobile Gaming KPI Dashboard in Power BI
What is a Mobile Gaming KPI Dashboard in Power BI used for?
It tracks, analyzes, and visualizes mobile gaming performance KPIs in one centralized dashboard.
Do I need advanced Power BI skills to use this dashboard?
No. The dashboard uses simple slicers and visuals, making it user-friendly for non-technical users.
Can I customize KPIs in this dashboard?
Yes. You can add, remove, or modify KPIs easily using the Excel input sheets.
How often should I update the data?
Most teams update data monthly, but you can update it more frequently if needed.
Can this dashboard support multiple games?
Yes. You can extend the model to include multiple games or studios.
Click to Purchases Mobile Gaming KPI Dashboard in Power BI
Visit our YouTube channel to learn step-by-step video tutorials