Municipalities play a vital role in maintaining urban infrastructure, managing public utilities, and ensuring community well-being. However, tracking the performance of multiple departments — such as sanitation, water supply, public safety, waste management, and citizen services — can be complex and time-consuming.
To manage this effectively, cities and municipal bodies need data-driven tools that provide real-time insights into service performance. That’s where the Municipal Services KPI Scorecard in Excel comes in — a ready-to-use performance tracking solution that simplifies reporting and enhances operational transparency.
In this detailed guide, we’ll explore everything about this Excel-based scorecard — its structure, features, benefits, and best practices for effective use.
Click to Purchases Municipal Services KPI Scorecard in Excel
🧭 What Is a Municipal Services KPI Scorecard in Excel?
A Municipal Services KPI Scorecard is an analytical Excel tool that helps local governments monitor and evaluate key performance indicators (KPIs) across various departments.
It combines all important service metrics — from waste collection rates to water supply quality and infrastructure maintenance — in a single, interactive Excel workbook.
This scorecard enables municipal leaders, planners, and administrators to make informed decisions, allocate resources efficiently, and improve service delivery outcomes.
🎯 Objectives of the Scorecard
-
Track monthly and yearly performance of municipal services.
-
Compare actual results with targets for each KPI.
-
Identify service areas that require immediate attention.
-
Provide a clear, visual summary of municipal operations.
-
Enhance accountability and transparency across departments.
🧩 Structure of the Municipal Services KPI Scorecard
The Excel workbook includes four worksheets, each serving a specific analytical purpose:
1️⃣ Scorecard Sheet
2️⃣ KPI Trend Sheet
3️⃣ Input Data Sheet
4️⃣ KPI Definition Sheet
Let’s explore how each of these works.
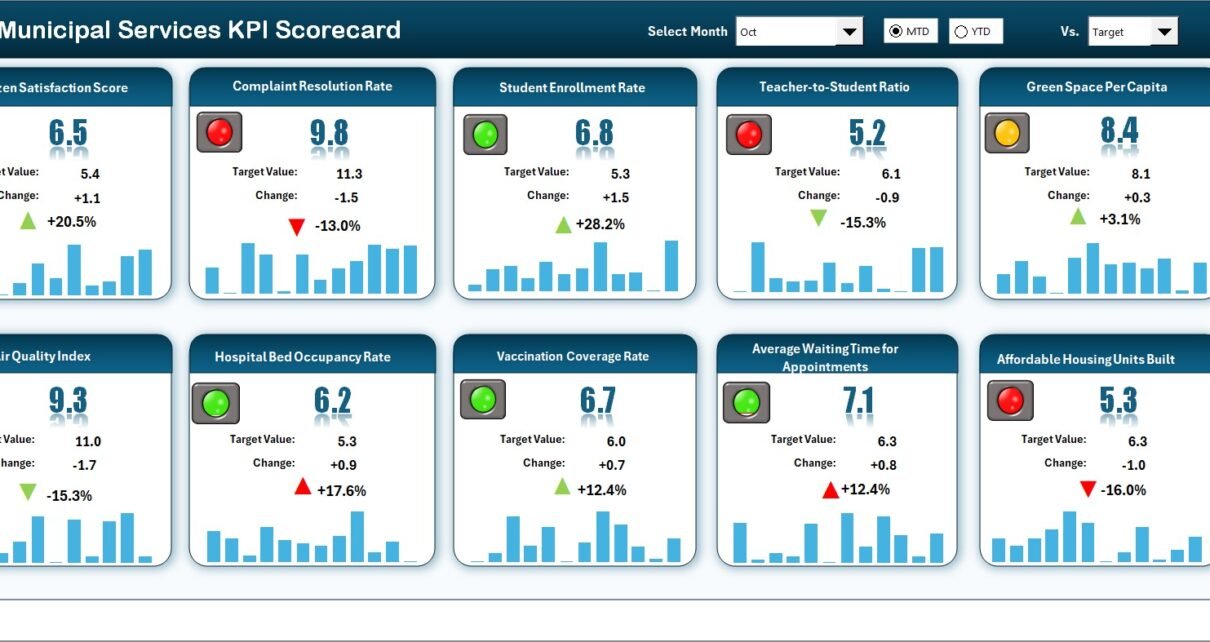
📊 1. Scorecard Sheet – The Performance Dashboard
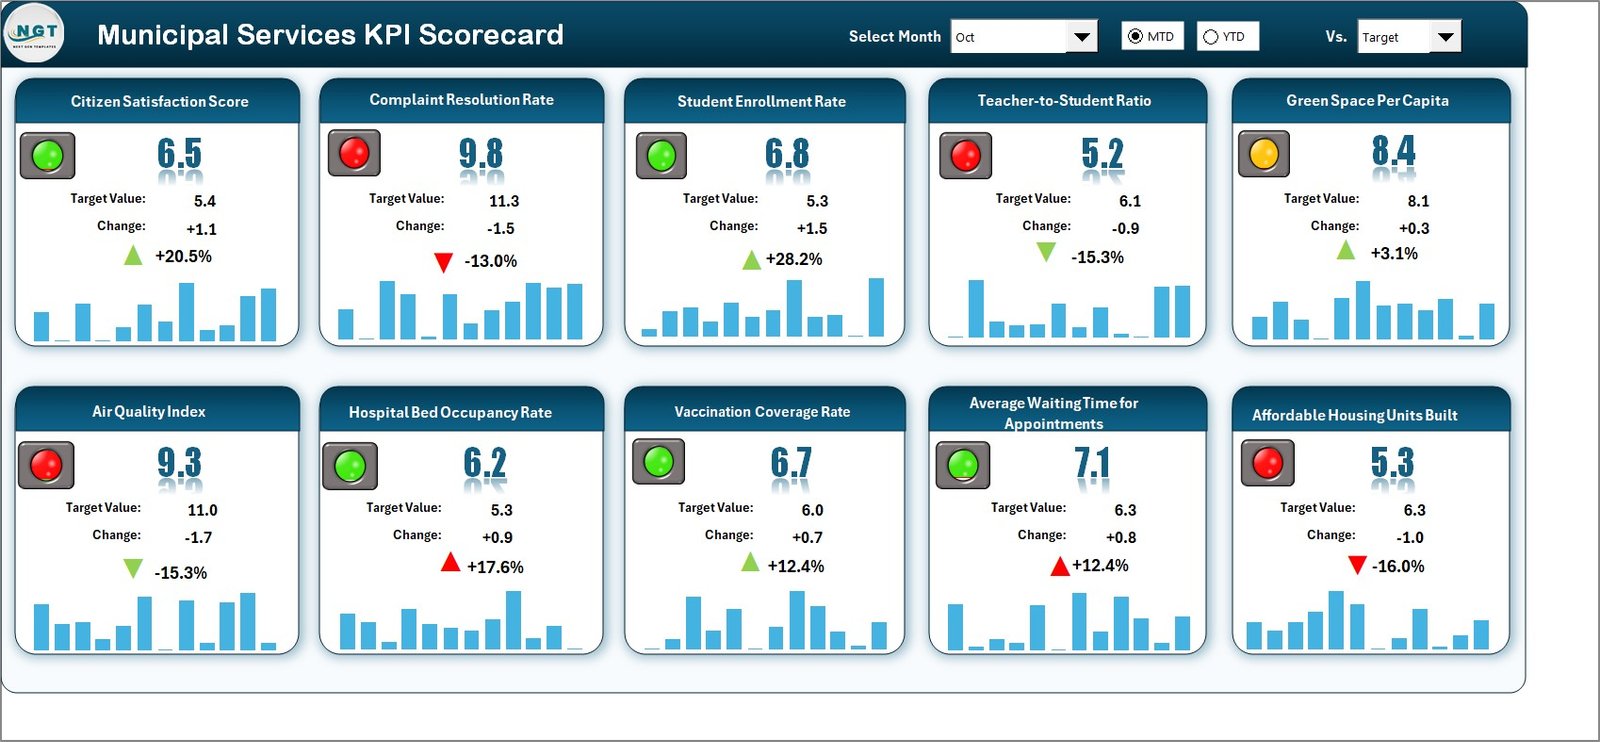
The Scorecard Sheet is the main interface of the Municipal Services KPI Scorecard. It provides a complete view of performance metrics through visuals, dropdowns, and conditional formatting.
🔹 Key Features
-
Dropdown Menus:
Choose the month, and select MTD (Month-to-Date) or YTD (Year-to-Date) for dynamic performance analysis. -
Actual vs Target Comparison:
Quickly see how each KPI performs against its set targets. -
Visual Indicators:
Color-coded arrows (green for good performance, red for poor) help identify areas meeting or missing goals. -
Comprehensive Overview:
View all key KPIs in one place — including MTD, YTD, and previous year comparisons.
🔹 Example KPIs Tracked
-
Waste Collection Efficiency (%)
-
Water Quality Compliance (%)
-
Streetlight Uptime (%)
-
Emergency Response Time (Minutes)
-
Road Maintenance Completion (%)
-
Revenue Collection Rate (%)
-
Citizen Satisfaction Score
This layout allows administrators to instantly assess which departments are performing well and where corrective action is needed.
Click to Purchases Municipal Services KPI Scorecard in Excel
📈 2. KPI Trend Sheet – Understanding Performance Patterns
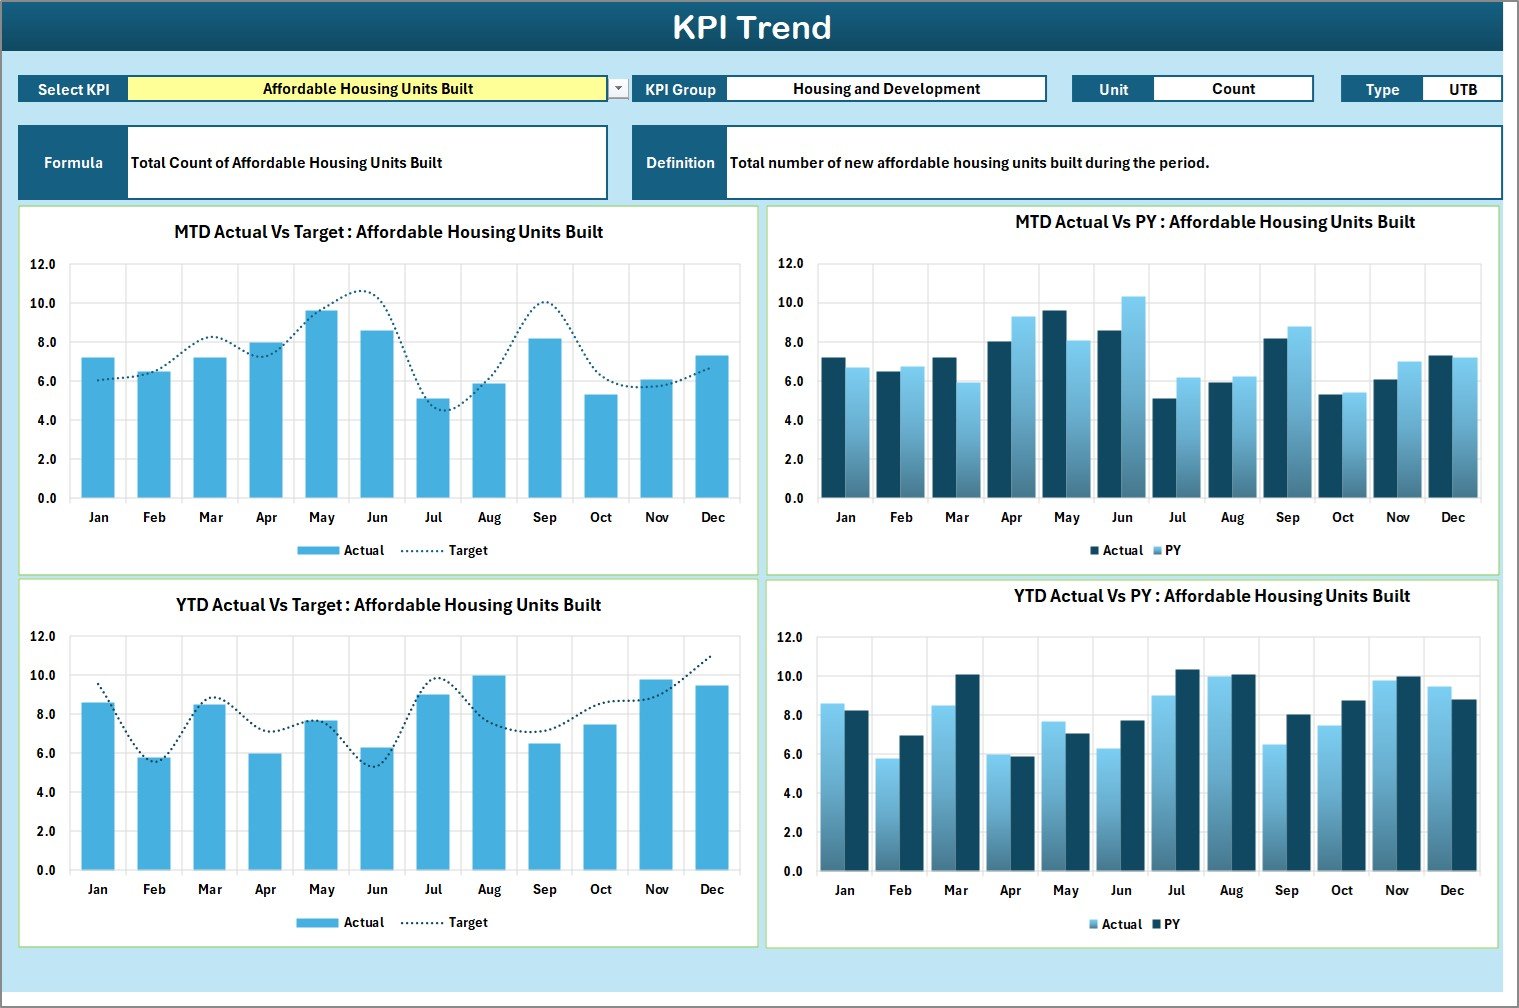
The KPI Trend Sheet focuses on analyzing how performance evolves over time. It turns raw numbers into actionable visual insights.
🔹 Interactive KPI Selection
You can select any KPI from a dropdown menu located in cell C3. Once selected, the sheet displays all relevant details for that KPI.
🔹 Key Information Displayed
-
KPI Group: Department or service category (e.g., Water Supply, Waste Management, Safety).
-
Unit: The measurement unit (e.g., %, Count, Minutes, Liters).
-
Type: Specifies if the KPI is Upper the Better (UTB) or Lower the Better (LTB).
-
Formula: Shows how the KPI is calculated.
-
Definition: Provides a clear understanding of what the KPI measures.
🔹 Trend Charts
Two major charts are included:
-
MTD Trend Chart: Displays month-wise comparisons for Actual, Target, and Previous Year values.
-
YTD Trend Chart: Shows cumulative performance across the year.
These visuals make it easy to detect trends, seasonal variations, or consistent problem areas.
📋 3. Input Data Sheet – The Foundation of the Scorecard
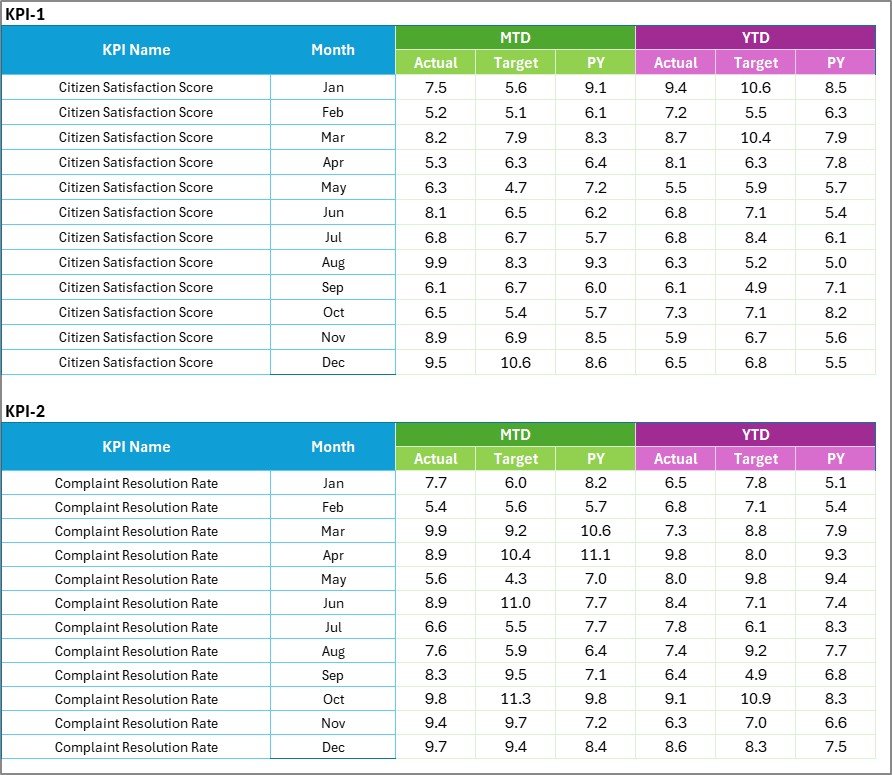
The Input Data Sheet is the data entry area where users input monthly and yearly figures for all KPIs.
🔹 How to Use
-
Enter the KPI Name, Month, Actual Value, and Target Value.
-
Add any relevant performance notes if required.
-
Update data each reporting cycle (monthly or quarterly).
🔹 Key Benefits
-
Centralized data management for all KPIs.
-
Flexible and easy to update as new results come in.
-
Reduces manual effort in recalculating performance figures.
When you update this sheet, the changes automatically reflect across the Scorecard and Trend sheets.
📘 4. KPI Definition Sheet – Ensuring Clarity and Consistency
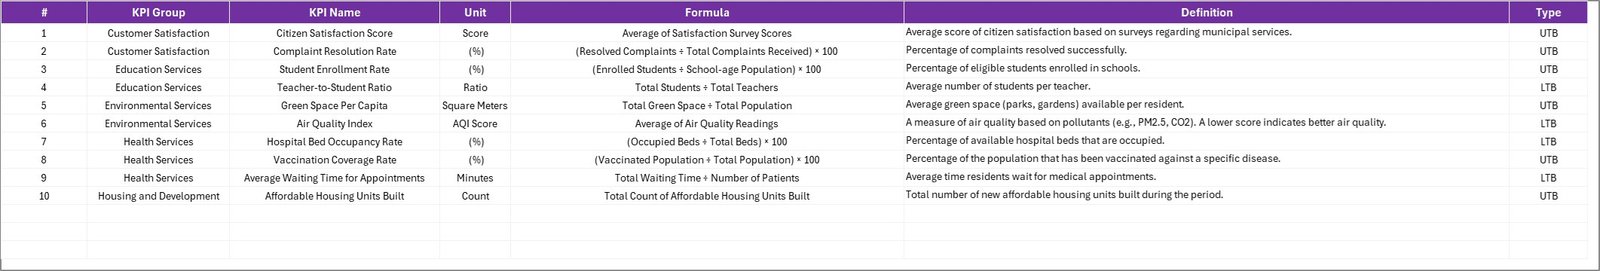
The KPI Definition Sheet serves as a reference guide for all metrics used in the scorecard.
🔹 Information Included
-
KPI Name
-
KPI Group
-
Unit of Measurement
-
Formula
-
Definition
This ensures that everyone in the organization interprets KPIs consistently. For instance, “Waste Collection Efficiency” might be calculated as Collected Waste / Total Generated Waste × 100 — and this formula remains visible for all users.
By maintaining this sheet, departments can align their data collection processes and reporting methods.
Click to Purchases Municipal Services KPI Scorecard in Excel
⚙️ How the Municipal Services KPI Scorecard Works
The working mechanism of this Excel scorecard is simple yet powerful.
Step-by-Step Workflow
-
Enter KPI data in the Input Data Sheet (Actual, Target, and Previous Year).
-
Select the month in the Scorecard sheet dropdown.
-
View automatic updates in the dashboard charts and visuals.
-
Analyze performance trends in the KPI Trend Sheet.
-
Refer to KPI definitions to ensure consistent understanding.
All calculations and visuals are automated, allowing for error-free analysis with minimal manual effort.
🌟 Advantages of the Municipal Services KPI Scorecard in Excel
Using this Excel-based KPI scorecard brings measurable improvements in efficiency, transparency, and accountability.
✅ Key Advantages
-
Centralized Performance Tracking: Consolidates multiple departmental KPIs into one unified dashboard.
-
Quick Analysis: Instantly highlights whether each KPI is meeting or missing its target.
-
Visual Clarity: Conditional formatting and color-coded visuals make data interpretation effortless.
-
Easy to Customize: Add or modify KPIs based on new municipal goals.
-
Improved Accountability: Department heads can regularly track their performance.
-
Data-Driven Decisions: Enables city leaders to make strategic improvements backed by facts.
-
Time-Saving: Reduces the effort required for manual reporting.
-
Citizen Transparency: Ideal for presenting public performance reports.
This tool not only improves internal management but also helps municipal authorities communicate performance to citizens clearly and confidently.
🧠 Opportunities for Improvement
While the current version of the Municipal Services KPI Scorecard is robust, several enhancements can further increase its value.
🔹 Recommended Enhancements
-
Add Departmental Filters: Allow filtering KPIs by department (e.g., Sanitation, Transport).
-
Integrate Charts by Zone or Ward: Compare performance across city zones.
-
Include Budget Utilization Metrics: Track how efficiently funds are being used.
-
Automate Data Updates: Use Power Query to connect live databases or CSV files.
-
Introduce Benchmarking: Compare KPI results with regional or national averages.
-
Add Comments Section: Let department heads add qualitative observations.
These upgrades can transform the scorecard into a full-fledged municipal performance management system.
🧭 Best Practices for Using the Scorecard
To maximize accuracy and usability, follow these best practices while working with the Municipal Services KPI Scorecard in Excel.
🧾 Data Management
-
Maintain consistent KPI naming across all sheets.
-
Verify data before updating each month.
-
Always use the correct month format (e.g., 01-Jan-2025).
📊 Analysis
-
Review both MTD and YTD results to understand short- and long-term trends.
-
Use conditional formatting wisely — avoid too many color variations.
-
Regularly compare current year results with the previous year.
🧰 Maintenance
-
Protect formula cells to prevent accidental edits.
-
Archive past years’ data for historical analysis.
-
Review and update KPI definitions annually to reflect evolving priorities.
By following these best practices, municipal teams can ensure that their scorecard remains accurate, reliable, and meaningful.
🧮 Example KPIs for Municipal Services
Here are some example KPIs that can be tracked using this Excel scorecard:
🧹 Waste Management
-
Waste Collection Efficiency (%)
-
Recycling Rate (%)
-
Waste Disposal Cost per Ton (USD)
💧 Water Supply
-
Water Quality Compliance (%)
-
Water Supply Interruptions (Hours/Month)
-
Average Daily Consumption per Capita (Liters)
🚦 Infrastructure & Maintenance
-
Road Repair Completion Rate (%)
-
Streetlight Uptime (%)
-
Public Facility Maintenance Requests Completed (%)
🏥 Public Health & Safety
-
Response Time to Emergencies (Minutes)
-
Health Inspection Compliance Rate (%)
-
Reported Safety Incidents per 1,000 Citizens
💰 Finance & Revenue
-
Revenue Collection Rate (%)
-
Budget Utilization Efficiency (%)
-
Project Completion within Budget (%)
These KPIs provide a balanced perspective on the city’s operational health and service quality.
📊 How This Scorecard Supports Decision-Making
The Municipal Services KPI Scorecard is not just a monitoring tool — it’s a decision-support system.
💡 Here’s How It Helps:
-
Identifies Bottlenecks: Quickly detect underperforming departments.
-
Improves Efficiency: Streamline resource allocation based on actual needs.
-
Encourages Accountability: Performance results are visible to all stakeholders.
-
Enhances Transparency: Municipalities can share reports with citizens or governing bodies.
-
Supports Strategic Planning: Data trends guide future investment priorities.
This structured, analytical approach transforms municipal management from reactive to proactive.
🧾 Conclusion
The Municipal Services KPI Scorecard in Excel is a simple yet powerful tool for enhancing municipal performance management. It transforms complex data into actionable insights, empowering local governments to deliver better, faster, and more reliable public services.
With its interactive interface, trend tracking, and visual scorecard, this Excel-based system ensures that every department — from sanitation to finance — stays aligned with city objectives.
For city managers and administrators, adopting this tool means one thing: greater efficiency, transparency, and citizen satisfaction.
You can download the Municipal Services KPI Scorecard in Excel from NextGenTemplates.com and start monitoring your city’s performance today.
Click to Purchases Municipal Services KPI Scorecard in Excel
❓ Frequently Asked Questions (FAQs)
1. What is a Municipal Services KPI Scorecard?
It’s an Excel-based tool that tracks key performance indicators for city departments like water, waste, health, and safety.
2. How many sheets are included in this scorecard?
It contains four sheets — Scorecard, KPI Trend, Input Data, and KPI Definition.
3. Can I add my own KPIs?
Yes, the file is fully customizable. You can add, remove, or modify KPIs anytime.
4. How are MTD and YTD calculated?
They are calculated automatically based on monthly and yearly data entries in the Input sheet.
5. Does it include visual indicators?
Yes, conditional formatting with green/red arrows highlights performance status.
6. Can it handle large data sets?
Yes, Excel formulas and pivot structures support hundreds of KPIs.
7. Is it suitable for small municipalities?
Absolutely. It’s scalable and works for both small towns and large cities.
8. Can it be shared across departments?
Yes, the workbook can be shared via Excel Online or cloud drives.
9. Do I need any special Excel skills?
No. The dashboard is user-friendly with automated calculations.
10. Where can I download it?
You can download it from NextGenTemplates.com and start improving municipal service delivery today.
Click to Purchases Municipal Services KPI Scorecard in Excel
Visit our YouTube channel to learn step-by-step video tutorials