In today’s world, sustainability isn’t just a trend—it’s a necessity. Whether you’re managing a single office or multiple branches, keeping energy usage in check helps cut costs and support green initiatives. That’s where an Office Energy Consumption Dashboard in Excel can make a real difference.
In this article, we’ll explore how this dashboard works, its powerful features, best practices for implementation, and why your office needs one today. Let’s dive in and discover how you can monitor energy usage with just a few clicks—no expensive software required!
Click to Purchases Office Energy Consumption Dashboard in Excel
What is the Office Energy Consumption Dashboard in Excel?
The Office Energy Consumption Dashboard in Excel is a ready-to-use, fully interactive spreadsheet template designed to track, analyze, and visualize energy usage across departments, locations, and equipment types.
Instead of juggling multiple reports, you get all the insights in one place—cost, consumption, efficiency, and ratings—organized in easy-to-read dashboards and charts. And since it’s built in Excel, there’s no need for technical expertise or special tools.
Why Should Offices Track Energy Consumption?
Energy costs can quickly add up, especially in large office buildings. Beyond the financial aspect, tracking energy use also supports sustainability goals and environmental compliance. When you actively monitor energy consumption, you can:
-
Identify energy-draining equipment
-
Improve energy efficiency
-
Reduce carbon footprints
-
Save money across departments
And the best part? You can do all of this using Excel, a tool most teams already use daily.
Key Features of the Office Energy Consumption Dashboard
The Excel dashboard is divided into several tabs, each serving a unique purpose. Let’s break down each one:
Page Navigator
Located at the top of the dashboard, the Page Navigator lets you jump between analytical pages with ease. This ensures a smooth user experience, especially when working with large datasets or switching between summaries.
Click to Purchases Office Energy Consumption Dashboard in Excel
Overview Page

The Overview Page provides a snapshot of your office’s total energy performance. You’ll find:
📊 Energy Cost (USD) by Office Location – See where you’re spending the most.
⚡ Energy Consumption (kWh) by Department – Analyze which departments use the most energy.
🌡️ Rating (1-5) by Month – Get a month-wise rating to identify improvement areas.
💡 Efficiency % by Energy Source – Track how efficiently each source is performing.
Departmental Summary

Want to see how each department contributes to overall consumption? This tab provides:
💲 Cost Per kWh by Department
⚡ Energy Cost (USD) by Department
⭐ Rating (1-5) by Department
🧠 Efficiency % by Department
With this, managers can compare and optimize department-wise energy use.
Office Location Summary

For companies with multiple locations, this sheet offers a deep-dive:
💵 Cost Per kWh by Office Location
🔌 Energy Consumption (kWh) by Location
⭐ Rating (1-5) by Location
⚙️ Efficiency % by Location
It helps identify which branches are performing well and which need attention.
Click to Purchases Office Energy Consumption Dashboard in Excel
Energy Source Summary
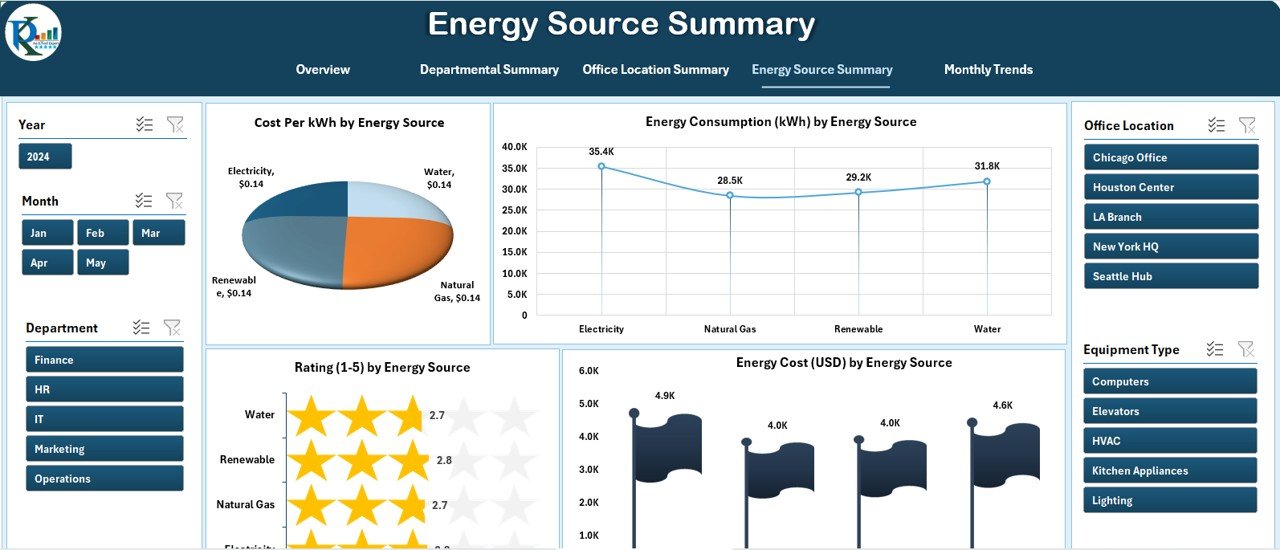
Not all energy sources are equal. This page lets you analyze:
🔋 Cost Per kWh by Energy Source
🌍 Energy Consumption (kWh) by Source
⭐ Rating (1-5) by Source
⚡ Efficiency % by Energy Source
Whether it’s electricity, solar, or generator use, this summary helps you make informed decisions.
Monthly Trends

Tracking performance over time is essential. This tab shows:
📅 Cost Per kWh by Month
🔄 Energy Consumption (kWh) by Month
📈 Efficiency % by Month
💸 Energy Cost (USD) by Month
Spot seasonal trends and plan smarter for upcoming months.
Data Sheet

All the visuals pull data from this master sheet. It includes:
Support Sheet

The Support Sheet contains dropdown values and lookups to ensure data integrity. It makes the dashboard more user-friendly and customizable without breaking formulas.
Advantages of Using the Office Energy Consumption Dashboard in Excel
🧠 Easy to Use: No need for special software—just open it in Excel.
📊 Visual Insights: Charts and cards help you spot trends quickly.
⚡ Real-Time Monitoring: Get current stats with just a data refresh.
💸 Cost Savings: Find and fix inefficiencies before they become expensive.
🌱 Sustainability Goals: Track and improve your office’s energy footprint.
Best Practices for Using the Dashboard Effectively
To get the most value out of your energy consumption dashboard, follow these tips:
✅ Keep Data Updated Regularly
Schedule weekly or monthly data entries to keep visuals accurate.
✅ Use Standard Units
Always input energy consumption in kWh and cost in USD for consistency.
✅ Validate Source Data
Ensure department names, energy types, and locations are consistent across entries.
✅ Review Monthly Trends
Take 10 minutes each month to review the Monthly Trends tab and take action.
✅ Involve Departments
Encourage department heads to monitor their performance and suggest changes.
How to Get Started with the Office Energy Dashboard
-
Download the Excel Template
Get your ready-to-use dashboard and open it in Excel (desktop version preferred). -
Input Historical Data
Fill in past records for better trend analysis. -
Start Monitoring
Use slicers, charts, and summaries to track performance. -
Make Improvements
Reduce cost and improve efficiency based on findings.
Who Can Use This Dashboard?
This Excel-based energy monitoring system suits:
-
Facilities Managers
-
Office Administrators
-
Sustainability Teams
-
Finance Teams
-
Building Management Consultants
If your job involves energy tracking or budgeting, this tool is for you.
How is This Better Than Other Tools?
While other platforms require subscriptions or technical knowledge, this dashboard is:
✅ Free to modify
✅ Accessible without the internet
✅ Customizable to your needs
✅ Built with familiar Excel functions
When Should You Use the Dashboard?
Use it when:
🌍 You’re setting sustainability goals
💡 You notice higher energy bills
🧾 You need to report consumption trends to leadership
🛠 You want to optimize office equipment usage
Conclusion: Track, Save, and Succeed with Excel
Managing office energy doesn’t have to be complicated. With the Office Energy Consumption Dashboard in Excel, you get everything you need to monitor, analyze, and improve energy performance in one place.
It’s fast, reliable, and simple. Whether you’re reducing overhead or hitting eco-friendly targets, this dashboard keeps you informed and in control.
Frequently Asked Questions (FAQs)
❓What is an Office Energy Consumption Dashboard in Excel?
It’s a pre-designed spreadsheet template that helps track and visualize energy data like cost, consumption, efficiency, and ratings across departments and locations.
❓Can I use this dashboard in Google Sheets?
It’s optimized for Microsoft Excel (desktop version). While some features may work in Google Sheets, charts and slicers might not display correctly.
❓Is this suitable for small offices?
Absolutely! Whether you have 5 employees or 500, this dashboard scales to fit your needs.
❓How often should I update the data?
Ideally, update it weekly or monthly for accurate and actionable insights.
❓Can I customize the charts and layouts?
Yes! You can change chart types, add filters, or modify formulas based on your specific needs.
❓Does it help in energy savings?
Yes. By identifying trends and inefficiencies, you can take informed actions to reduce waste and lower energy bills.
Visit our YouTube channel to learn step-by-step video tutorials
Click to Purchases Office Energy Consumption Dashboard in Excel