Managing office leases feels complex. Companies deal with multiple properties, different lease types, security deposits, maintenance charges, and escalation clauses. Moreover, managers often struggle to track renewals, expired leases, and industry-wise occupancy trends. As a result, businesses lose money, miss renewal deadlines, and face unexpected costs.However, you can simplify everything with an Office Lease Management Dashboard in Excel.This ready-to-use dashboard helps you track lease data in one centralized system. Furthermore, it converts raw lease records into powerful insights. Instead of using scattered spreadsheets, you can monitor rent, deposits, escalations, and renewals in a structured and visual way.
In this detailed guide, you will learn:
- What an Office Lease Management Dashboard in Excel is
- Why organizations need it
- A complete explanation of all dashboard pages
- Advantages of Office Lease Management Dashboard in Excel
- Best Practices for the Office Lease Management Dashboard
- Frequently Asked Questions with Answers
Click to buy Office Lease Management Dashboard in Excel
What Is an Office Lease Management Dashboard in Excel?
An Office Lease Management Dashboard in Excel is a ready-to-use lease tracking and financial monitoring tool built in Microsoft Excel. It helps companies manage office property leases, rental payments, maintenance costs, and renewal performance.
Instead of manually calculating lease costs, this dashboard allows you to:
- Monitor monthly rent and annual rent
- Track security deposits across regions
- Analyze escalation percentages
- Review lease status (Active, Expired, Terminated, Renewed)
- Study lease performance by industry and lease type
- Analyze monthly trends for better forecasting
Because Excel supports formulas, pivot tables, slicers, and charts, you can interact with the dashboard dynamically. Moreover, you can filter data by industry, region, lease type, or month.
As a result, decision-makers gain full visibility over lease operations.
Why Do Businesses Need an Office Lease Management Dashboard?
Office lease management directly impacts profitability. Therefore, companies must monitor lease costs carefully.
Many organizations face these challenges:
- Missed renewal dates
- Unexpected escalation increases
- Poor tracking of security deposits
- Unclear maintenance charge analysis
- No clear visibility into industry-wise occupancy
- Difficulty comparing lease types
However, when you use a structured dashboard, you solve these problems quickly. You can track performance in real time. Additionally, you can identify high-cost leases and take corrective action.
Therefore, a lease dashboard becomes a strategic financial tool rather than just a reporting sheet.
Complete Breakdown of the Office Lease Management Dashboard in Excel
This dashboard contains multiple sheet tabs. Each sheet focuses on a different analytical area. Let us explore each one in detail.
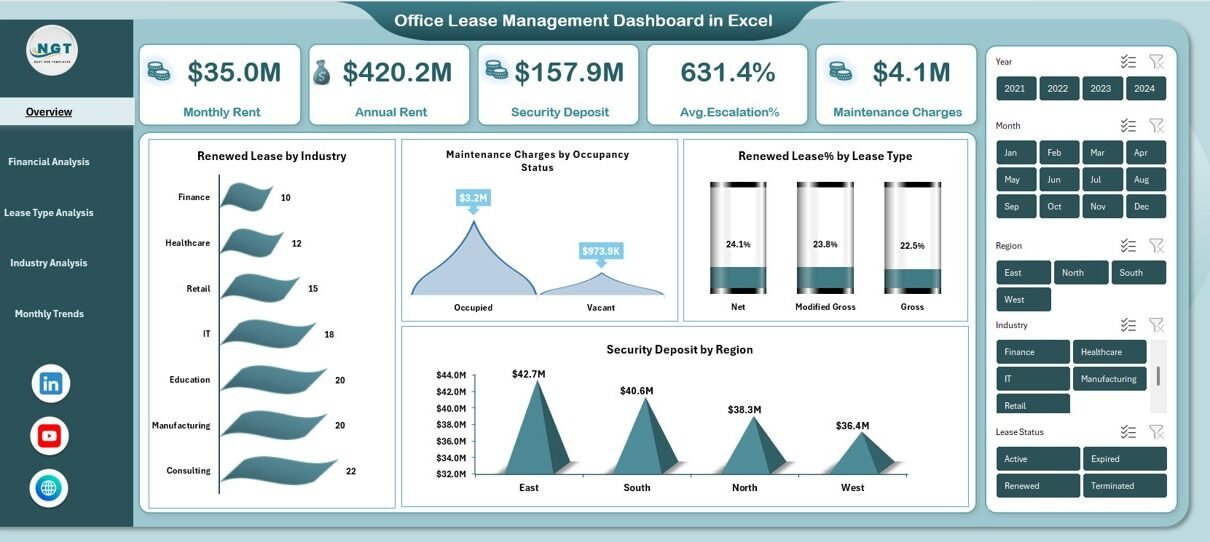
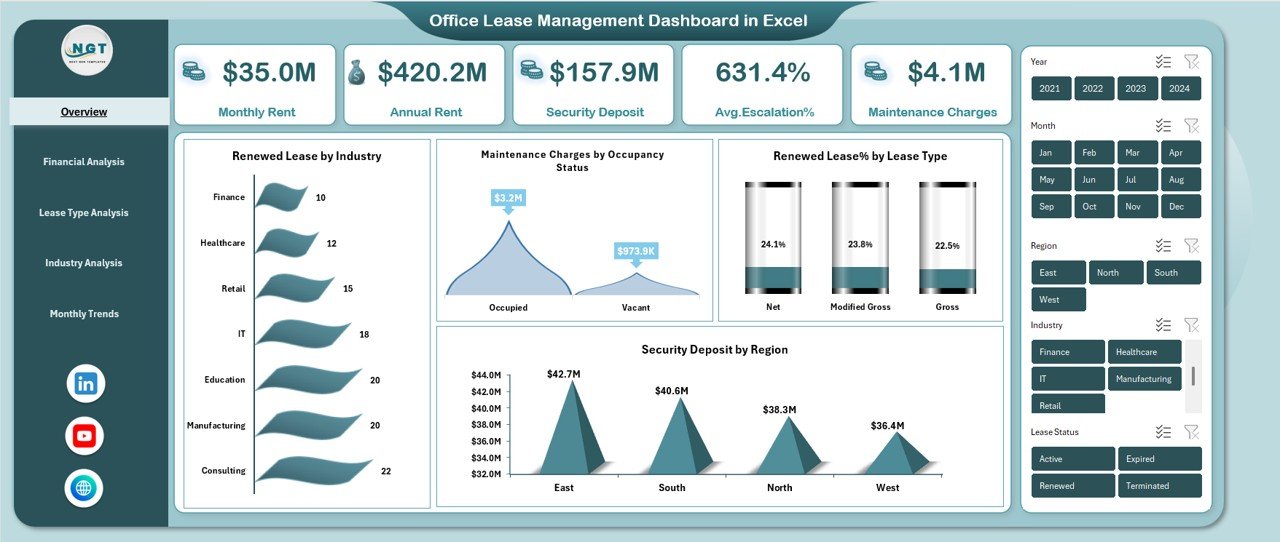
Overview Sheet Tab: What Does It Show?
The Overview Sheet acts as the main control panel of the dashboard. It provides a quick summary of key lease metrics.
Key KPIs Displayed:
- Monthly Rent
- Annual Rent
- Security Deposit
- Average Escalation %
- Maintenance Charges
These KPIs give you instant financial visibility. Moreover, you can quickly understand your total lease exposure.
Visual Charts Included:
- Renewed Lease by Industry
- Maintenance Charges by Occupancy Status
- Renewed Lease % by Lease Type
- Security Deposit by Region
Because this page summarizes everything, managers can take fast decisions without checking detailed sheets.
For example, if you notice high maintenance charges for vacant properties, you can immediately investigate.
Click to buy Office Lease Management Dashboard in Excel
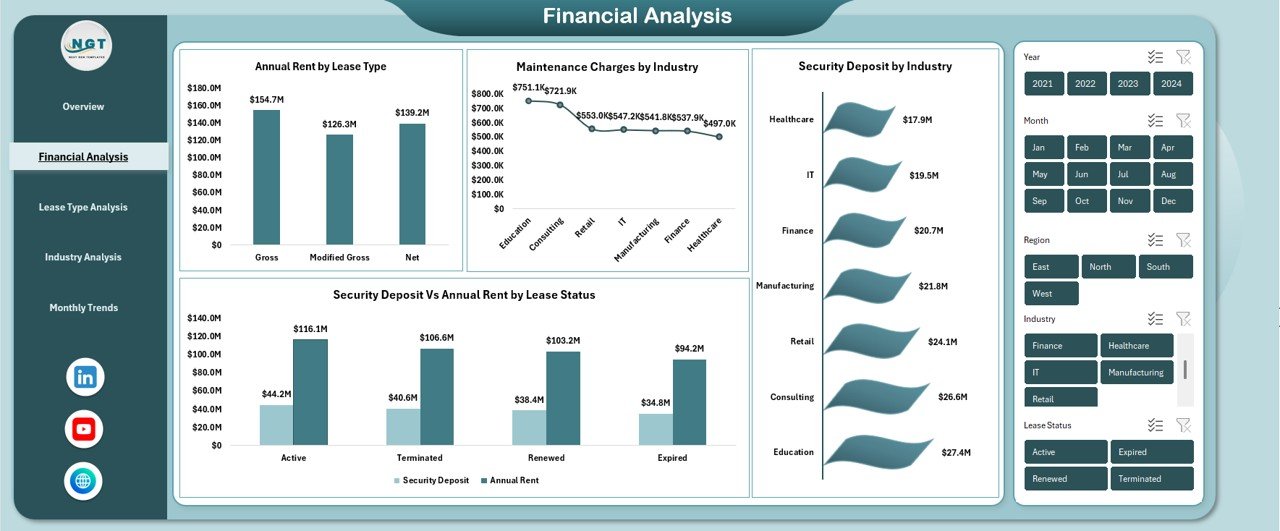
Financial Analysis: How Does It Help in Cost Control?
The Financial Analysis sheet focuses on money. Therefore, finance teams benefit the most from this section.
Charts Included:
- Annual Rent by Lease Type
- Maintenance Charges by Industry
- Security Deposit by Industry
- Security Deposit vs Annual Rent by Lease Status
This section helps you compare deposits with rental commitments. Moreover, it allows you to evaluate industry-wise lease exposure.
For instance, if one industry category holds a high security deposit but generates low annual rent, you can review contract terms.
Additionally, you can compare lease status such as Active vs Expired vs Terminated.
As a result, financial planning becomes easier and more accurate.
Click to buy Office Lease Management Dashboard in Excel
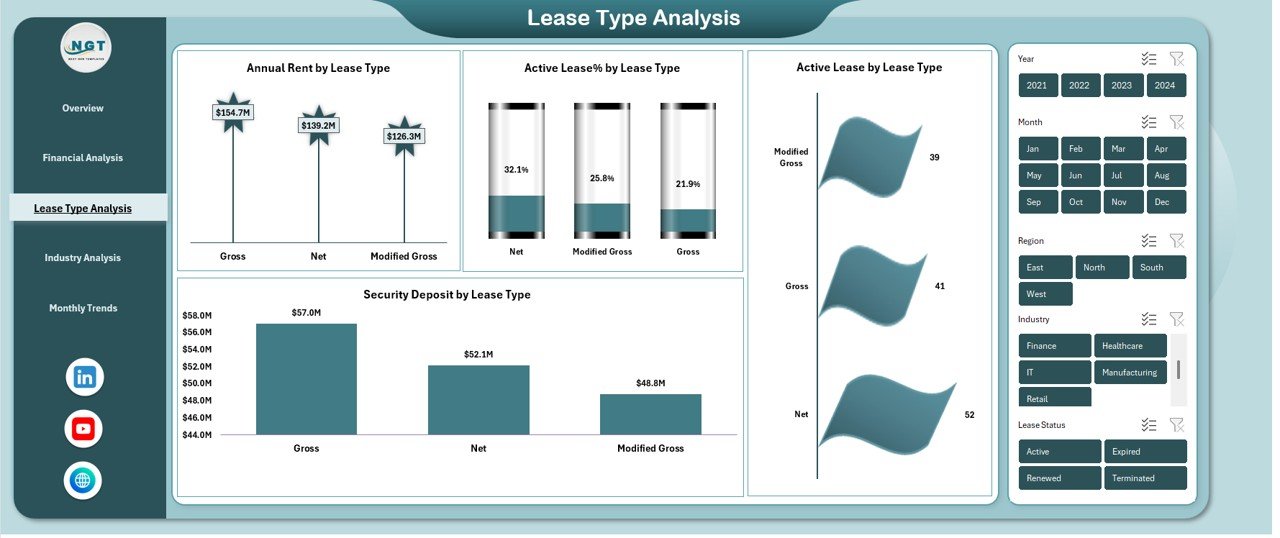
Lease Type Analysis: Which Lease Type Performs Better?
Different lease types carry different risks and returns. Therefore, businesses must analyze lease types carefully.
Key Visualizations:
- Annual Rent by Lease Type
- Active Lease % by Lease Type
- Security Deposit by Lease Type
- Active Lease by Lease Type
This page answers important questions:
- Which lease type generates the highest rent?
- Which lease type has the highest active percentage?
- How much security deposit does each lease type hold?
Moreover, you can evaluate stability. For example, if short-term leases show high termination rates, you may reconsider strategy.
Therefore, this sheet supports strategic lease planning.
Click to buy Office Lease Management Dashboard in Excel
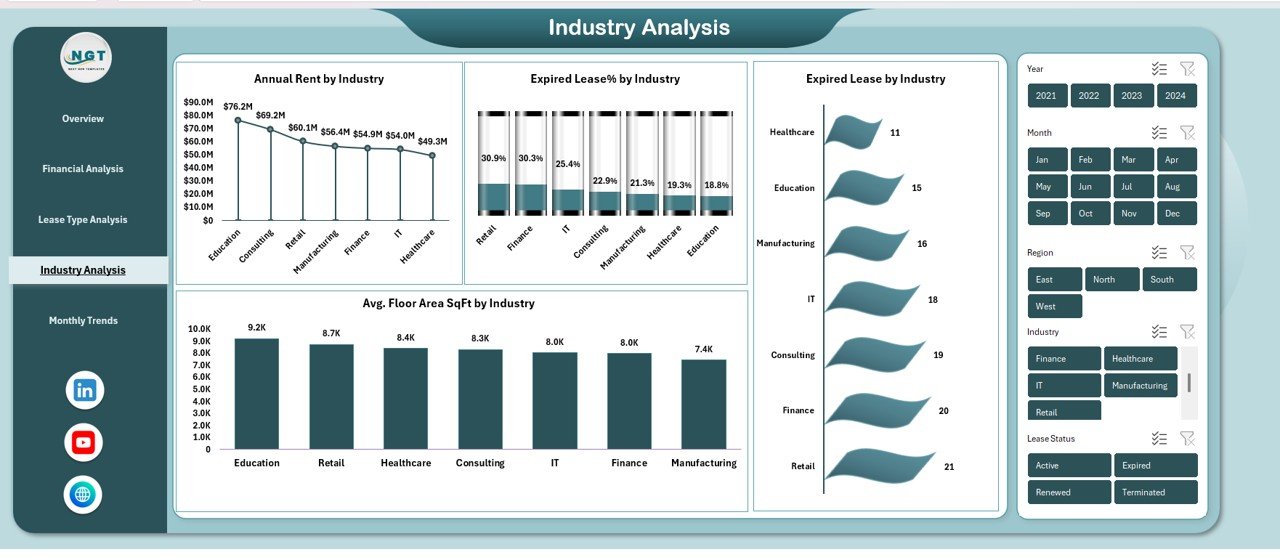
Industry Analysis: How Do Different Industries Perform?
Office properties often cater to different industries such as IT, Finance, Healthcare, Manufacturing, and Retail.
However, each industry behaves differently.
Key Metrics:
- Annual Rent by Industry
- Expired Lease % by Industry
- Average Floor Area (SqFt) by Industry
- Expired Lease by Industry
This analysis helps you understand:
- Which industry pays the highest rent
- Which industry faces more lease expirations
- How much space each industry occupies
For example, if one industry occupies large floor areas but shows high expired lease rates, you may need targeted retention strategies.
Thus, Industry Analysis supports business development decisions.
Click to buy Office Lease Management Dashboard in Excel
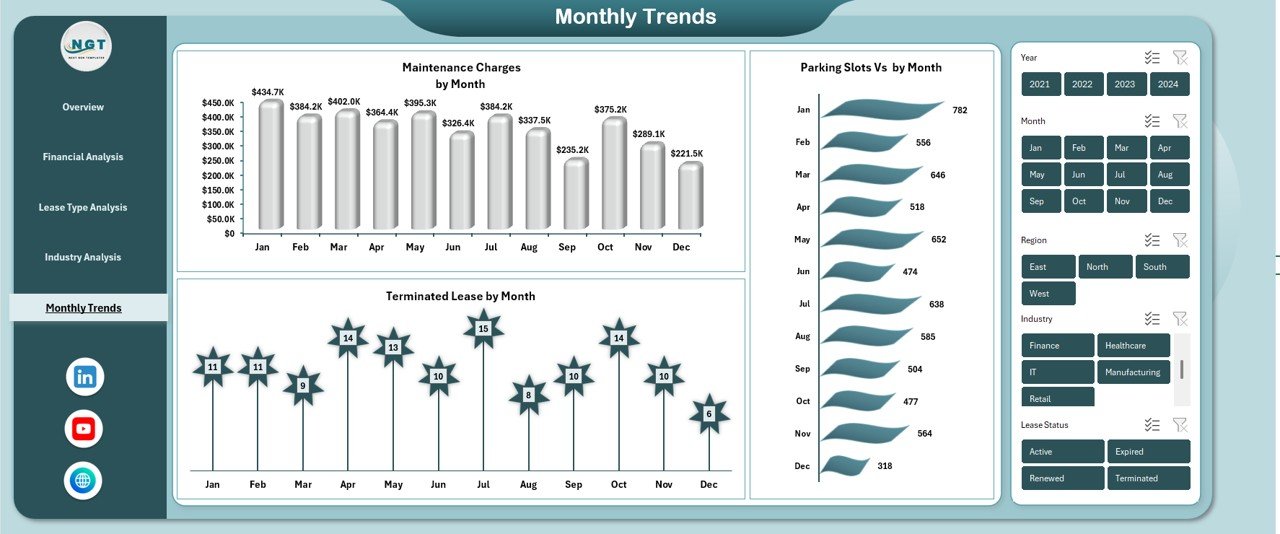
Monthly Trends: How Can You Forecast Lease Performance?
Trend analysis improves forecasting. Therefore, the Monthly Trends sheet becomes essential.
Monthly Charts Include:
- Maintenance Charges by Month
- Terminated Lease by Month
- Parking Slots vs Month
With this sheet, you can:
- Identify seasonal increases in maintenance costs
- Detect months with high lease terminations
- Evaluate parking utilization trends
Moreover, you can plan budgets more effectively. For example, if maintenance charges spike every March, you can allocate higher budgets in advance.
Therefore, monthly trends reduce financial surprises.
Click to buy Office Lease Management Dashboard in Excel
Advantages of Office Lease Management Dashboard in Excel
Now let us explore why this dashboard creates value.
- Centralized Lease Management
You can manage all lease data in one Excel file. Therefore, you avoid scattered records.
- Real-Time Financial Visibility
You instantly see monthly and annual rent figures. Moreover, you can track escalation impact immediately.
- Better Renewal Planning
Because the dashboard tracks renewed and expired leases, you can prepare renewal discussions in advance.
- Improved Cost Control
You can monitor maintenance charges and security deposits across industries and regions.
- Strategic Decision Support
You can compare lease types and industries. Therefore, leadership can optimize lease portfolio allocation.
- Easy Customization
Excel allows easy updates. You can add new properties, industries, or regions without complex software.
Best Practices for the Office Lease Management Dashboard
To maximize the dashboard’s benefits, follow these best practices:
- Update Data Monthly
Enter lease data consistently. Moreover, review KPIs at the start of every month.
- Use Clear Lease Status Categories
Maintain standardized status types such as Active, Expired, Renewed, and Terminated.
- Validate Escalation Percentages
Check escalation clauses regularly. Therefore, you avoid calculation errors.
- Monitor Expired Leases Weekly
Do not wait until year-end. Instead, track expiration dates continuously.
- Compare Deposit vs Rent Exposure
Ensure security deposits align with rental commitments.
- Analyze Industry Risk Quarterly
Review which industries show higher termination rates.
How Does This Dashboard Improve Business Performance?
When you manage leases effectively, you reduce operational risk.
- You prevent revenue leakage
- You avoid missed renewal opportunities
- You control maintenance expenses
- You improve property utilization
Moreover, you enhance transparency. Therefore, finance, operations, and management teams can collaborate better.
Ultimately, strong lease management protects profitability.
Who Should Use the Office Lease Management Dashboard?
This dashboard works best for:
- Real Estate Managers
- Facility Management Teams
- Corporate Finance Departments
- Property Portfolio Managers
- Administrative Heads
- Business Owners with Multiple Office Locations
Because Excel works offline and online, small and medium businesses can easily adopt this solution.
How to Use the Office Lease Management Dashboard in Excel?
Using this dashboard remains simple.
- Enter lease data in the input sheet.
- Update monthly rent and maintenance figures.
- Assign lease status correctly.
- Use slicers to filter by industry, region, or lease type.
- Review overview KPIs.
- Analyze financial and industry trends.
Within minutes, you gain powerful insights.
What Makes This Dashboard Different from Basic Excel Sheets?
Many companies use basic spreadsheets. However, they often lack structured analysis.
This dashboard provides:
- Automated calculations
- Visual KPI cards
- Dynamic pivot charts
- Interactive filters
- Multi-page analysis
Therefore, it transforms raw lease data into meaningful intelligence.
Conclusion
Office lease management demands attention, precision, and continuous monitoring. However, manual tracking creates confusion and financial risk.
The Office Lease Management Dashboard in Excel solves these challenges. It centralizes lease data, simplifies financial analysis, and improves renewal planning. Moreover, it empowers decision-makers with real-time visibility.
If you want to control rent expenses, monitor security deposits, analyze lease types, and track industry performance, this dashboard provides a structured and reliable solution.
Therefore, investing in a lease management dashboard is not just a reporting upgrade. It becomes a strategic business move.
Frequently Asked Questions with Answers
- What is an Office Lease Management Dashboard in Excel?
It is a ready-to-use Excel tool that tracks office lease data, rent, deposits, maintenance charges, and lease performance in one centralized dashboard.
- Can small businesses use this dashboard?
Yes. Small and medium businesses can easily use this dashboard because Excel supports flexible data entry and customization.
- How often should I update lease data?
You should update lease data monthly. However, you can review critical KPIs weekly for better control.
- Does this dashboard support multi-industry analysis?
Yes. It includes a dedicated Industry Analysis sheet that compares rent, expired leases, and floor area by industry.
- Can I customize the dashboard?
Yes. You can modify charts, add new fields, and expand categories based on your business needs.
- Does it help in renewal tracking?
Yes. The dashboard tracks renewed lease percentages and expired leases, which helps in renewal planning.
- Can I use it for multiple office locations?
Yes. You can track region-wise data, security deposits by region, and occupancy status easily.
Visit our YouTube channel to learn step-by-step video tutorials
Click to buy Office Lease Management Dashboard in Excel