In today’s fast-paced corporate environment, every square foot of office space matters, including parking areas. With increasing numbers of employees, visitors, and service vehicles, managing office parking efficiently has become a critical part of facility management. Poor parking utilization can lead to wasted space, frustrated employees, and higher operational costs.
The Office Parking Utilization Dashboard in Excel is a ready-to-use solution designed to help businesses monitor, analyze, and improve parking efficiency. It provides detailed insights into occupancy rates, departmental usage, vehicle types, parking zones, and monthly trends — all in a single, interactive Excel file.
This guide will walk you through everything you need to know about the dashboard: its features, advantages, setup, best practices, and how it can transform your office parking management.
Click to Purchases Office Parking Utilization Dashboard in Excel
What is the Office Parking Utilization Dashboard in Excel?
The Office Parking Utilization Dashboard in Excel is a powerful data visualization tool that gives facility managers and administrators a real-time view of how parking spaces are being used. It is designed with multiple pages, interactive slicers, and key performance indicators (KPIs) to track essential parking metrics.
The dashboard helps answer important questions like:
-
Which departments use the most parking spaces?
-
What percentage of vehicles are high-category or oversized?
-
How often are spaces left vacant?
-
Which parking zones experience the highest occupancy?
-
How do monthly trends impact parking demand?
Because it’s built entirely in Excel, there’s no need for specialized software — you can open, customize, and use it instantly.
Key Features of the Office Parking Utilization Dashboard
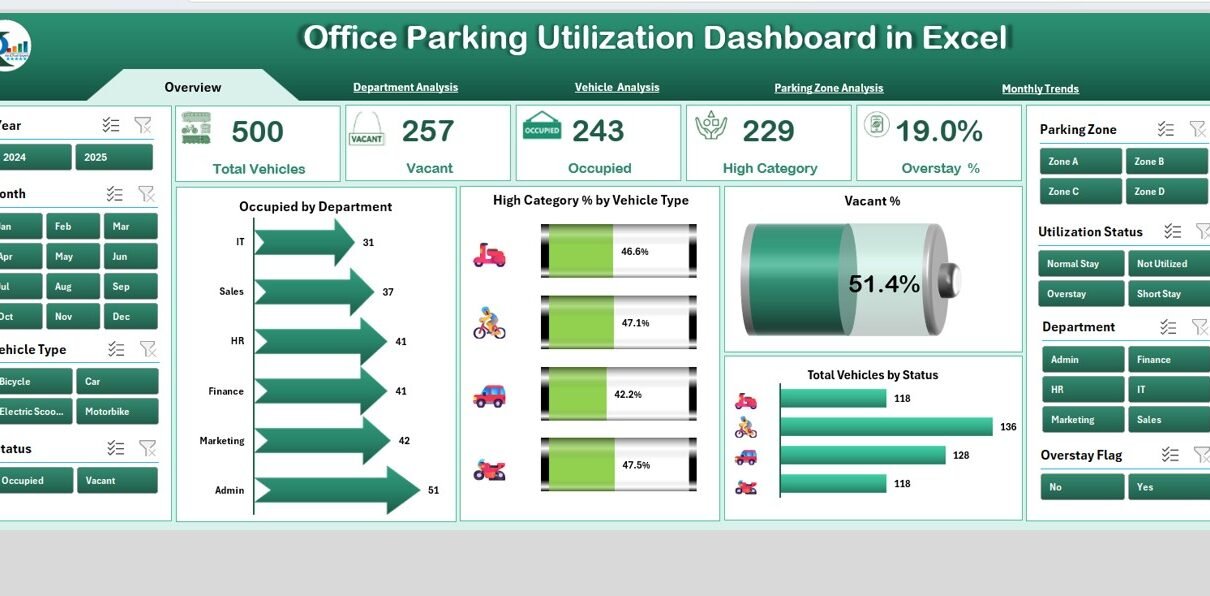
The dashboard consists of five analytical pages along with supporting data sheets for easy management.
Page Navigator
-
Located on the left side for quick access to all analytical pages.
-
Allows smooth switching between Overview, Department Analysis, Vehicle Analysis, Parking Zone Analysis, and Monthly Trends.
Overview Page
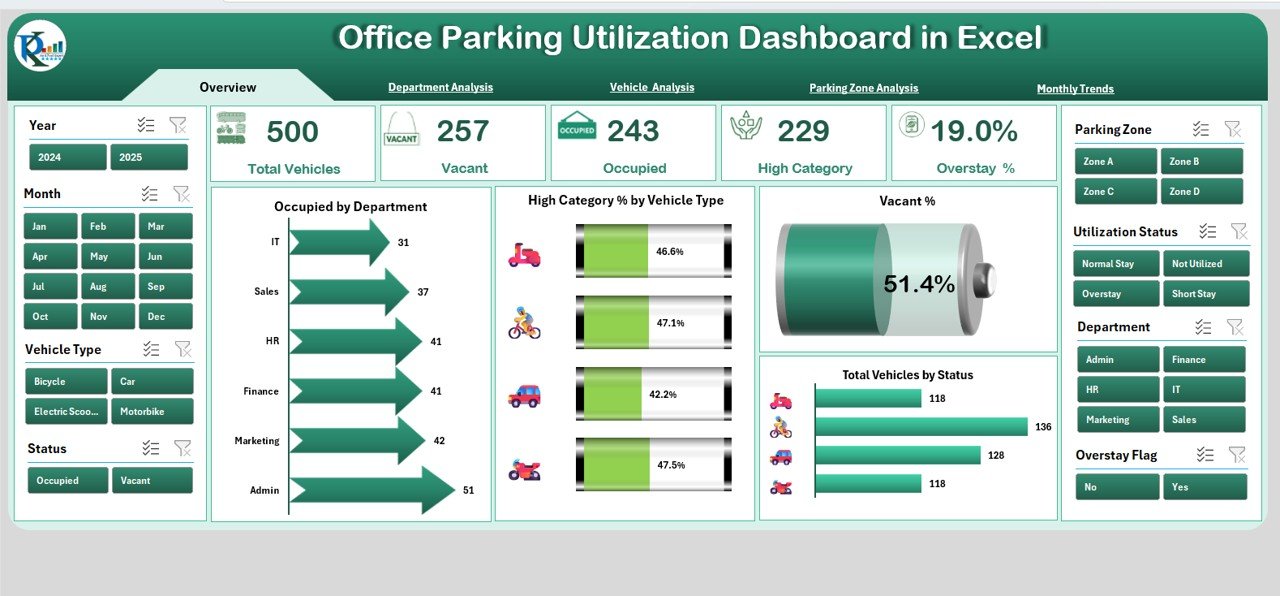
The Overview Page serves as the main dashboard view.
-
Interactive Slicers: Positioned on both left and right sides for quick filtering.
KPI Cards:
- Occupied by Department
- High Category % by Vehicle Type
- Vacant %
- Total Vehicles by Status
-
Charts:
- Occupied by Department (Bar Chart)
- High Category % by Vehicle Type (Donut Chart)
- Vacant % (Gauge or Pie Chart)
- Total Vehicles by Status (Clustered Column)
Department Analysis
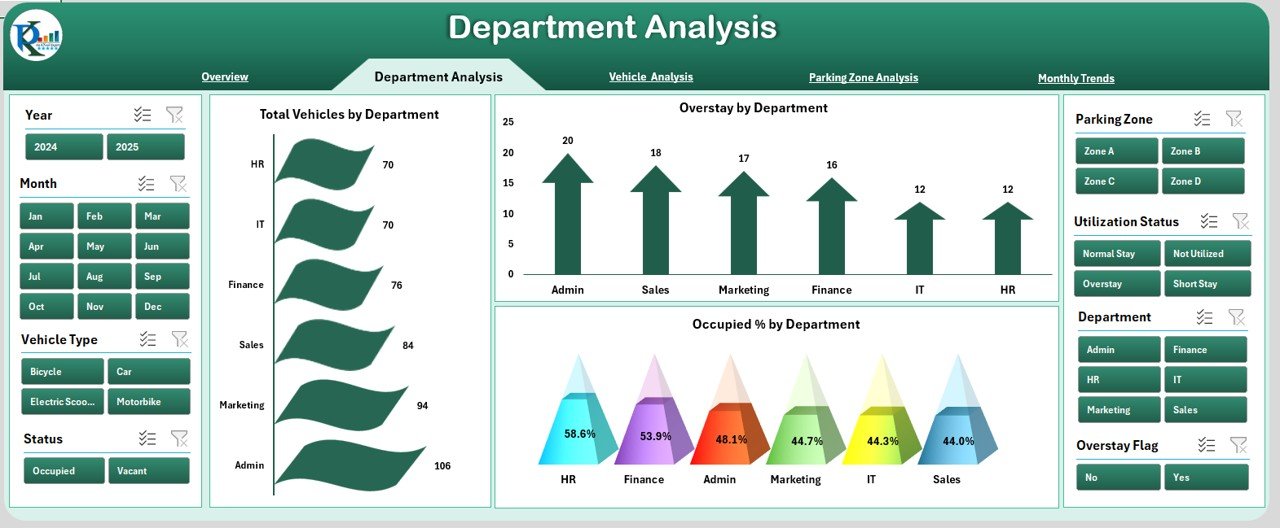
Focused on parking utilization by department.
Charts:
- Total Vehicles by Department
- Overstay by Department
- Occupied % by Department
-
Insights: Identify which departments consume the most parking spaces and track overstay behavior to optimize allocation.
Vehicle Analysis
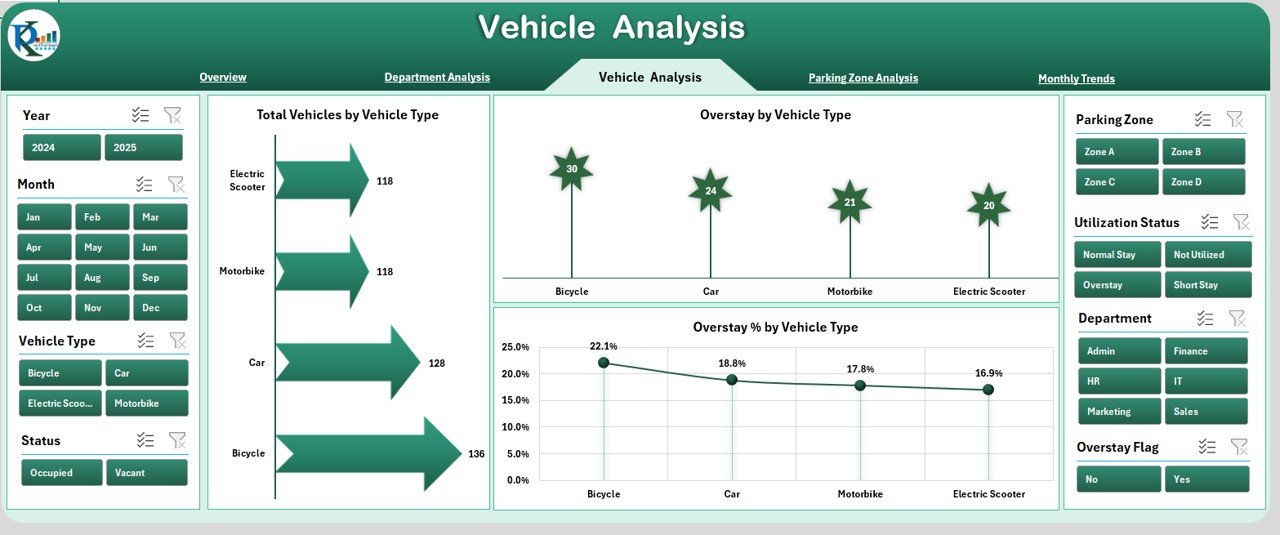
Tracks parking usage by vehicle type.
Charts:
- Total Vehicles by Vehicle Type
- Overstay by Vehicle Type
- Occupied % by Vehicle Type
-
Insights: Helps determine if certain vehicle categories, like SUVs or motorcycles, are dominating space usage.
Parking Zone Analysis
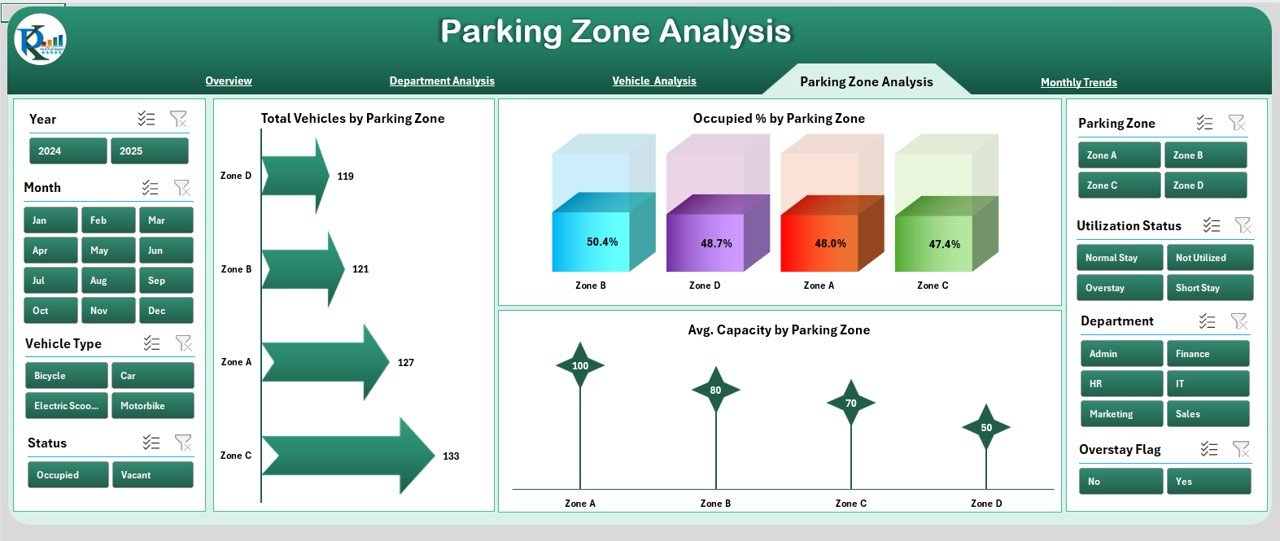
Breaks down occupancy by parking area.
Charts:
- Total Vehicles by Parking Zone
- Overstay by Parking Zone
- Occupied % by Parking Zone
-
Insights: Useful for planning expansions, reallocating spaces, and managing high-demand zones.
Click to Purchases Office Parking Utilization Dashboard in Excel
Monthly Trends
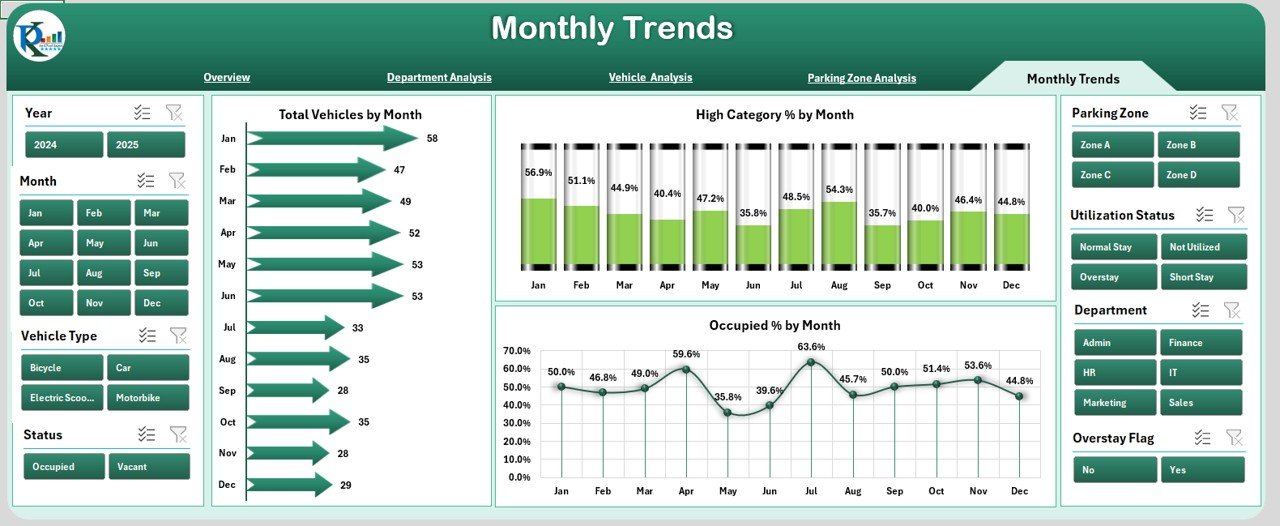
Reveals how parking demand changes over time.
Charts:
- Total Vehicles by Month
- High Category % by Month
- Occupied % by Month
-
Insights: Detect seasonal patterns, project future demand, and plan accordingly.
Data Sheet
-
Contains all raw parking data.
-
Supports the visualizations and calculations in the dashboard.
-
Can be updated manually or via linked data sources.
Support Sheet
-
Holds reference lists (e.g., department names, vehicle categories, parking zones).
-
Used for dropdown menus and slicers to maintain data accuracy.
Why Every Office Needs a Parking Utilization Dashboard
Parking management might not seem like a top priority — until it becomes a problem. Wasted spaces, disputes over parking allocation, and insufficient visitor spots can impact employee satisfaction and operational efficiency.
A well-structured dashboard ensures that parking policies are data-driven, not guesswork.
Advantages of the Office Parking Utilization Dashboard in Excel
✅ Easy to Use: No coding or complex software required — open in Excel and start analyzing.
✅ Real-Time Insights: Quickly identify overused or underused areas.
✅ Improved Planning: Allocate spaces based on actual demand patterns.
✅ Cost Efficiency: Reduce the need for unnecessary expansions by optimizing current usage.
✅ Employee Satisfaction: Ensure fair allocation and availability of parking spots.
✅ Data-Driven Decisions: Use historical trends to plan for peak demand periods.
How to Use the Dashboard Effectively
-
Collect Accurate Data
Record daily vehicle entries, exits, and durations. -
Update the Data Sheet
Enter or import your parking data into the Data Sheet. -
Use Filters and Slicers
Narrow down insights by department, vehicle type, or date range. -
Analyze Patterns
Identify recurring overstay issues or vacant percentages. -
Take Action
Adjust parking policies, reassign spaces, or modify visitor rules.
Opportunities for Improvement in Parking Utilization
-
Automated Data Collection: Integrate sensors or access control systems to feed live data into the dashboard.
-
Visitor Parking Tracking: Add dedicated sections for visitor space monitoring.
-
Overstay Alerts: Implement conditional formatting to highlight prolonged usage.
-
Zone Optimization: Reallocate low-usage zones to high-demand areas.
-
Sustainability Tracking: Add EV (electric vehicle) usage and charging station occupancy metrics.
Best Practices for Using the Office Parking Utilization Dashboard
-
Keep Data Updated Daily – Outdated data leads to poor decisions.
-
Review Monthly Trends – Seasonal variations can impact parking needs.
-
Train Staff – Ensure those responsible for updating data know the process.
-
Focus on Problem Areas First – Address overstay zones or high vacancy areas before expanding capacity.
-
Use Color Coding – Highlight key KPIs for quick visual understanding.
-
Integrate with Security Logs – Cross-check parking activity with security records for accuracy.
Conclusion
The Office Parking Utilization Dashboard in Excel is more than just a reporting tool — it’s a decision-making assistant. By providing clear, actionable insights, it enables facility managers to optimize parking allocation, reduce wasted space, and improve overall efficiency.
With a structured approach and consistent data entry, businesses can ensure that every parking space is put to good use, supporting both operational goals and employee satisfaction.
Frequently Asked Questions (FAQs)
1. Can I customize the dashboard for my office size?
Yes. You can adjust the department names, vehicle types, and parking zones in the Support Sheet to match your organization.
2. Do I need Excel skills to use this dashboard?
Basic Excel skills are enough. The dashboard uses ready-made charts and slicers.
3. Can I track visitor parking separately?
Yes. You can add a “Visitor” category in the Data Sheet to filter their usage.
4. How often should I update the data?
Daily updates provide the most accurate insights, but weekly updates work for smaller offices.
5. Can this dashboard integrate with automated parking systems?
Yes. If your parking system can export data to Excel or CSV, you can link it to the dashboard.
6. Will this dashboard work on Excel Online?
Yes, but for full functionality, including slicers, Excel Desktop is recommended.
Visit our YouTube channel to learn step-by-step video tutorials