In today’s business world, sustainability no longer remains a choice. Instead, it has become a responsibility. Organizations across industries now focus on reducing energy usage, managing resources efficiently, and improving ESG performance. However, tracking sustainability data manually often creates confusion, delays, and errors. Therefore, companies need a structured, visual, and easy-to-use solution.
That is exactly where an Office Sustainability Dashboard in Excel plays a vital role.
In this detailed article, you will learn what an Office Sustainability Dashboard in Excel is, why organizations need it, how it works, its sheet structure, key metrics, advantages, best practices, and frequently asked questions. Moreover, the language stays simple, practical, and easy to understand, so anyone can implement it without technical complexity.
Click to buy Office Sustainability Dashboard in Excel
What Is an Office Sustainability Dashboard in Excel?
An Office Sustainability Dashboard in Excel is a ready-to-use analytical tool that helps organizations monitor, analyze, and improve sustainability performance across offices, departments, regions, and workspaces.
Instead of working with scattered spreadsheets, emails, and manual reports, this dashboard consolidates all sustainability data into a single Excel file. As a result, decision-makers can track energy usage, water consumption, seat utilization, waste generation, and emissions in one place.
Because Excel supports formulas, pivot tables, slicers, and charts, this dashboard delivers insights without requiring advanced software or coding skills.
Why Do Organizations Need an Office Sustainability Dashboard?
Modern offices consume energy, water, and other resources daily. At the same time, businesses face increasing pressure to meet sustainability goals, ESG reporting standards, and cost-reduction targets. Therefore, organizations need clear visibility into resource usage.
An Office Sustainability Dashboard helps because it:
- Tracks sustainability KPIs in real time
- Highlights inefficiencies across departments and locations
- Supports data-driven sustainability initiatives
- Improves compliance with ESG and environmental goals
- Reduces operational and energy costs
Moreover, Excel-based dashboards allow teams to collaborate easily and update data regularly without extra tools.
How Does an Office Sustainability Dashboard in Excel Work?
The dashboard works by pulling structured sustainability data into Excel tables. After that, formulas, pivot tables, and charts transform raw data into meaningful visuals.
You can update the dashboard simply by adding new records. Consequently, all charts and KPIs refresh automatically. Because Excel supports filters and slicers, users can analyze performance by department, region, building type, or time period instantly.
Most importantly, this dashboard focuses on clarity and usability rather than complexity.
What Sheets Are Included in the Office Sustainability Dashboard in Excel?
This ready-to-use Office Sustainability Dashboard includes multiple structured sheet tabs. Each sheet focuses on a specific area of sustainability analysis. Let us explore them in detail.
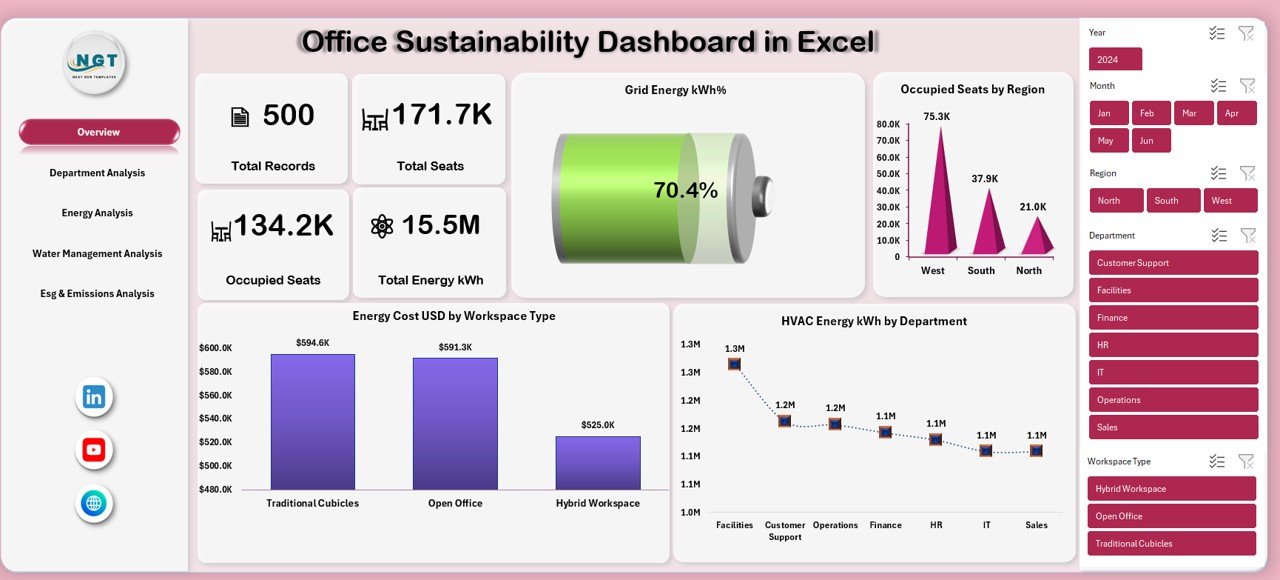
Overview Sheet: How Can You Get a Quick Sustainability Snapshot?
The Overview sheet acts as the main landing page of the dashboard. It provides a high-level summary of sustainability performance across the organization.
Key Metrics Displayed on the Overview Sheet
- Total Records
Shows the total number of sustainability data entries captured. - Total Seats
Displays the total seating capacity across offices. - Occupied Seats
Highlights actual seat utilization. - Total Energy (kWh)
Shows total energy consumption across all locations. - Grid Energy (kWh%)
Indicates dependency on grid energy sources.
Key Charts in the Overview Sheet
- Energy Cost USD by Workspace Type
Helps identify which workspace types consume more energy costs. - HVAC Energy kWh by Department
Highlights HVAC-related energy usage by department. - Occupied Seats by Region
Shows regional seat utilization patterns.
Because this sheet summarizes key metrics visually, leaders can understand sustainability performance within seconds.
Click to buy Office Sustainability Dashboard in Excel
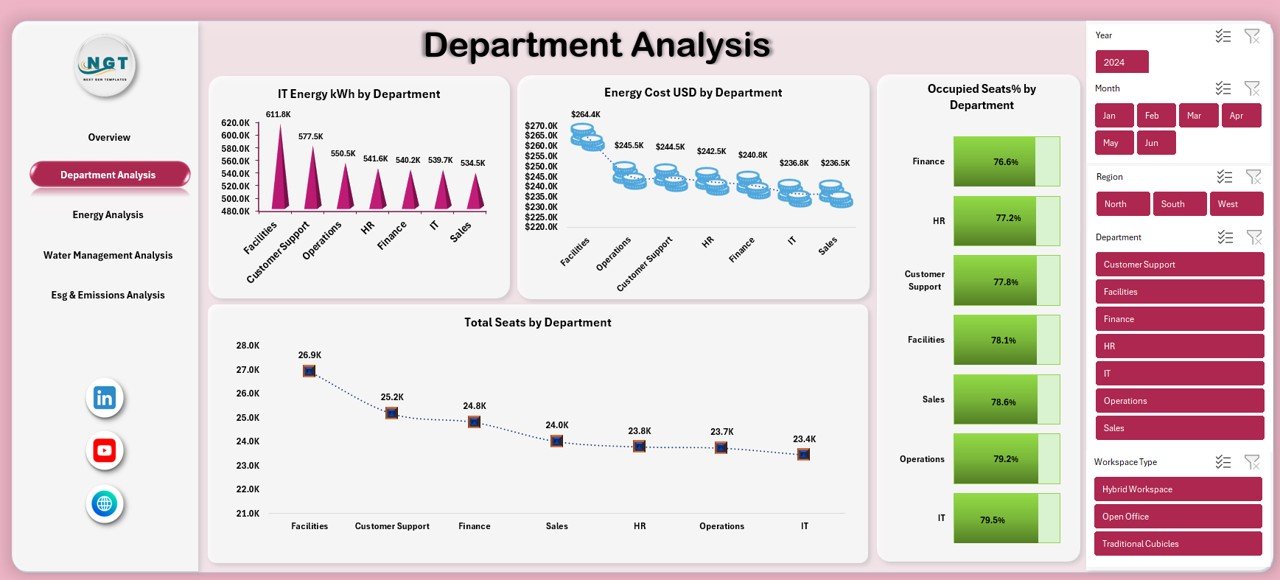
Department Analysis Sheet: How Do Departments Impact Sustainability?
The Department Analysis sheet focuses on comparing sustainability metrics across departments.
Key Insights from Department Analysis
- IT Energy kWh by Department
Shows IT-related energy consumption for each department. - Energy Cost USD by Department
Highlights departments with higher energy spending. - Total Seats by Department
Displays allocated seating per department. - Occupied Seats % by Department
Reveals how efficiently departments use allocated seating.
As a result, management can identify departments that need efficiency improvements or space optimization.
Click to buy Office Sustainability Dashboard in Excel
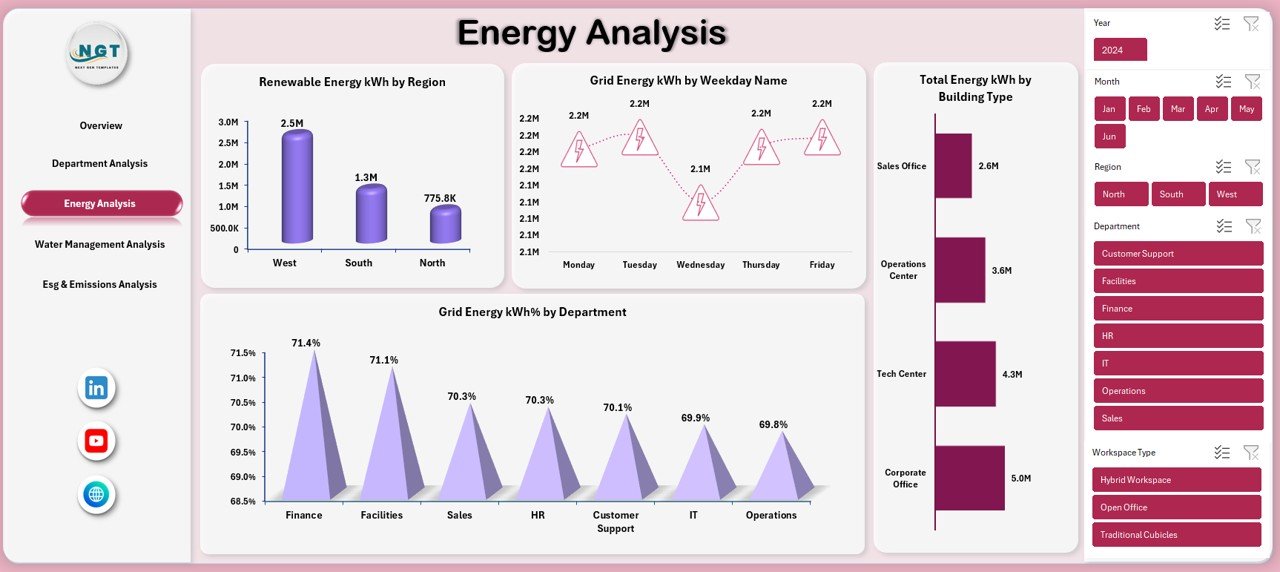
Energy Analysis Sheet: How Can You Track Energy Usage Effectively?
The Energy Analysis sheet dives deeper into energy sources and consumption patterns.
Key Energy Metrics Covered
- Renewable Energy kWh by Region
Shows how much renewable energy each region consumes. - Grid Energy kWh by Weekday Name
Helps analyze daily energy usage trends. - Grid Energy kWh % by Department
Highlights departmental reliance on grid energy. - Total Energy kWh by Building Type
Compares energy consumption across building categories.
Because energy costs form a major part of operational expenses, this sheet supports better energy planning and sustainability initiatives.
Click to buy Office Sustainability Dashboard in Excel
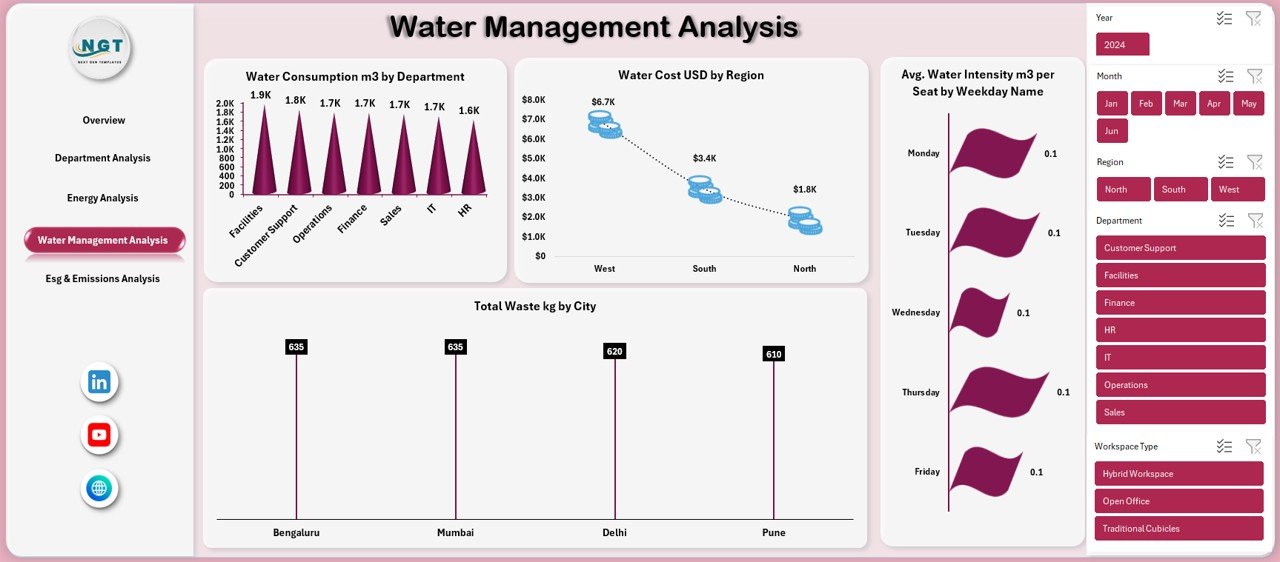
Water Management Analysis Sheet: How Can Offices Reduce Water Usage?
Water plays a critical role in office sustainability. Therefore, the Water Management Analysis sheet focuses on tracking water consumption and costs.
Key Water and Waste Metrics
- Water Consumption (m³) by Department
Shows water usage patterns across departments. - Water Cost USD by Region
Highlights regions with higher water costs. - Total Waste (kg) by City
Tracks waste generation by location.
With these insights, organizations can implement water-saving measures and waste reduction programs more effectively.
Click to buy Office Sustainability Dashboard in Excel
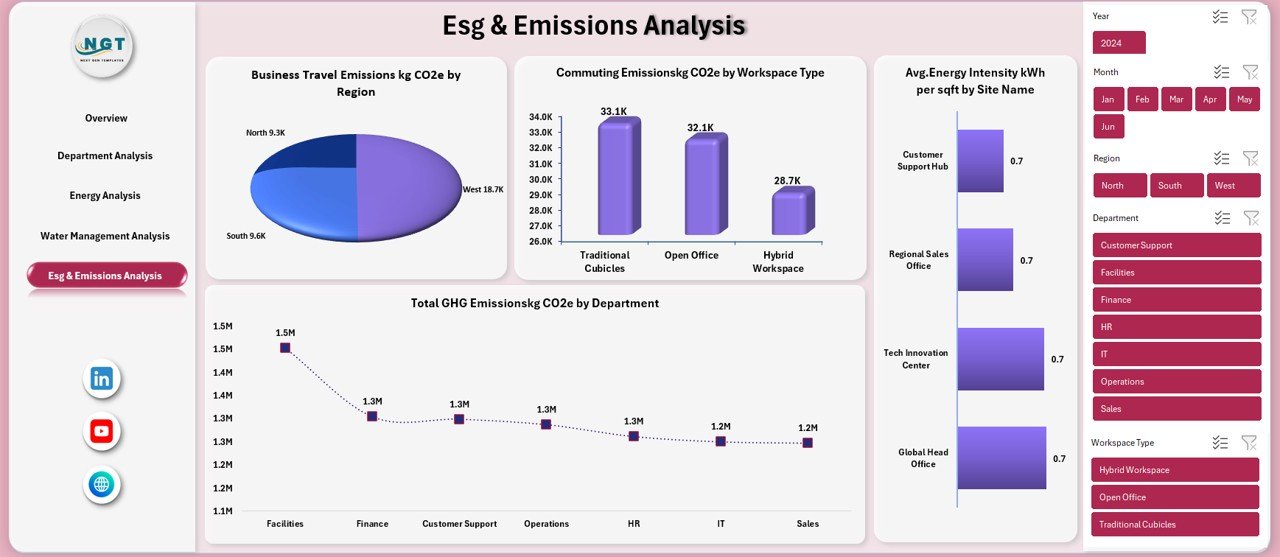
ESG & Emissions Analysis Sheet: How Can You Measure Environmental Impact?
The ESG & Emissions Analysis sheet supports sustainability reporting and environmental impact tracking.
Key ESG and Emissions Metrics
- Business Travel Emissions (kg CO₂e) by Region
Shows emissions caused by official travel. - Commuting Emissions (kg CO₂e) by Workspace Type
Highlights emissions related to employee commuting. - Total GHG Emissions (kg CO₂e) by Department
Displays greenhouse gas emissions per department. - Average Energy Intensity (kWh per sqft) by Site Name
Measures energy efficiency of office spaces.
Because ESG reporting requires accurate data, this sheet helps organizations meet compliance and sustainability targets confidently.
Click to buy Office Sustainability Dashboard in Excel
What Are the Key KPIs Tracked in an Office Sustainability Dashboard?
An Office Sustainability Dashboard in Excel typically tracks the following KPI categories:
- Energy consumption and cost
- Seat utilization and occupancy rate
- Renewable vs grid energy usage
- Water consumption and cost
- Waste generation
- Carbon and GHG emissions
- Energy intensity metrics
Together, these KPIs provide a complete picture of office sustainability performance.
Advantages of Office Sustainability Dashboard in Excel
Using an Office Sustainability Dashboard in Excel offers multiple advantages for organizations of all sizes.
- Centralized Sustainability Data
The dashboard stores all sustainability metrics in one place. Therefore, teams no longer need to search across multiple files.
- Easy to Use and Customize
Excel allows easy customization. You can add new KPIs, charts, or departments without technical skills.
- Cost-Effective Solution
Unlike expensive BI tools, Excel dashboards reduce software and implementation costs.
- Improved Decision-Making
Visual insights help leaders make faster, data-driven sustainability decisions.
- Supports ESG and Compliance Reporting
The dashboard simplifies ESG data tracking and reporting requirements.
- Real-Time Updates
When you update data, charts refresh instantly. As a result, users always see the latest insights.
Best Practices for the Office Sustainability Dashboard in Excel
To maximize value, organizations should follow best practices while using this dashboard.
- Maintain Clean and Accurate Data
Always validate data before entering it. Accurate data ensures reliable insights.
- Update Data Regularly
Schedule weekly or monthly updates to keep insights relevant.
- Use Standard Units and Definitions
Standardize units like kWh, m³, and kg CO₂e across the dashboard.
- Focus on Actionable KPIs
Track KPIs that directly support sustainability goals and cost reduction.
- Use Filters and Slicers Effectively
Enable users to analyze data by department, region, or time period.
- Review Trends, Not Just Totals
Analyze trends over time to identify improvement opportunities.
Who Can Benefit from an Office Sustainability Dashboard in Excel?
This dashboard serves a wide range of users, including:
- Facility managers
- Sustainability and ESG teams
- Operations managers
- Finance and cost control teams
- Corporate leadership
- Real estate and workplace planners
Because the dashboard uses Excel, anyone with basic spreadsheet knowledge can use it effectively.
How Does This Dashboard Support Sustainability Goals?
The Office Sustainability Dashboard supports sustainability by:
- Identifying energy-saving opportunities
- Improving seat and space utilization
- Reducing water and waste consumption
- Lowering carbon and GHG emissions
- Supporting long-term ESG strategies
As a result, organizations can align operations with environmental responsibility and cost efficiency.
Conclusion: Why Should You Use an Office Sustainability Dashboard in Excel?
An Office Sustainability Dashboard in Excel provides a powerful yet simple way to monitor, analyze, and improve sustainability performance. Because it combines energy, water, waste, seat utilization, and emissions data into one visual platform, organizations gain clarity and control.
Moreover, Excel-based dashboards remain flexible, affordable, and easy to maintain. Therefore, businesses of all sizes can adopt them without complexity. By using this dashboard, organizations move one step closer to a greener, smarter, and more sustainable workplace.
Frequently Asked Questions (FAQs)
- What is an Office Sustainability Dashboard in Excel used for?
An Office Sustainability Dashboard in Excel helps track energy usage, water consumption, emissions, seat utilization, and ESG metrics across offices.
- Do I need advanced Excel skills to use this dashboard?
No. Basic Excel knowledge is enough to use and update the dashboard.
- Can I customize the dashboard for my organization?
Yes. You can add departments, regions, KPIs, and charts easily.
- How often should I update sustainability data?
You should update data weekly or monthly, depending on reporting needs.
- Does this dashboard support ESG reporting?
Yes. The dashboard tracks emissions, energy intensity, and sustainability KPIs required for ESG reporting.
- Is Excel suitable for sustainability dashboards?
Yes. Excel offers flexibility, affordability, and powerful analysis features suitable for sustainability tracking.
Visit our YouTube channel to learn step-by-step video tutorials
Watch the step-by-step video tutorial:
Click to buy Office Sustainability Dashboard in Excel