Sustainability no longer sits on the side of business strategy. Instead, it drives brand value, investor trust, and operational efficiency. Today, companies must track energy use, water consumption, emissions, and workspace efficiency in real time. However, many offices still rely on scattered Excel sheets. As a result, leaders miss insights. They struggle to reduce waste. Moreover, they fail to align operations with ESG goals.So, how can you track energy usage, occupancy, water consumption, waste, and emissions in one structured system?You need an Office Sustainability Dashboard in Power BI.In this detailed guide, you will learn:
- What an Office Sustainability Dashboard in Power BI
- Why modern offices need it
- Complete explanation of all 5 dashboard pages
- Key sustainability KPIs you should track
- Advantages of the Office Sustainability Dashboard in Power BI
- Best Practices for the Office Sustainability Dashboard in Power BI
- Frequently Asked Questions with Answers
Click to buy Office Sustainability Dashboard in Power BI
What Is an Office Sustainability Dashboard in Power BI?
An Office Sustainability Dashboard in Power BI is a ready-to-use ESG performance tracking tool. It helps organizations monitor energy usage, occupancy, water management, and carbon emissions across regions, departments, and workspaces.
Instead of reviewing multiple files, decision-makers can:
- Track total energy consumption (kWh)
- Monitor grid vs renewable energy share
- Analyze water consumption and waste
- Measure occupancy efficiency
- Review emissions from business travel
- Evaluate energy intensity per square foot
Moreover, Power BI makes the data interactive. Therefore, users can apply slicers, filter by region or department, and instantly see updated results.
Why Do Modern Offices Need a Sustainability Dashboard?
Today, sustainability influences investor confidence, regulatory compliance, and employee engagement. Therefore, companies must monitor environmental metrics consistently.
Without a structured dashboard:
- Energy costs increase unnoticed
- Water wastage continues
- Grid energy dependency remains high
- Carbon emissions exceed targets
- Departments fail to meet ESG goals
However, with a centralized Power BI dashboard, leadership teams can act quickly. They can compare regions. They can identify high-cost departments. Furthermore, they can plan reduction strategies with clarity.
Pages Included in the Office Sustainability Dashboard in Power BI
This dashboard includes 5 powerful pages. Each page focuses on a specific sustainability area.
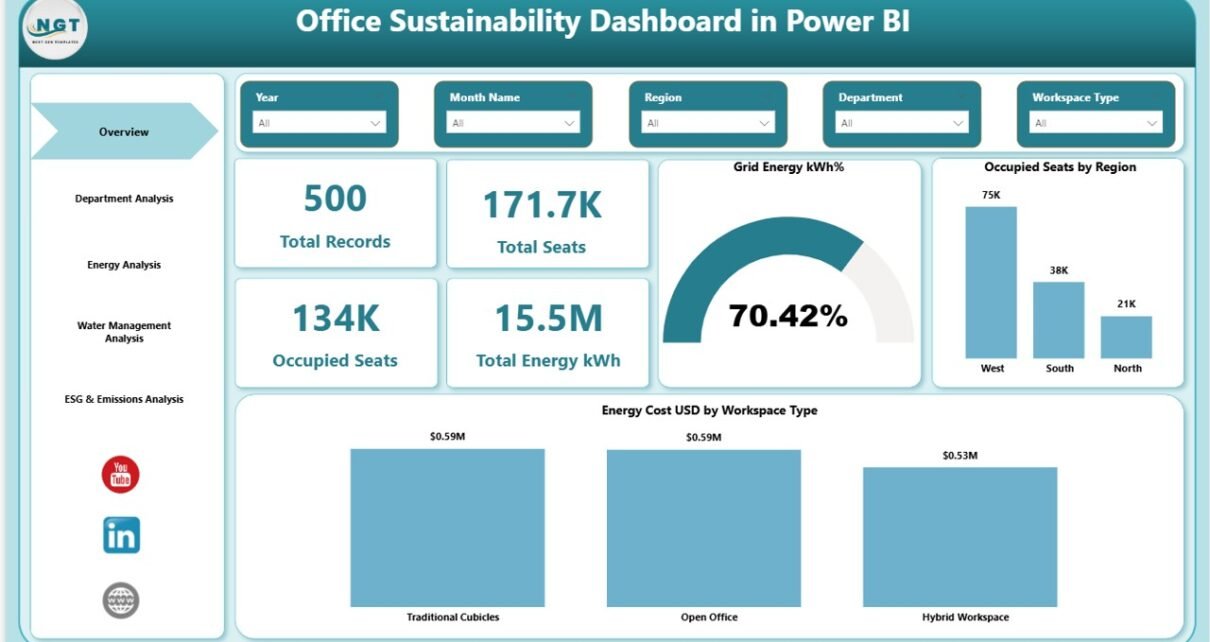
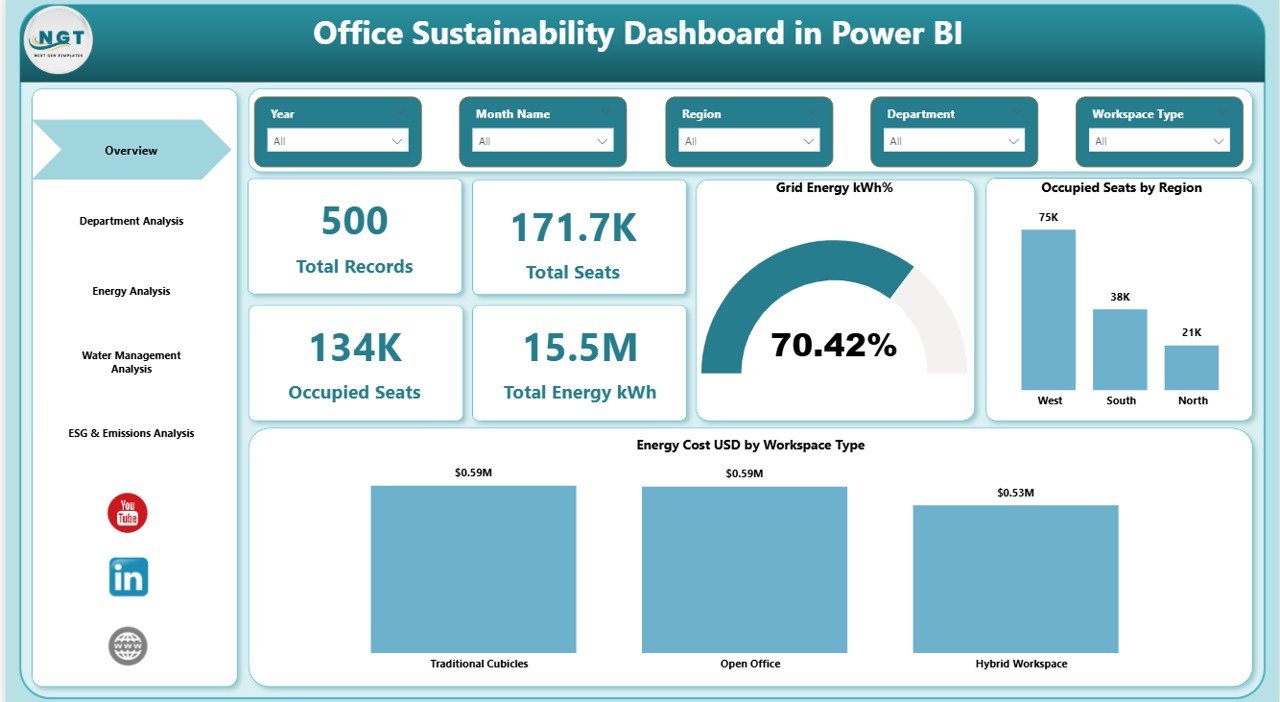
Overview Page – Your Sustainability Snapshot
The Overview Page acts as the command center. It gives leadership teams a quick performance snapshot.
KPI Cards on Overview Page
- Total Records
- Total Seats
- Occupied Seats
- Total Energy (kWh)
These cards instantly show performance volume.
Additional Visuals
- Grid Energy kWh %
- Occupied Seats by Region
- Energy Cost (USD) by Workspace Type
With slicers available on the top, users can filter by:
- Region
- Department
- Workspace Type
- Time Period
As a result, managers can instantly compare energy usage across locations.
Click to buy Office Sustainability Dashboard in Power BI
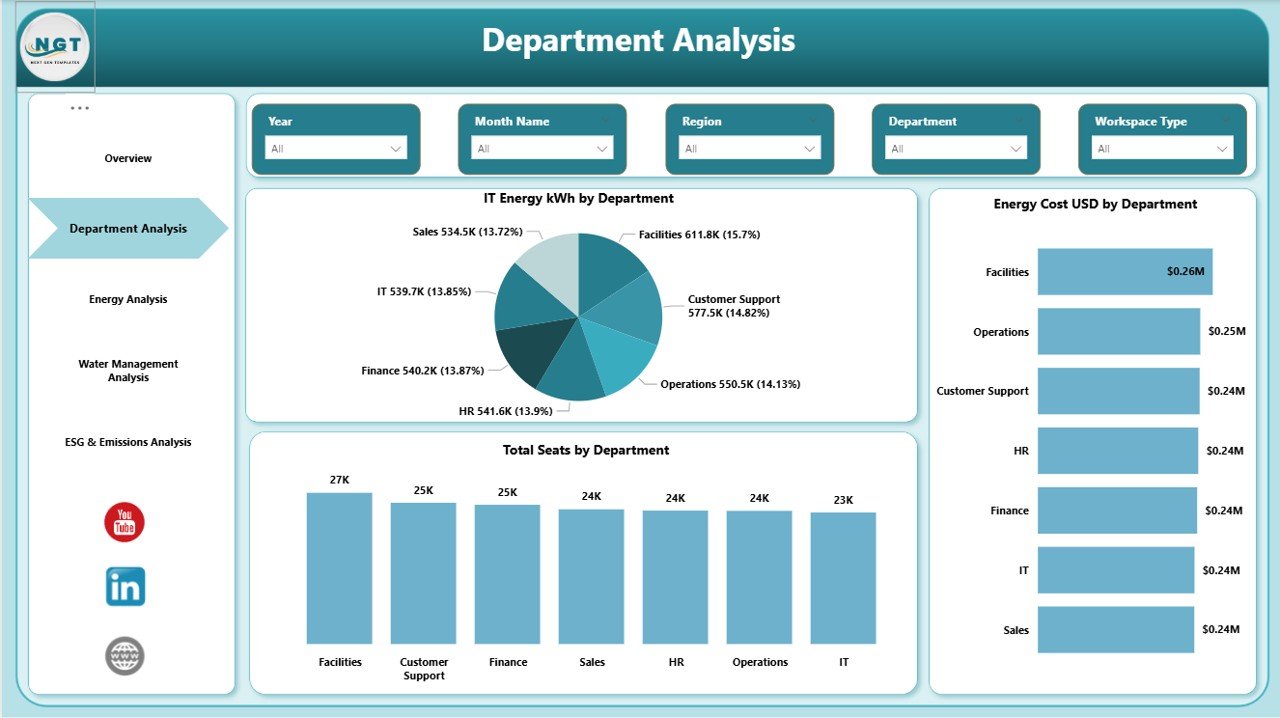
Department Analysis – Which Department Consumes More?
The Department Analysis page focuses on internal comparison.
Charts Included
- Energy kWh by Department
- Energy Cost (USD) by Department
- Total Seats by Department
This page answers important questions:
- Which department uses the highest energy?
- Which department incurs the highest cost?
- Does seat allocation align with energy consumption?
Therefore, sustainability teams can implement department-level reduction targets.
Click to buy Office Sustainability Dashboard in Power BI
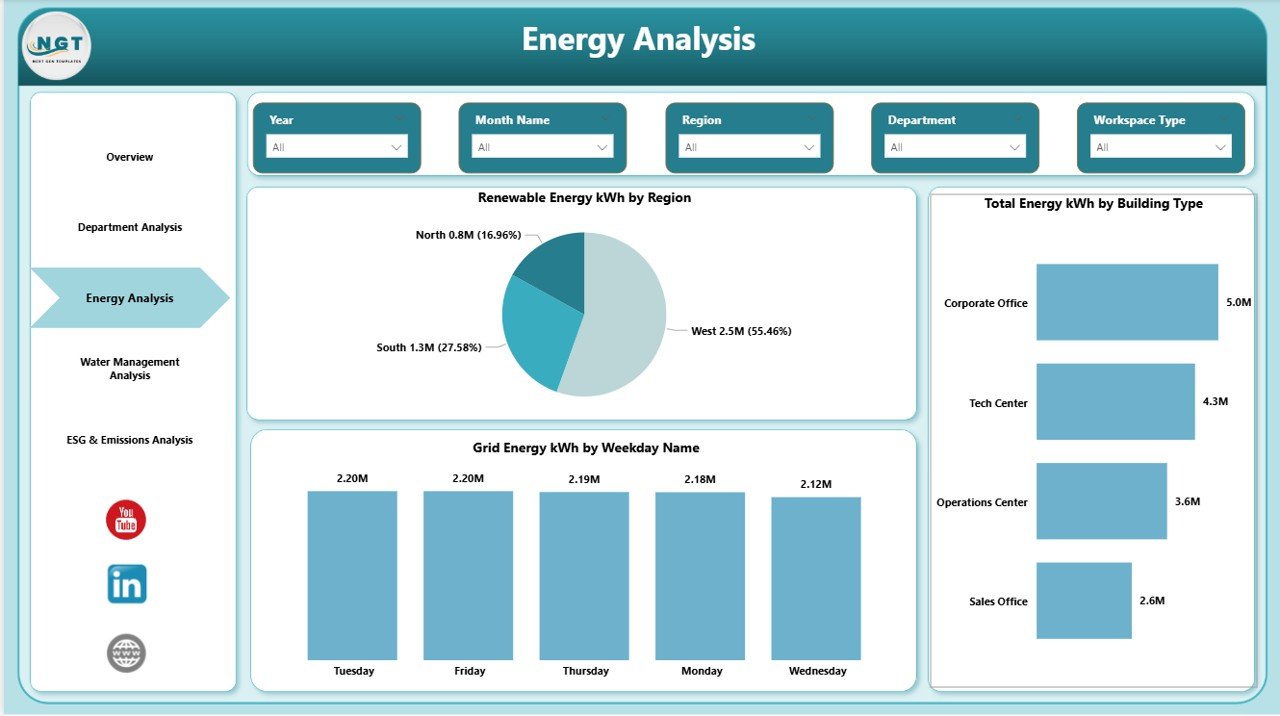
Energy Analysis – Are You Using Renewable Energy Effectively?
Energy management directly impacts ESG performance. Therefore, this page analyzes energy sources and patterns.
Charts Included
- Renewable Energy (kWh) by Region
- Total Energy (kWh) by Region
- Grid Energy (kWh) by Weekday Name
This page helps you:
- Measure renewable adoption
- Reduce grid dependency
- Identify peak consumption weekdays
As a result, companies can schedule energy-intensive tasks efficiently.
Click to buy Office Sustainability Dashboard in Power BI
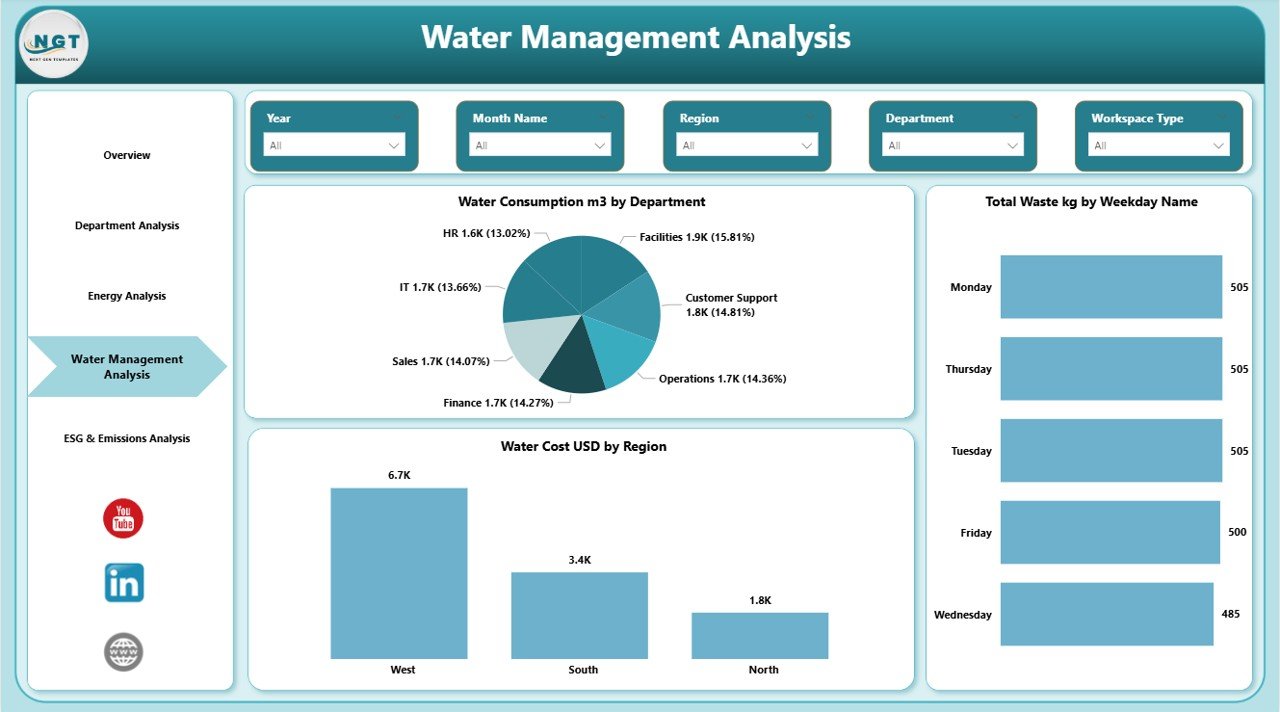
Water Management Analysis – Are You Reducing Water Waste?
Water management plays a critical role in sustainability reporting.
Charts Included
- Water Consumption (m3) by Department
- Total Waste (kg) by Weekday Name
- Water Cost (USD) by Region
This page allows managers to:
- Compare department-level water usage
- Identify high waste generation days
- Monitor regional water cost trends
Therefore, leadership teams can plan reduction campaigns.
Click to buy Office Sustainability Dashboard in Power BI
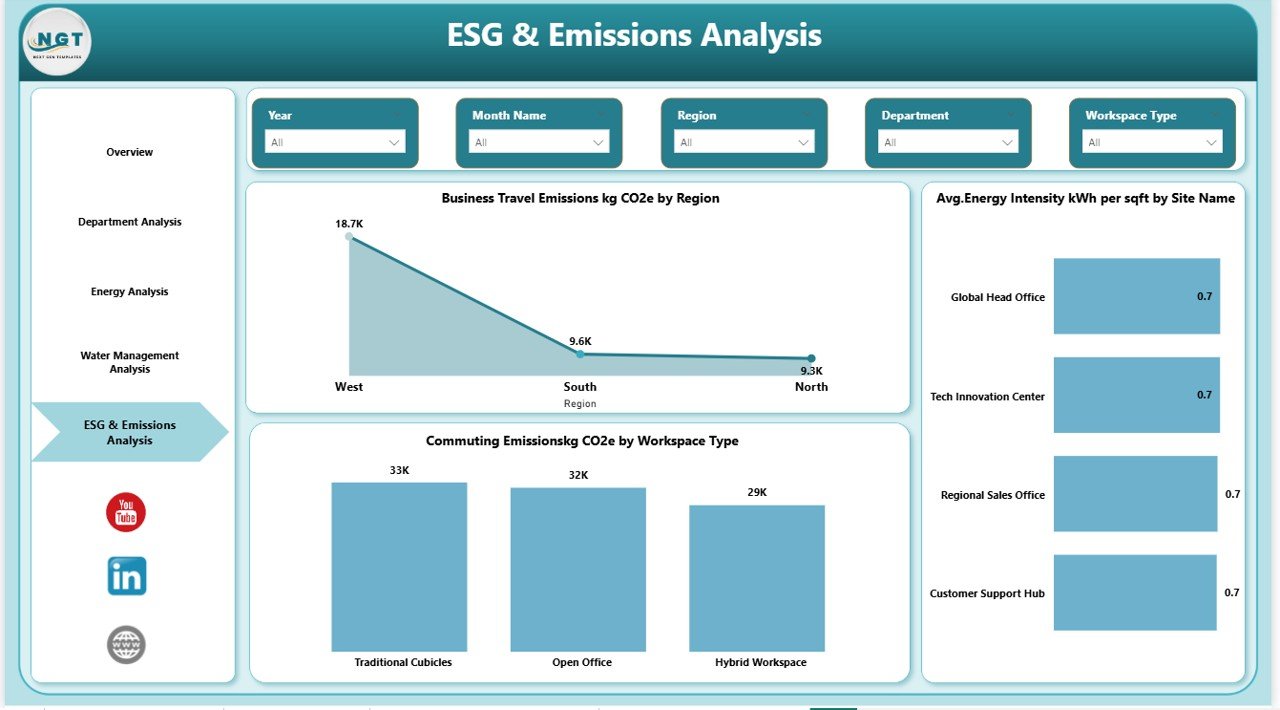
ESG & Emissions Analysis – Are You Lowering Carbon Footprint?
ESG performance drives long-term business growth. Therefore, this final page focuses on carbon and efficiency metrics.
Charts Included
- Business Travel Emissions (kg CO2) by Region
- Average Energy Intensity (kWh per sqft) by Site Name
This page helps companies:
- Monitor travel emissions
- Evaluate site efficiency
- Compare energy intensity across offices
Consequently, sustainability leaders can set clear emission reduction goals.
Click to buy Office Sustainability Dashboard in Power BI
Important KPIs for Office Sustainability Dashboard
You should track structured KPIs such as:
- Total Energy Consumption (kWh)
- Renewable Energy %
- Grid Energy %
- Energy Cost per Workspace
- Water Consumption (m3)
- Waste Generated (kg)
- Occupancy Rate %
- Energy Intensity (kWh per sqft)
- Business Travel Emissions (kg CO2)
These KPIs provide both operational and ESG insights.
Advantages of Office Sustainability Dashboard in Power BI
Implementing this dashboard offers multiple benefits.
Centralized Monitoring
You can monitor energy, water, waste, and emissions in one place.
Better Cost Control
You can identify high energy cost departments quickly.
Stronger ESG Reporting
You can present accurate sustainability reports to stakeholders.
Improved Decision-Making
You can compare regions, departments, and workspaces instantly.
Data-Driven Sustainability Goals
You can set measurable targets instead of vague goals.
Best Practices for the Office Sustainability Dashboard in Power BI
To maximize results, follow these best practices:
Update Data Regularly
Always refresh energy and water data monthly.
Define Clear KPI Targets
Set clear reduction percentages for each department.
Use Consistent Units
Maintain consistent units such as kWh, m3, kg CO2.
Train Department Heads
Educate managers on reading dashboard insights.
Compare Trends Over Time
Track monthly and yearly comparisons.
Focus on Renewable Adoption
Increase renewable energy share consistently.
How to Implement This Dashboard Successfully?
Follow these steps:
- Collect energy, water, and occupancy data
- Clean and structure the data
- Import into Power BI
- Create relationships between tables
- Build KPI measures using DAX
- Design interactive visuals
- Add slicers for dynamic filtering
- Test with sample scenarios
- Share with stakeholders
Once you implement these steps, your sustainability tracking becomes structured and actionable.
How Does This Dashboard Support ESG Strategy?
This dashboard supports ESG goals by:
- Tracking environmental performance
- Measuring emission reductions
- Monitoring renewable energy adoption
- Supporting sustainability audits
- Improving investor transparency
Therefore, organizations strengthen both operational efficiency and brand reputation.
Conclusion
Sustainability no longer remains optional. Instead, it defines business resilience. Companies must track energy, water, occupancy, and emissions carefully. However, manual tracking slows decision-making.
The Office Sustainability Dashboard in Power BI solves this challenge.
It provides:
- 5 structured analysis pages
- Interactive slicers
- Real-time KPI insights
- Department and region comparisons
- ESG performance monitoring
As a result, leadership teams can reduce waste, lower emissions, and improve efficiency confidently.
If your organization aims to achieve measurable ESG results, then this dashboard provides the clarity you need.
Frequently Asked Questions (FAQs)
- What is an Office Sustainability Dashboard in Power BI?
It is a Power BI reporting tool that tracks energy, water, occupancy, waste, and emissions data.
- Who should use this dashboard?
Sustainability managers, facility managers, ESG teams, and leadership executives can use it.
- Can I track renewable energy separately?
Yes. The Energy Analysis page tracks renewable energy kWh by region.
- Does this dashboard support ESG reporting?
Yes. It supports emission tracking, energy intensity analysis, and sustainability KPIs.
- Can I customize KPIs?
Yes. You can modify measures and add additional sustainability KPIs.
- How often should I update the data?
You should update the data monthly for accurate reporting.
Visit our YouTube channel to learn step-by-step video tutorials
Watch the step-by-step video tutorial:
Click to buy Office Sustainability Dashboard in Power BI