In today’s fast-paced e-commerce environment, online marketplaces play a critical role in driving revenue and customer engagement. Businesses need a way to track their performance, identify trends, and make data-driven decisions efficiently. This is where an Online Marketplaces Dashboard in Power BI becomes invaluable. With interactive visuals, slicers, and advanced analytics, this dashboard empowers organizations to understand their marketplace performance at a glance.
In this article, we will explore the features, benefits, advantages, best practices, and frequently asked questions about Online Marketplaces Dashboard in Power BI.
Click to Purchases Online Marketplaces Dashboard in Power BI
What is an Online Marketplaces Dashboard in Power BI?
A Power BI dashboard is a visual interface that consolidates key performance indicators (KPIs), metrics, and data insights into interactive charts and reports. The Online Marketplaces Dashboard is specifically designed to monitor performance across multiple online selling platforms, providing real-time insights into sales, costs, profits, and customer behavior.
Using this dashboard, decision-makers can analyze data from various marketplaces, track monthly trends, and identify opportunities for growth. Unlike traditional reporting methods, Power BI dashboards are highly interactive, making data exploration intuitive and accessible.
Key Features of the Online Marketplaces Dashboard in Power BI
This dashboard is divided into five main pages, each focusing on specific performance metrics and insights.
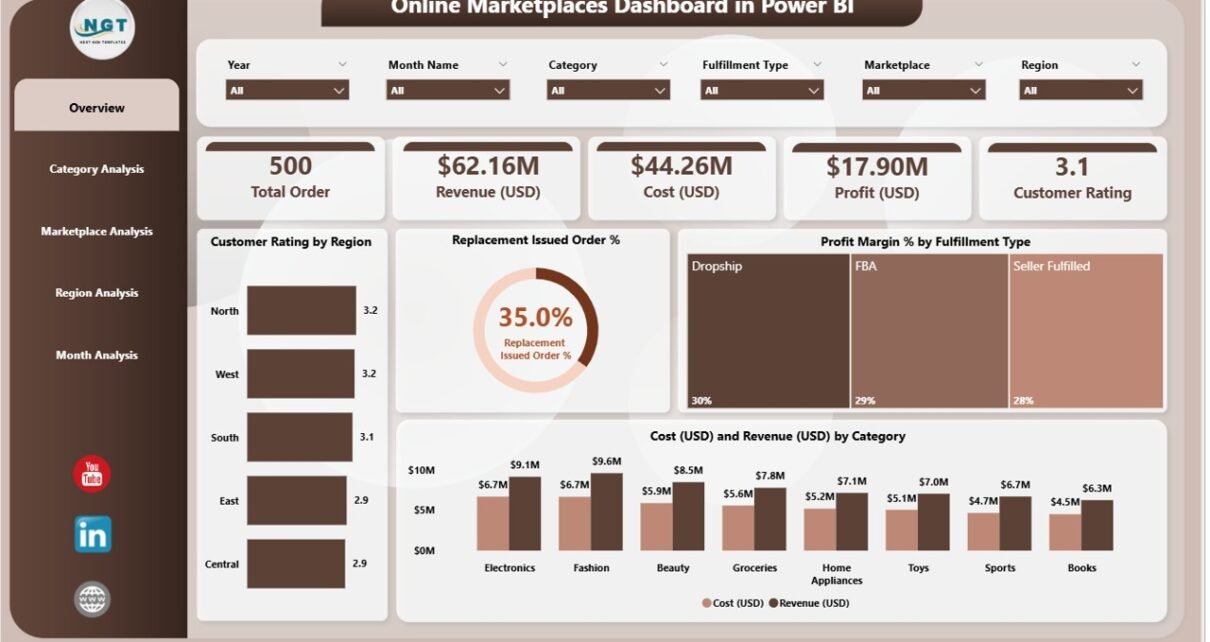
1. Overview Page
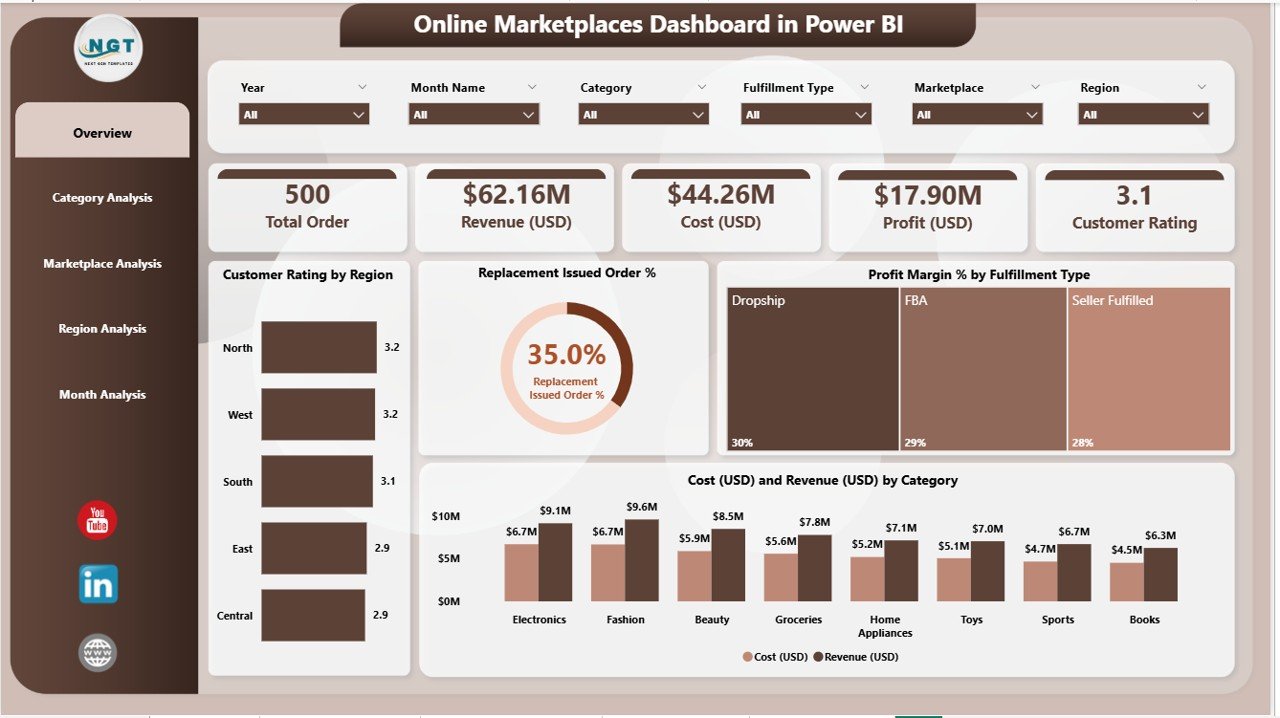
The Overview Page serves as the main hub of the dashboard. It provides a high-level view of marketplace performance with slicers to filter data by regions, categories, or marketplaces. Key components include:
-
4 Cards highlighting essential KPIs such as total revenue, total cost, profit margins, and order volume.
-
Customer Rating by Region Chart: Visualizes customer satisfaction levels across different regions.
-
Replace Issued Order % Chart: Tracks the percentage of orders that required replacements.
-
Profit Margin % by Fulfillment Type Chart: Helps identify which fulfillment methods are more profitable.
-
Cost (USD) and Revenue (USD) by Category Chart: Compares costs and revenue across different product categories.
This page provides a comprehensive snapshot of overall performance and highlights areas that require attention.
2. Category Analysis Page
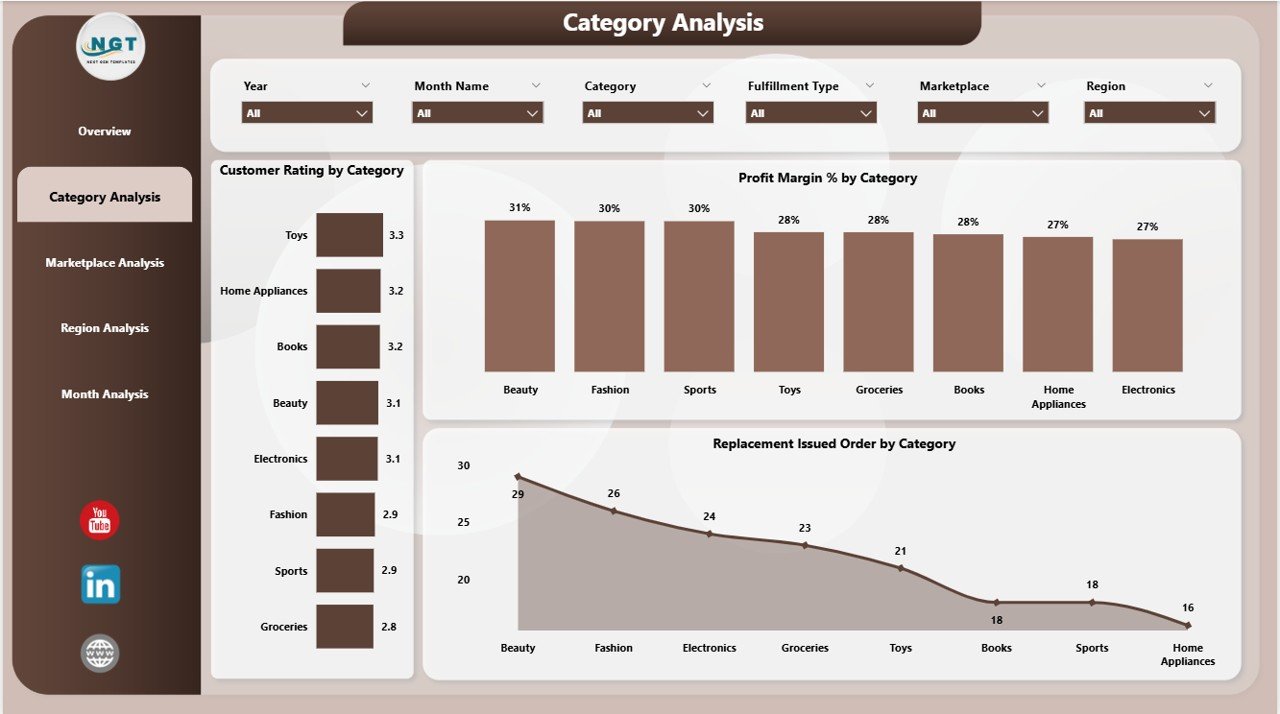
The Category Analysis Page focuses on product-level performance, allowing businesses to understand which categories drive revenue and profit. Key features include:
-
Customer Rating by Category Chart: Identifies categories with high or low customer satisfaction.
-
Replace Issued Order by Category Chart: Monitors replacement trends at a category level.
-
Profit Margin % by Category Chart: Evaluates which product categories contribute most to profitability.
This page enables companies to optimize inventory, improve customer experience, and focus on profitable product lines.
Click to Purchases Online Marketplaces Dashboard in Power BI
3. Marketplace Analysis Page
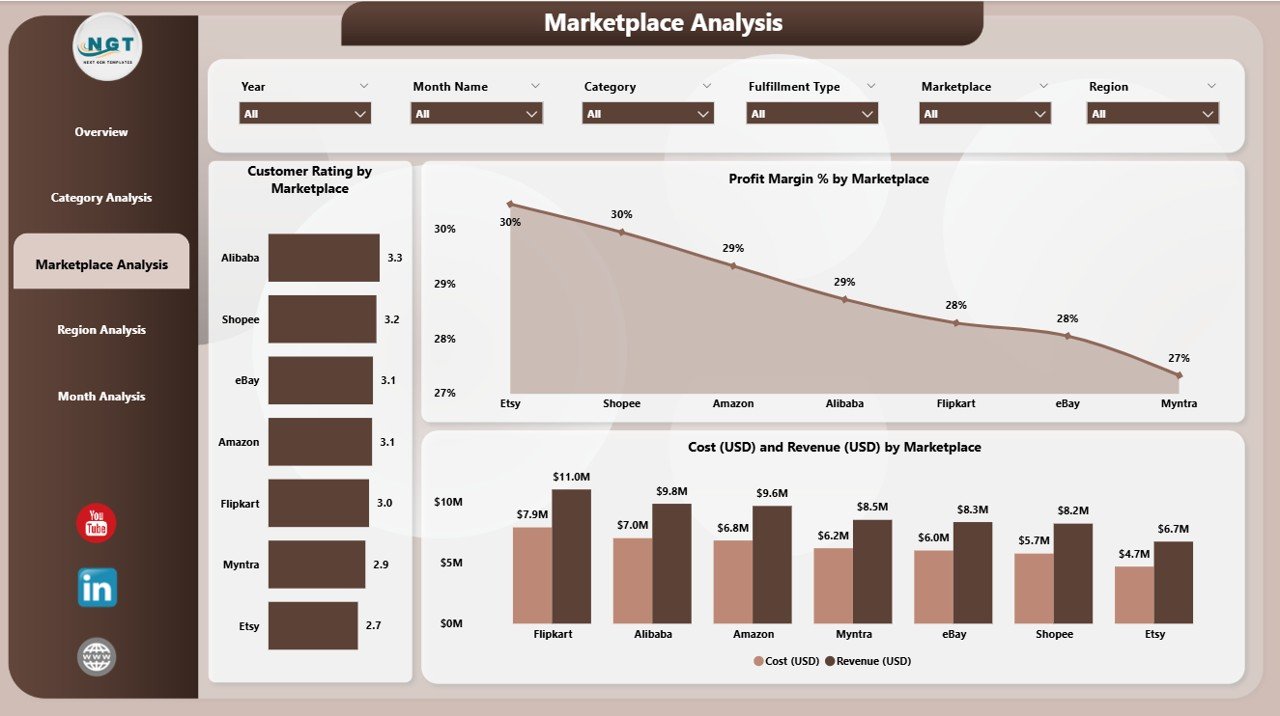
The Marketplace Analysis Page offers insights into individual marketplace performance. Businesses often sell on multiple platforms, and this page helps compare their efficiency and effectiveness.
-
Customer Rating by Marketplace Chart: Shows which marketplaces have the highest customer satisfaction.
-
Profit Margin % by Marketplace Chart: Measures profitability across different platforms.
-
Cost (USD) and Revenue (USD) by Marketplace Chart: Compares costs and revenues across marketplaces.
With this page, managers can identify underperforming marketplaces, optimize strategies, and increase overall profitability.
4. Region Analysis Page
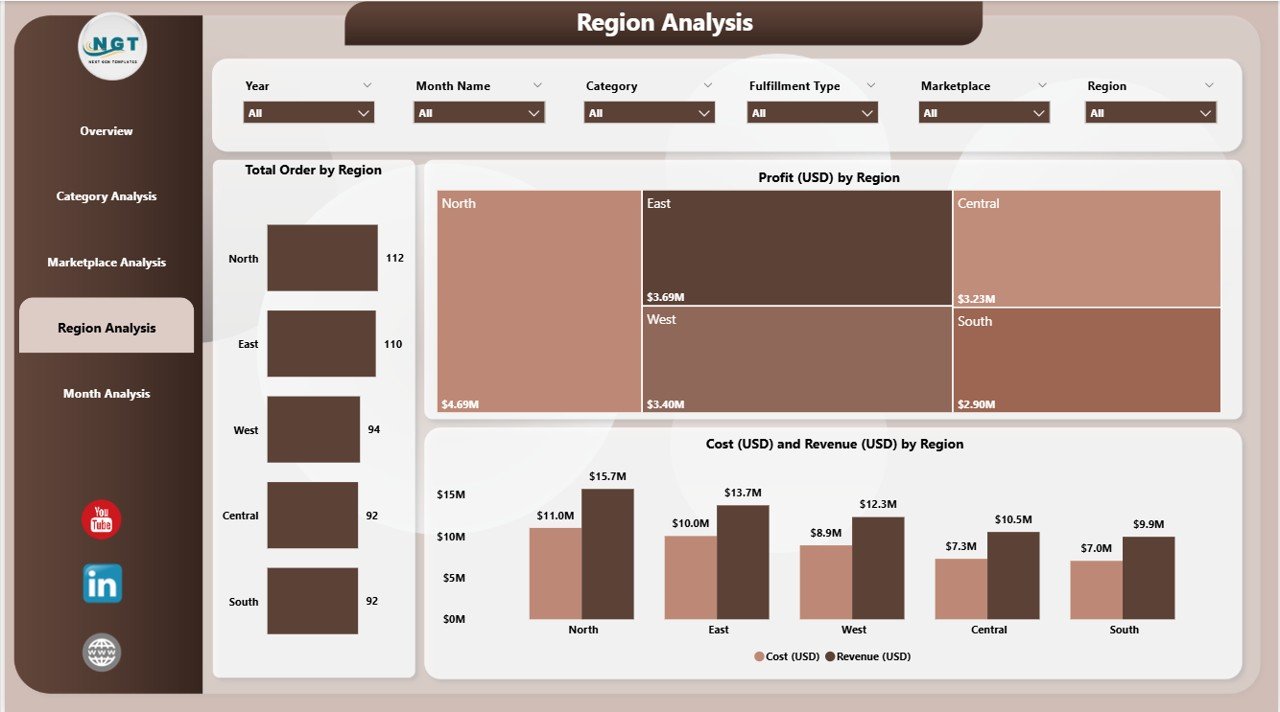
The Region Analysis Page provides a geographical breakdown of marketplace performance. Understanding regional trends is critical for expanding sales and targeting specific areas.
-
Total Order by Region Chart: Tracks the number of orders in each region.
-
Profit (USD) by Region Chart: Shows profits generated from each region.
-
Cost (USD) and Revenue (USD) by Region Chart: Compares costs and revenue geographically.
This page helps businesses plan regional marketing campaigns and allocate resources effectively.
5. Monthly Trends Page
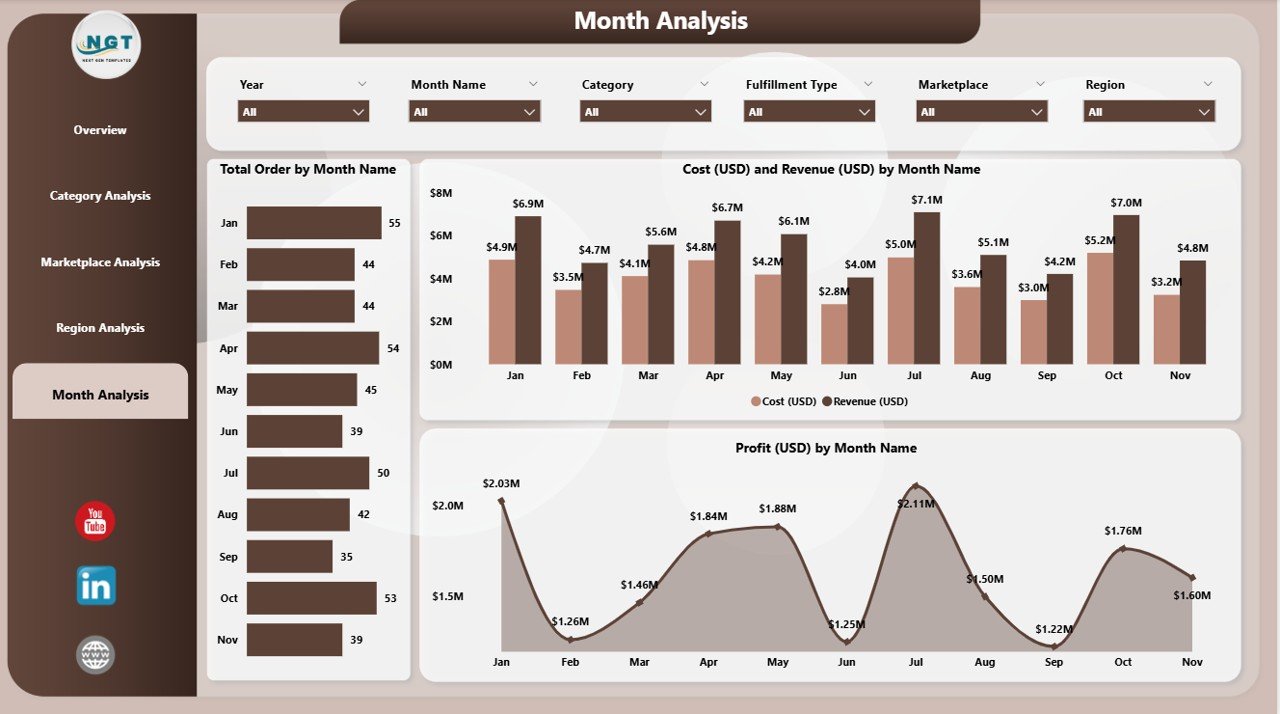
The Monthly Trends Page helps businesses analyze performance over time, identify patterns, and forecast future trends.
-
Total Order by Month Chart: Displays monthly order volumes.
-
Profit (USD) by Month Chart: Tracks monthly profits.
-
Cost (USD) and Revenue (USD) by Month Chart: Shows how costs and revenues fluctuate monthly.
With monthly trend analysis, companies can plan promotions, manage inventory, and improve financial forecasting.
Advantages of Using an Online Marketplaces Dashboard in Power BI
Implementing a Power BI dashboard for online marketplaces offers several benefits:
-
Real-Time Data Insights
Businesses can view updated performance metrics without waiting for manual reports. -
Improved Decision Making
Interactive dashboards enable managers to make data-driven decisions quickly. -
Enhanced Customer Understanding
Visualizing customer ratings and replacement trends helps improve satisfaction. -
Cost and Profit Analysis
Easily identify high-cost areas and optimize operations to maximize profits. -
Category and Marketplace Performance Tracking
Determine which products and marketplaces are most profitable. -
Time Efficiency
Reduce the time spent on compiling reports from multiple sources. -
Data-Driven Strategy
Use insights to adjust marketing, inventory, and pricing strategies effectively.
Best Practices for the Online Marketplaces Dashboard
Click to Purchases Online Marketplaces Dashboard in Power BI
To get the most out of your Online Marketplaces Dashboard in Power BI, follow these best practices:
-
Keep Data Clean and Updated
Ensure your data sources are accurate, complete, and refreshed regularly. -
Use Relevant KPIs
Focus on key metrics such as revenue, profit margins, customer satisfaction, and replacement rates. -
Leverage Slicers for Interactivity
Enable filters for categories, marketplaces, and regions to explore data efficiently. -
Design with Clarity
Avoid cluttered visuals and choose charts that clearly convey insights. -
Analyze Trends Regularly
Monitor monthly and quarterly trends to detect patterns and anticipate issues. -
Combine Multiple Views
Use overview, category, marketplace, region, and monthly trends pages to get a holistic perspective. -
Share Insights Across Teams
Distribute dashboards to relevant stakeholders for collaborative decision-making.
How Does an Online Marketplaces Dashboard Improve Business Performance?
An Online Marketplaces Dashboard improves performance in multiple ways:
-
Identifies Profit Drivers: Quickly spot which categories or marketplaces generate the most revenue.
-
Reduces Operational Costs: Analyze cost trends and take corrective actions to reduce unnecessary expenses.
-
Boosts Customer Satisfaction: Monitor customer ratings and replacement trends to enhance service quality.
-
Supports Marketing Strategies: Align promotions with regions and categories that show growth potential.
-
Enhances Forecasting: Analyze monthly trends to anticipate future sales and demand.
Why Should You Use Power BI for Marketplace Dashboards?
Power BI offers several advantages over traditional reporting tools:
-
Interactive Visuals: Users can explore data dynamically.
-
Easy Integration: Connects seamlessly with various online marketplaces, Excel files, and databases.
-
Customizable Reports: Tailor visuals, KPIs, and pages to your business needs.
-
Automated Refresh: Schedule data refreshes to ensure dashboards are always up-to-date.
-
Accessible Anywhere: Power BI dashboards can be accessed on desktop, mobile, or web.
By leveraging Power BI, businesses gain a competitive edge in understanding marketplace performance and optimizing operations.
How to Implement an Online Marketplaces Dashboard
Here’s a step-by-step approach to creating your dashboard:
-
Identify Data Sources: Collect data from all your marketplaces.
-
Prepare the Data: Clean, format, and transform the data for analysis.
-
Define KPIs: Choose relevant metrics like revenue, profit margin, orders, and customer ratings.
-
Create Visualizations: Build charts and cards for each KPI.
-
Add Slicers and Filters: Enable dynamic interaction with data by region, category, or marketplace.
-
Build Pages: Structure your dashboard into Overview, Category, Marketplace, Region, and Monthly Trends pages.
-
Test and Validate: Ensure data accuracy and functionality.
-
Share and Collaborate: Publish dashboards to Power BI Service and share with stakeholders.
Following these steps ensures a practical, user-friendly, and actionable dashboard.
Tips to Maximize the Effectiveness of Your Dashboard
-
Focus on Relevant Metrics: Avoid including unnecessary data.
-
Use Conditional Formatting: Highlight trends, outliers, or areas requiring attention.
-
Leverage Drill-Through Features: Enable deeper insights into specific categories, regions, or marketplaces.
-
Monitor Dashboard Performance: Keep dashboards optimized for fast loading and usability.
-
Review Regularly: Continuously improve dashboards based on feedback and evolving business needs.
Conclusion
The Online Marketplaces Dashboard in Power BI is an essential tool for businesses operating in multiple e-commerce platforms. It provides actionable insights into performance metrics, customer behavior, and financial trends. By leveraging interactive visuals and structured pages like Overview, Category Analysis, Marketplace Analysis, Region Analysis, and Monthly Trends, businesses can optimize operations, improve profitability, and enhance customer satisfaction.
Implementing such a dashboard ensures data-driven decision-making and provides a competitive edge in the fast-paced e-commerce environment.
Frequently Asked Questions (FAQs)
1. What is an Online Marketplaces Dashboard?
It is a Power BI dashboard that tracks the performance of online marketplaces, including metrics like revenue, cost, profit margin, and customer ratings.
2. Which KPIs are important in an Online Marketplaces Dashboard?
Key KPIs include total orders, revenue, profit margin, customer ratings, cost, and replacement order percentages.
3. Can this dashboard handle multiple marketplaces?
Yes, it can consolidate data from multiple platforms and provide comparative analysis.
4. How often should the dashboard be updated?
Ideally, it should be refreshed daily or weekly depending on business requirements.
5. Can non-technical users use Power BI dashboards?
Yes, dashboards are user-friendly and interactive, making them accessible to all business stakeholders.
6. What are the benefits of using Power BI for marketplaces?
Benefits include real-time insights, interactive visuals, trend analysis, better decision-making, and cost optimization.
7. Can this dashboard help improve customer satisfaction?
Yes, by monitoring customer ratings and replacement trends, businesses can enhance their service quality.
Visit our YouTube channel to learn step-by-step video tutorials