Tracking key performance indicators (KPIs) is crucial for running successful online marketplaces. Whether you’re managing multiple sellers, tracking conversion rates, or optimizing customer satisfaction, having a centralized system to monitor your metrics is non-negotiable. That’s where the Online Marketplaces KPI Dashboard in Power BI comes into play. In this guide, you’ll learn everything you need to know about this dashboard, its features, best practices, and how it can transform your marketplace management strategy.
Click to Purchases Online Marketplaces KPI Dashboard in Power BI
What is an Online Marketplaces KPI Dashboard in Power BI?
An Online Marketplaces KPI Dashboard in Power BI is a visual analytics tool that helps you track and analyze key metrics related to your marketplace’s performance. It combines data from Excel sources and turns it into interactive visuals and summaries that decision-makers can use to monitor progress, identify bottlenecks, and make informed decisions in real-time.
This dashboard is particularly useful for:
- Marketplace managers
- Business analysts
- E-commerce teams
- Operations leads
Key Pages of the Dashboard
The Power BI dashboard consists of three main pages, each serving a unique purpose.
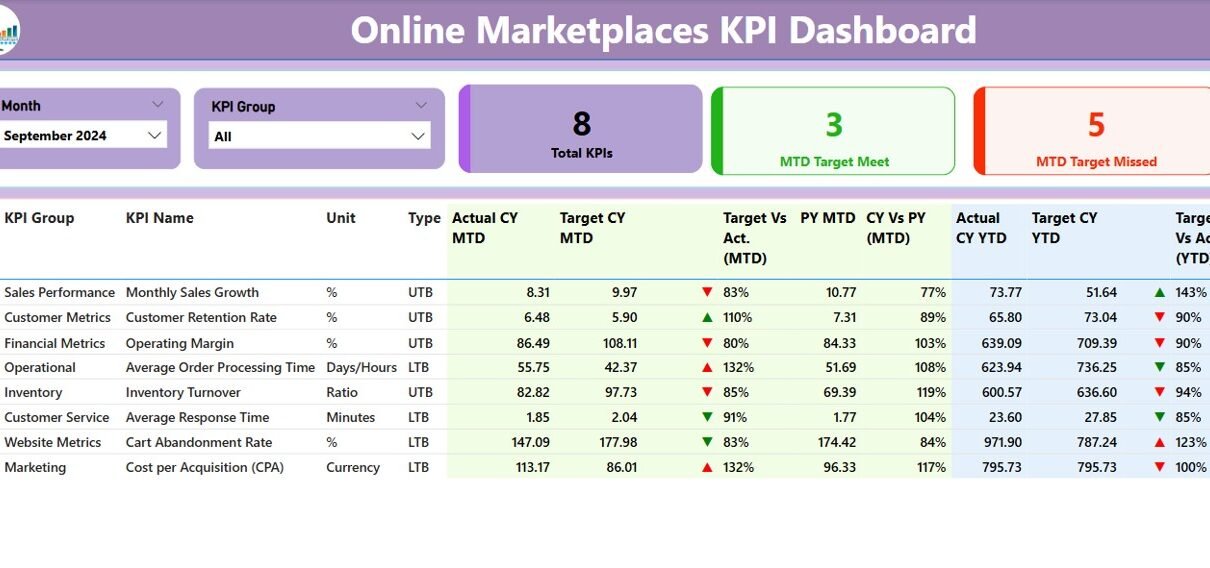
Summary Page
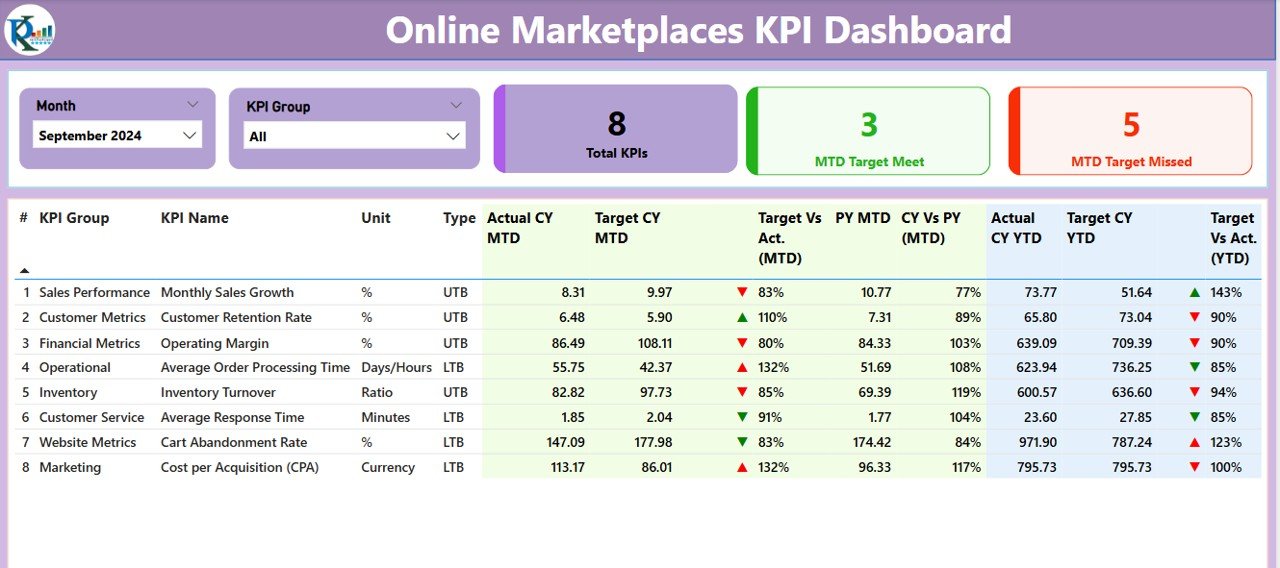
This is the central hub of the dashboard where you get a comprehensive overview of all your KPIs. Here’s what you’ll find:
- Month and KPI Group slicer: Select a specific time period and group of KPIs.
Summary Cards:
- Total KPIs Count
- MTD Target Met Count
- MTD Target Missed Count
Click to Purchases Online Marketplaces KPI Dashboard in Power BI
Detailed Table Includes:
- KPI Number: Unique sequence number for each KPI.
- KPI Group: Categorization such as Sales, Customer Service, Logistics, etc.
- KPI Name: Descriptive name of the metric.
- Unit: Measurement unit (e.g., %, Count, Days).
- Type: LTB (Lower The Better) or UTB (Upper The Better).
- Actual CY MTD / YTD: Current Year Month-to-Date / Year-to-Date actuals.
- Target CY MTD / YTD: Target values for MTD / YTD.
- MTD / YTD Icons: Green ▲ or Red ▼ icons to indicate status.
- Target Vs Actual %: How well you’re meeting your goals.
- PY MTD / YTD: Previous Year’s values for the same period.
- CY vs PY %: Year-over-Year performance comparison.
KPI Trend Page
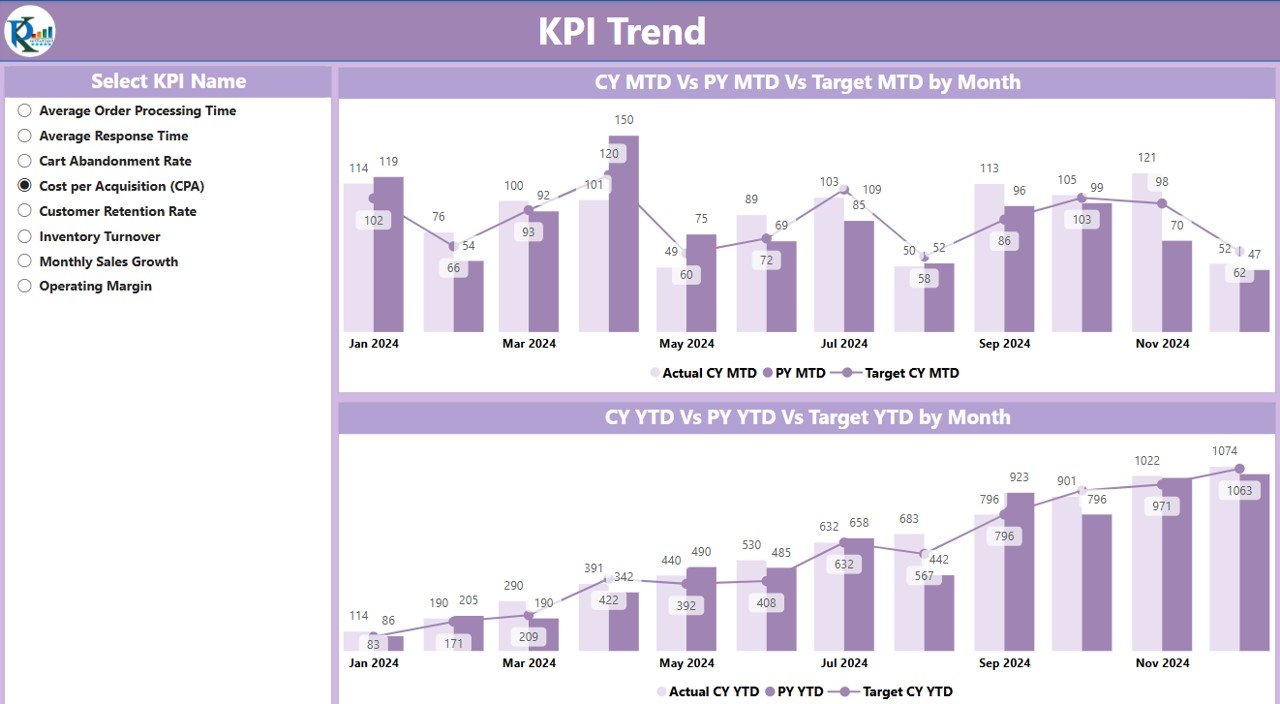
This page is perfect for visual storytelling. You get:
Combo Charts:
- One for MTD (Month-to-Date)
- One for YTD (Year-to-Date)
- KPI Selector: Easily filter the view by KPI name using the slicer.
This layout helps identify trends and patterns in performance over time.
Click to Purchases Online Marketplaces KPI Dashboard in Power BI
KPI Definition Page
This is a hidden drill-through page that you can access by right-clicking on a KPI in the Summary page. It provides detailed metadata:
- KPI Formula
- KPI Definition
- Back button to return to the Summary Page
Excel Data Source Integration
The Power BI dashboard pulls its data from an Excel file with three critical sheets:
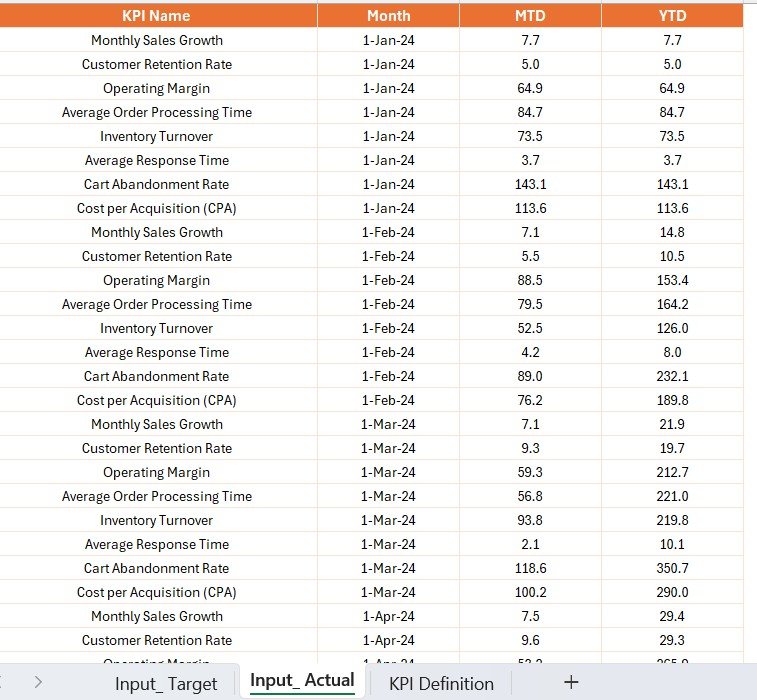
1. Input_Actual Sheet
Fields:
- KPI Name
- Month (as the first date of the month)
- MTD Actual
- YTD Actual
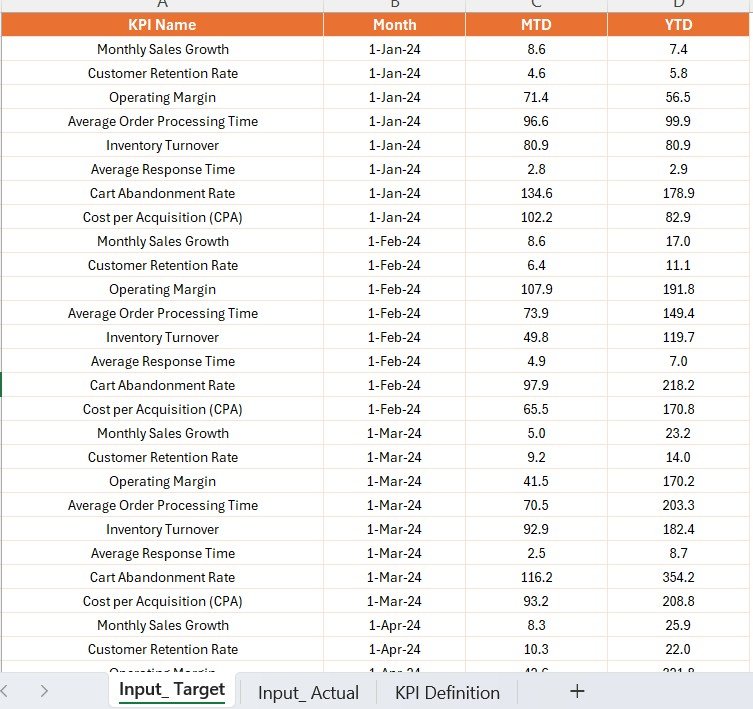
2. Input_Target Sheet
Fields:
- KPI Name
- Month
- MTD Target
- YTD Target
3. KPI Definition Sheet
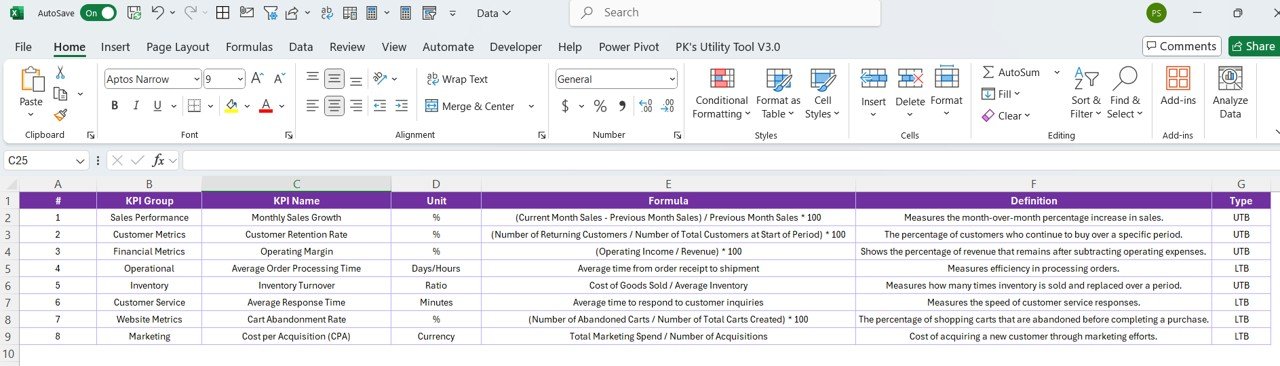
Fields:
- KPI Number
- KPI Group
- KPI Name
- Unit
- Formula
- Definition
- Type (LTB / UTB)
Why Should You Use a KPI Dashboard for Online Marketplaces?
Using a Power BI dashboard for marketplace KPIs isn’t just a convenience—it’s a strategic advantage.
Advantages of Online Marketplaces KPI Dashboard
✨ Instant Visibility: Real-time insights into performance metrics.
⚡ Better Decision Making: Use visualized trends to make faster and smarter decisions.
🔄 Historical Comparison: Compare your current performance with the past.
🔧 Customization: Add, remove, or modify KPIs based on business needs.
⏱ Time-Saving: Reduce manual work and automate report generation.
🌍 Scalability: Manage hundreds of KPIs across different categories or vendors.
Best Practices for Using the KPI Dashboard
Click to Purchases Online Marketplaces KPI Dashboard in Power BI
To make the most of your Power BI dashboard, follow these proven strategies:
1. Keep Your Data Clean
Ensure all Excel data entries are accurate and formatted correctly. Mistakes in date formatting or missing values can break visualizations.
2. Use Descriptive KPI Names
Avoid vague KPI names like “Metric 1” or “Performance A.” Use clear, business-friendly names.
3. Stick to One Source of Truth
Use only the official Excel files for data inputs to avoid version mismatches.
4. Regularly Update the Data
Set a routine to update your Actual and Target sheets monthly.
5. Train Your Team
Make sure your stakeholders understand how to use slicers, navigate drill-throughs, and interpret icons.
6. Use Conditional Formatting Thoughtfully
Icons are helpful—but don’t overdo it. Ensure red/green indicators are intuitive and consistent.
How to Build This Dashboard in Power BI
You can build this dashboard step-by-step using Power BI Desktop:
- Connect Excel Data: Load the three sheets.
- Transform Data: Use Power Query to clean and prepare the dataset.
- Create Relationships: Link actuals, targets, and definitions using KPI Name.
- Create Measures: Add DAX formulas for MTD %, YTD %, Target vs Actual, and CY vs PY.
- Design Pages: Use cards, tables, combo charts, and slicers.
- Add Drill-Through: Enable drill-through to the KPI Definition page.
- Format Icons: Use conditional formatting for icons.
Common KPI Examples for Online Marketplaces
Here are some useful KPIs you can track using this dashboard:
- Total Sales (USD)
- Average Order Value
- Customer Retention Rate
- Conversion Rate
- Return Rate
- Listing Views per Product
- Time to Fulfill Orders
- Complaint Resolution Time
- Cart Abandonment Rate
- Customer Satisfaction Score (CSAT)
How Does This Dashboard Improve Marketplace Performance?
This dashboard offers actionable insights by:
- Quickly identifying which KPIs are underperforming
- Highlighting trends in seller performance and customer behavior
- Helping managers adjust strategies for pricing, promotions, and logistics
Conclusion
The Online Marketplaces KPI Dashboard in Power BI is more than just a set of visuals—it’s a business command center. With three well-designed pages, dynamic slicers, and Excel integration, this dashboard makes it easy to monitor your marketplace’s performance, spot red flags, and take corrective actions on time.
Investing in this tool means investing in visibility, efficiency, and success.
Frequently Asked Questions (FAQs)
Q1: Can I add more KPIs to this dashboard?
Yes, you can easily add more KPIs by updating the Excel sheets and refreshing the data in Power BI.
Q2: How often should I update the data?
You should update it monthly to ensure you track trends accurately.
Q3: What if I don’t use Excel as my data source?
You can use any other source like SQL or Google Sheets as long as Power BI supports it.
Q4: Do I need advanced Power BI skills to use this?
Not at all. Basic knowledge of Power BI and Excel is enough to manage and update this dashboard.
Q5: Is this dashboard mobile-friendly?
Yes, you can publish and view it on the Power BI mobile app with responsive layouts.
Q6: Can I share this dashboard with my team?
Absolutely. You can publish it to Power BI service and share access with team members securely.
Click to Purchases Online Marketplaces KPI Dashboard in Power BI
Visit our YouTube channel to learn step-by-step video tutorials