Organic farming continues to grow rapidly across the world. Farmers, agribusiness owners, and policymakers now focus not only on yield but also on sustainability, cost control, and profitability. However, managing organic farms without clear visibility into costs, revenue, and performance often creates confusion and delays decisions. This is exactly where an Organic Farming Dashboard in Power BI becomes a game changer.
An Organic Farming Dashboard in Power BI converts raw farm data into clear, interactive visuals. As a result, stakeholders instantly understand fertilizer costs, irrigation expenses, profit margins, soil performance, and monthly trends. Moreover, because the dashboard runs on Power BI, it delivers real-time insights, flexible filtering, and powerful visual storytelling.
In this detailed guide, you will learn what an Organic Farming Dashboard in Power BI is, how it works, what pages it includes, and why it has become essential for modern organic farming. In addition, you will explore advantages, best practices, and frequently asked questions to help you use this dashboard effectively.
Click to Purchases Organic Farming Dashboard in Power BI
What Is an Organic Farming Dashboard in Power BI?
An Organic Farming Dashboard in Power BI is a visual analytics solution designed to monitor and analyze organic farming performance. It pulls structured data from Excel or databases and displays it through interactive charts, KPIs, and filters.
Instead of relying on spreadsheets and manual reports, users view all critical farm metrics in one place. Therefore, decision-making becomes faster, clearer, and more accurate. Moreover, Power BI allows users to slice data by region, farm type, irrigation method, fertilizer type, and time period.
Why Do Organic Farmers Need a Dashboard?
Organic farming involves multiple variables that directly affect profitability and sustainability. Therefore, farmers need a tool that delivers clarity at every level.
Key challenges without a dashboard include:
-
Lack of visibility into fertilizer and irrigation costs
-
Difficulty in comparing farm performance by type or region
-
Delayed identification of profit leakage
-
Limited understanding of seasonal trends
-
Manual and error-prone reporting processes
However, with an Organic Farming Dashboard in Power BI, farmers overcome these challenges and shift from reactive to proactive decision-making.
How Does an Organic Farming Dashboard in Power BI Work?
The dashboard works by connecting farm data stored in Excel or databases to Power BI. Once connected, Power BI transforms the data into structured tables and visuals.
The workflow usually includes:
-
Collecting farm data (cost, revenue, yield, methods)
-
Cleaning and structuring data in Excel
-
Building visuals and KPIs in Power BI
-
Applying slicers for interactive analysis
-
Publishing insights for stakeholders
As soon as data updates, the dashboard refreshes. Consequently, users always see the latest performance metrics.
What Are the Key Pages in the Organic Farming Dashboard in Power BI?
This dashboard includes five powerful analytical pages, each focusing on a specific aspect of organic farming. Together, they provide a complete performance overview.
Overview Page: What Insights Does the Overview Page Provide?
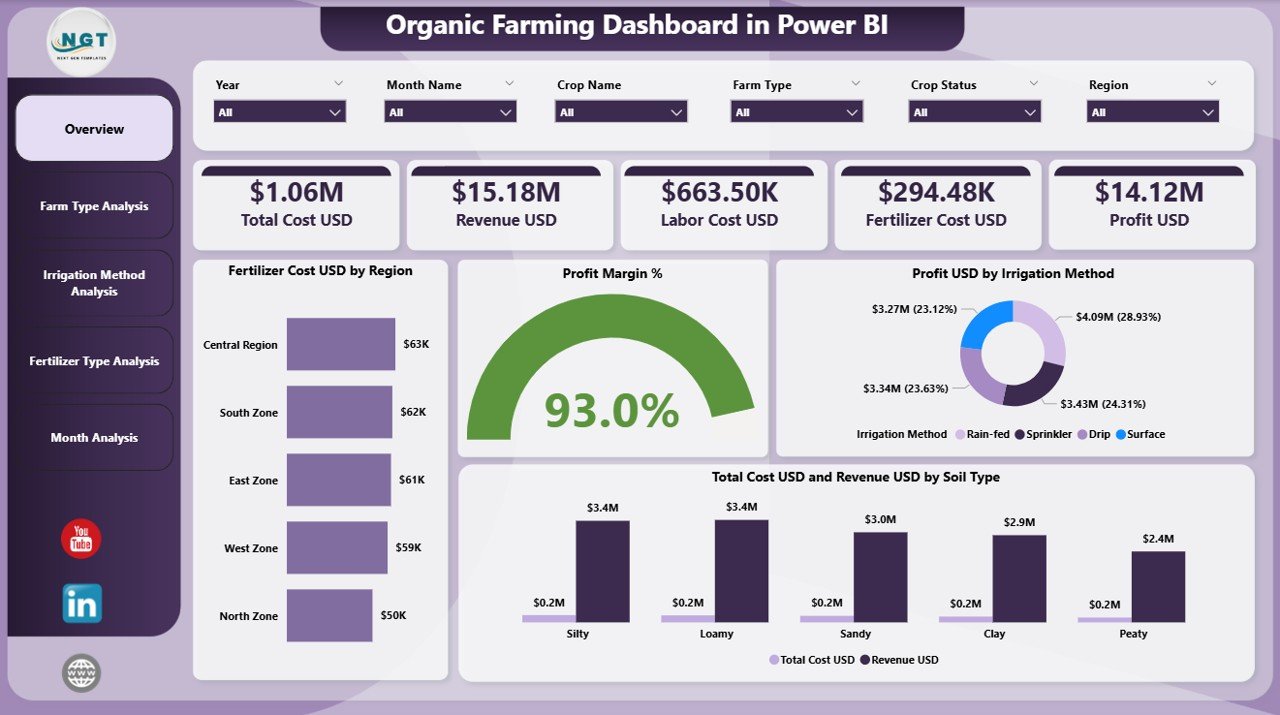
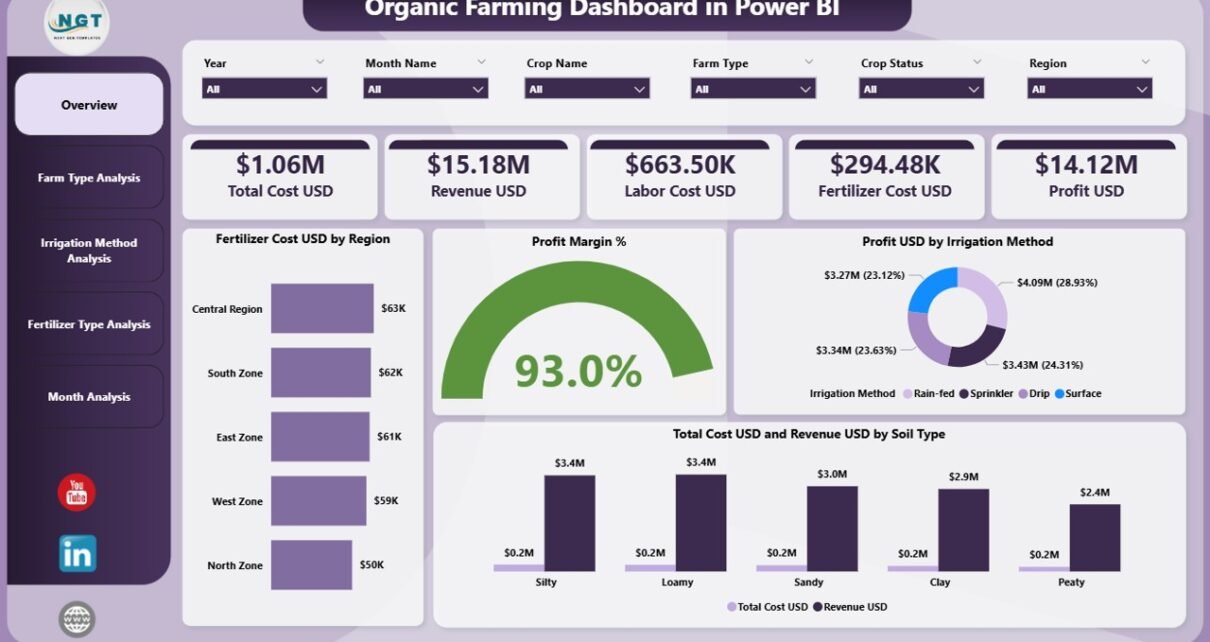
The Overview Page acts as the command center of the dashboard. It delivers a high-level summary of organic farming performance across regions, soil types, and irrigation methods.
Key Features of the Overview Page
-
Interactive Slicers
-
Region
-
Farm Type
-
Soil Type
-
Time period
-
These slicers allow users to instantly filter data and focus on specific scenarios.
KPI Cards on the Overview Page
The page includes four KPI cards, which quickly answer critical business questions:
-
Total Revenue USD
-
Total Cost USD
-
Profit USD
-
Profit Margin %
Because these KPIs appear at the top, decision-makers immediately understand overall performance.
Charts on the Overview Page
The Overview Page also contains four insightful charts:
-
Fertilizer Cost USD by Region
Helps identify high-cost regions and cost-saving opportunities. -
Profit Margin % by Region
Highlights regions that perform well or underperform. -
Profit USD by Irrigation Method
Shows which irrigation techniques generate higher profitability. -
Total Cost USD and Revenue USD by Soil Type
Compares soil performance and helps optimize land usage.
As a result, the Overview Page delivers instant clarity and strategic direction.
Click to Purchases Organic Farming Dashboard in Power BI
Farm Type Analysis Page: How Does Farm Type Affect Profitability?
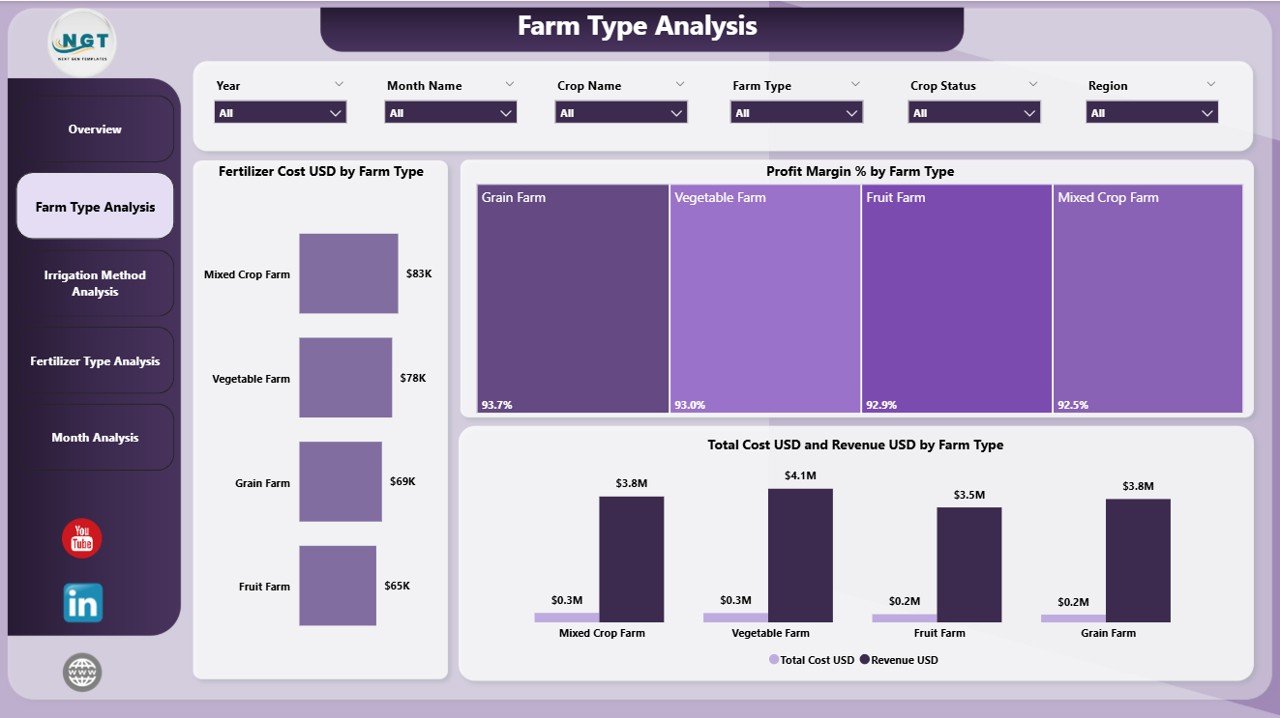
The Farm Type Analysis Page focuses on comparing performance across different types of organic farms, such as crop farms, mixed farms, and specialty organic farms.
Why Is Farm Type Analysis Important?
Different farm types use varying resources, methods, and inputs. Therefore, analyzing performance by farm type helps optimize investment and operations.
Key Elements of the Farm Type Analysis Page
-
Slicers
-
Farm Type
-
Region
-
Time period
-
Charts on the Farm Type Analysis Page
-
Fertilizer Cost USD by Farm Type
Compares fertilizer spending across farm categories. -
Profit Margin % by Farm Type
Identifies the most profitable farm models. -
Total Cost USD and Revenue USD by Farm Type
Shows cost-to-revenue balance for each farm type.
With these insights, stakeholders can scale high-performing farm types and improve weaker ones.
Click to Purchases Organic Farming Dashboard in Power BI
Irrigation Method Analysis Page: Which Irrigation Methods Perform Best?
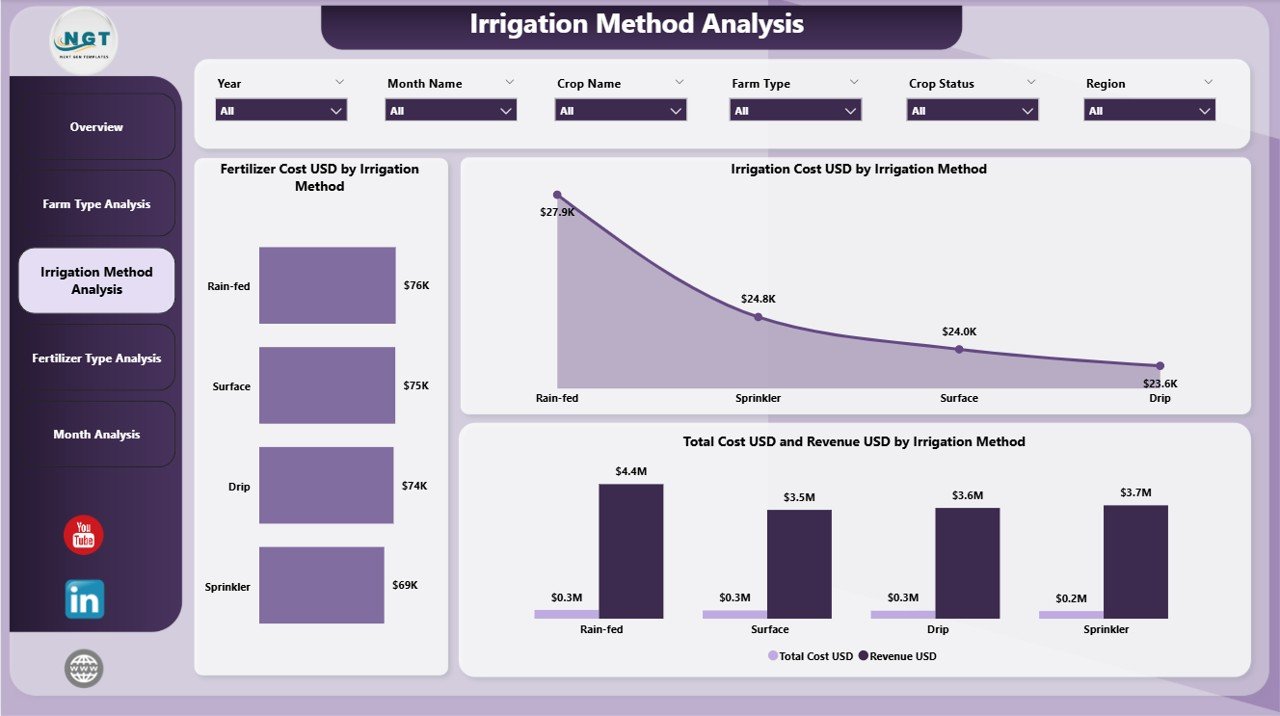
The Irrigation Method Analysis Page examines how different irrigation techniques impact costs and profitability.
Why Is Irrigation Analysis Critical in Organic Farming?
Water management directly influences yield, cost, and sustainability. Therefore, choosing the right irrigation method becomes essential.
Key Components of the Irrigation Method Analysis Page
-
Slicers
-
Irrigation Method
-
Farm Type
-
Region
-
Charts on the Irrigation Method Analysis Page
-
Fertilizer Cost USD by Irrigation Method
Shows how irrigation choices affect fertilizer efficiency. -
Irrigation Cost USD by Irrigation Method
Highlights water and energy expenses for each method. -
Total Cost USD and Revenue USD by Irrigation Method
Compares profitability across irrigation techniques.
Using this page, farmers quickly identify cost-effective and sustainable irrigation strategies.
Fertilizer Type Analysis Page: Which Fertilizers Deliver Better Returns?
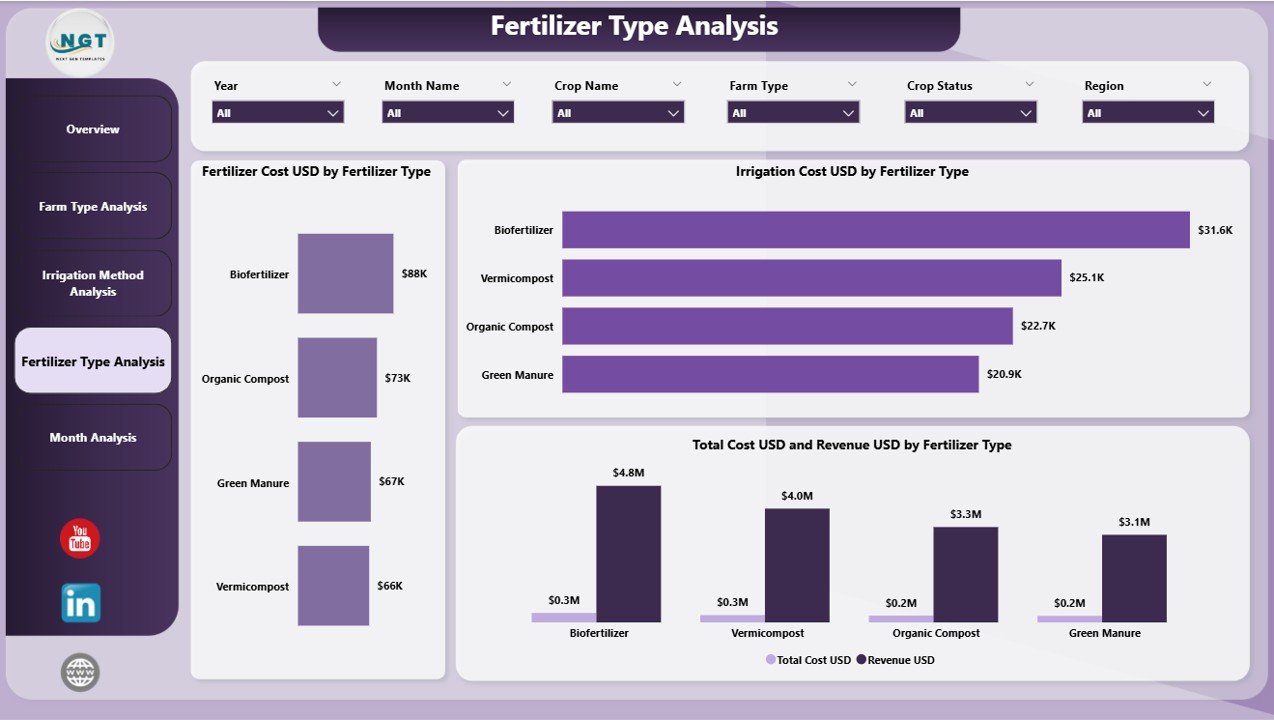
The Fertilizer Type Analysis Page focuses on analyzing organic fertilizer performance and cost efficiency.
Why Analyze Fertilizer Types?
Organic fertilizers vary widely in cost and impact on yield. Therefore, analyzing fertilizer types ensures better resource utilization.
Key Features of the Fertilizer Type Analysis Page
-
Slicers
-
Fertilizer Type
-
Farm Type
-
Region
-
Charts on the Fertilizer Type Analysis Page
-
Fertilizer Cost USD by Fertilizer Type
Identifies high-cost and low-cost fertilizer options. -
Irrigation Cost USD by Fertilizer Type
Shows indirect cost relationships. -
Total Cost USD and Revenue USD by Fertilizer Type
Measures overall return on fertilizer investment.
As a result, farmers can choose fertilizers that maximize profit while maintaining organic standards.
Click to Purchases Organic Farming Dashboard in Power BI
Monthly Trends Page: How Do Costs and Profits Change Over Time?
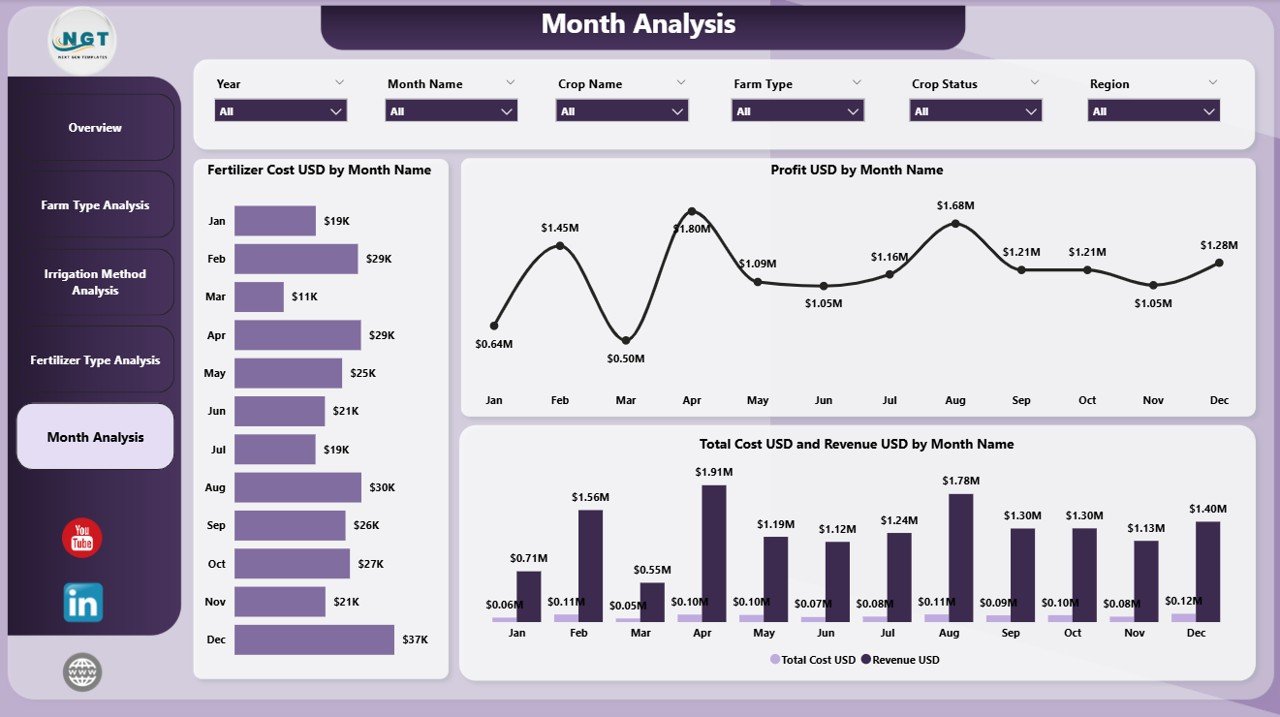
The Monthly Trends Page provides a time-based perspective on organic farming performance. It helps users track seasonality, trends, and long-term patterns.
Importance of Monthly Trend Analysis
Farming performance changes across seasons. Therefore, monthly analysis supports planning, forecasting, and budgeting.
Charts on the Monthly Trends Page
-
Fertilizer Cost USD by Month
Highlights seasonal fertilizer spending patterns. -
Profit USD by Month
Shows when farms generate maximum profit. -
Total Cost USD and Revenue USD by Month
Tracks financial performance over time.
With these insights, users plan future cycles with greater accuracy.
Advantages of an Organic Farming Dashboard in Power BI
An Organic Farming Dashboard in Power BI delivers several powerful benefits.
Key Advantages
-
✅ Improves visibility into farm costs and revenue
-
✅ Enables data-driven decision-making
-
✅ Reduces manual reporting effort
-
✅ Identifies cost-saving opportunities
-
✅ Enhances sustainability planning
-
✅ Supports seasonal and trend analysis
-
✅ Scales easily across farms and regions
Because of these advantages, organic farmers gain both control and confidence.
Best Practices for the Organic Farming Dashboard in Power BI
To maximize value, users should follow proven best practices.
Data Management Best Practices
-
Maintain clean and consistent data
-
Use standardized units and categories
-
Validate data regularly
Dashboard Design Best Practices
-
Keep visuals simple and focused
-
Use clear labels and titles
-
Limit the number of charts per page
Analytical Best Practices
-
Compare actual vs historical performance
-
Monitor profit margins regularly
-
Use slicers to perform scenario analysis
When users follow these best practices, the dashboard delivers accurate and actionable insights.
Who Can Use an Organic Farming Dashboard in Power BI?
This dashboard benefits a wide range of stakeholders.
-
Organic farmers and farm owners
-
Agricultural consultants
-
Agribusiness companies
-
Sustainability officers
-
Policymakers and researchers
Because the dashboard stays user-friendly, both technical and non-technical users can adopt it easily.
How Does the Dashboard Support Sustainable Organic Farming?
Sustainability plays a key role in organic agriculture. The dashboard supports sustainability by:
-
Tracking input efficiency
-
Reducing wastage
-
Promoting cost-effective methods
-
Encouraging data-driven resource allocation
Therefore, farmers achieve both environmental and economic goals.
Conclusion: Why Should You Use an Organic Farming Dashboard in Power BI?
An Organic Farming Dashboard in Power BI transforms complex farm data into meaningful insights. It enables farmers to track costs, optimize methods, improve profit margins, and plan for the future with confidence.
Because it offers interactive visuals, clear KPIs, and actionable insights, this dashboard becomes an essential tool for modern organic agriculture. Ultimately, it empowers farmers to grow sustainably while remaining profitable.
Frequently Asked Questions (FAQs)
What is the main purpose of an Organic Farming Dashboard in Power BI?
The main purpose is to monitor costs, revenue, and profitability while supporting data-driven decisions in organic farming.
Can beginners use this dashboard easily?
Yes. The dashboard uses intuitive visuals and filters, which makes it easy for beginners and experts alike.
Does the dashboard support multiple farms and regions?
Yes. Users can analyze data across multiple farms, regions, and time periods using slicers.
Can the dashboard work with Excel data?
Yes. The Organic Farming Dashboard in Power BI connects seamlessly with Excel files.
How often does the dashboard update?
The dashboard updates whenever the connected data source refreshes.
Is this dashboard useful for sustainability planning?
Absolutely. It helps track resource usage, input efficiency, and long-term trends.
Can this dashboard scale as farm operations grow?
Yes. Power BI handles large datasets easily, which allows the dashboard to scale with growing operations.
Visit our YouTube channel to learn step-by-step video tutorials
Click to Purchases Organic Farming Dashboard in Power BI