So, how do you track alliance performance clearly and confidently?
The answer is simple.
Click to Purchases Partner Alliances Dashboard in Power BI
You need a Partner Alliances Dashboard in Power BI.
This ready-to-use Power BI solution helps organizations monitor partner relationships with complete clarity. Moreover, it converts raw alliance data into interactive visuals. Instead of juggling multiple Excel files, you can track performance, revenue, tiers, industries, and monthly trends in one centralized system.
In this detailed guide, you will learn:
-
What a Partner Alliances Dashboard in Power BI is
-
Why organizations need it
-
A complete explanation of all 5 dashboard pages
-
Key KPIs you should track
-
Advantages of Partner Alliances Dashboard in Power BI
-
Best Practices for the Partner Alliances Dashboard
-
Frequently Asked Questions with Answers
Let us explore everything step by step.
What Is a Partner Alliances Dashboard in Power BI?
A Partner Alliances Dashboard in Power BI is an interactive analytics solution designed to monitor and analyze strategic partnerships. It allows companies to track:
-
Revenue generated by partners
-
Leads generated through alliances
-
Customer satisfaction by partner type
-
Performance by partnership tier
-
Industry-based contribution
-
Monthly alliance growth
Instead of relying on static reports, this dashboard uses Power BI’s powerful visualization tools. Therefore, you gain real-time insights. Moreover, you can filter data using slicers to focus on specific regions, partner types, industries, or time periods.
As a result, leadership teams gain visibility. Sales managers gain clarity. And alliance managers gain control.
Why Do Organizations Need a Partner Alliances Dashboard in Power BI?
Partnership ecosystems grow quickly. However, complexity grows with them. Without structured reporting, companies face several challenges:
-
Difficulty tracking partner contribution
-
Unclear revenue distribution
-
Lack of visibility into lead performance
-
Poor monitoring of partner satisfaction
-
Inconsistent reporting across departments
Therefore, organizations need a structured solution.
A Partner Alliances Dashboard in Power BI solves these problems because it:
-
Centralizes all alliance data
-
Automates calculations
-
Provides interactive filters
-
Displays KPIs visually
-
Supports faster decision-making
Moreover, Power BI allows you to refresh data instantly. Consequently, you always work with updated information.
Click to Purchases Partner Alliances Dashboard in Power BI
Complete Explanation of All 5 Pages
Now, let us understand each dashboard page in detail.
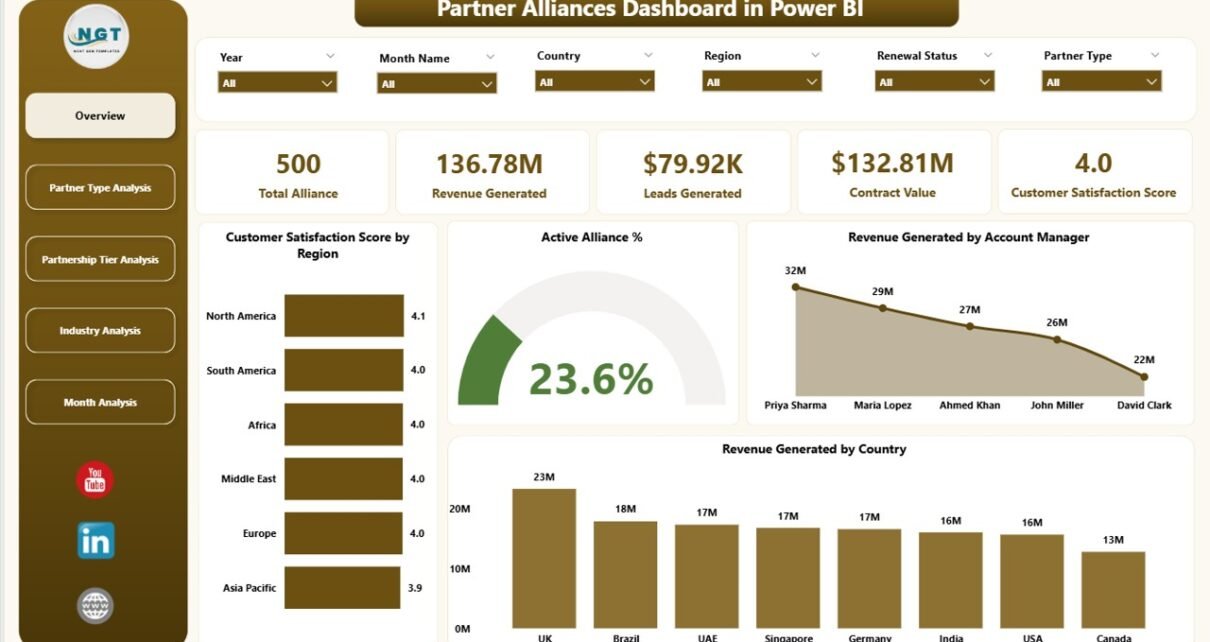
1️⃣ Overview Page – What Does It Show?
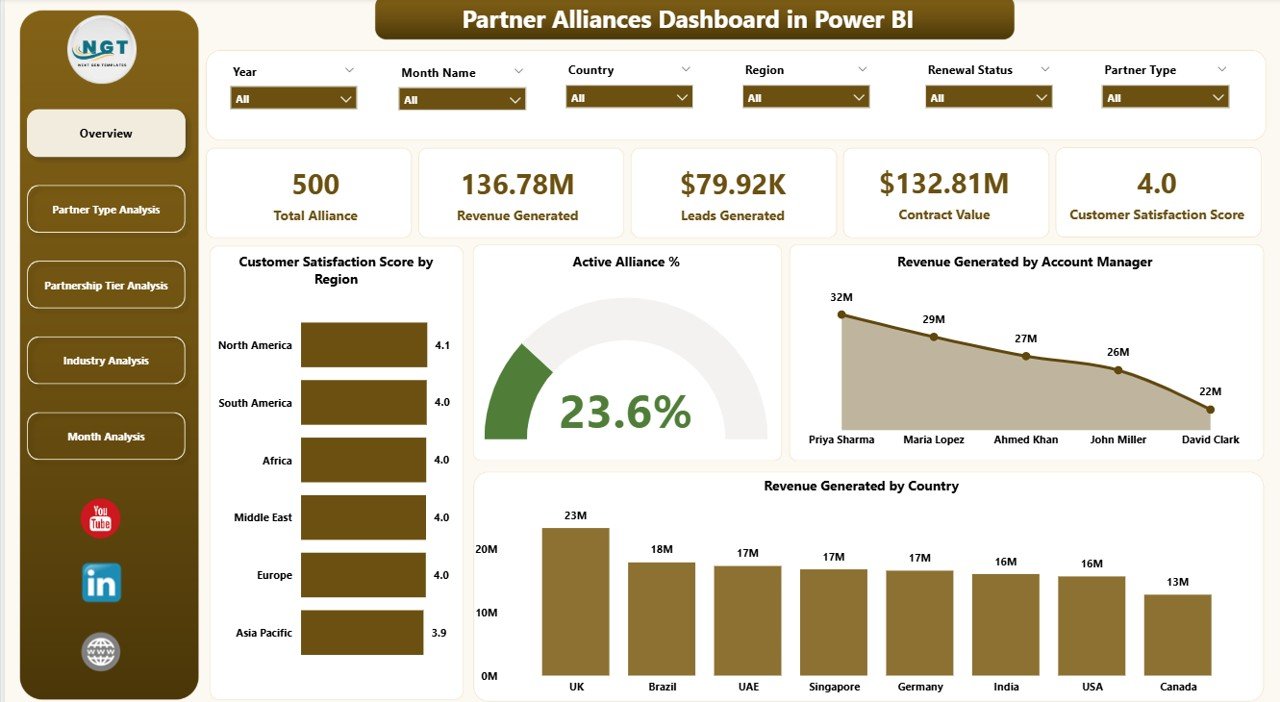
The Overview Page acts as the main control center. It provides a high-level summary of alliance performance.
Key Features:
-
Slicers (Filters) to refine data
-
5 KPI Cards for instant insights
-
Region-based and manager-based breakdowns
KPI Cards Included:
-
Customer Satisfaction Score by Region
-
Active Alliance %
-
Revenue Generated by Account Manager
-
Revenue Generated by Country
-
Additional performance metrics summary
Therefore, you can quickly see overall alliance health. Moreover, you can filter by region or other dimensions to analyze specific segments.
For example, if Customer Satisfaction drops in one region, you can immediately investigate. As a result, you take corrective action quickly.
2️⃣ Partner Type Analysis – How Do Different Partner Types Perform?
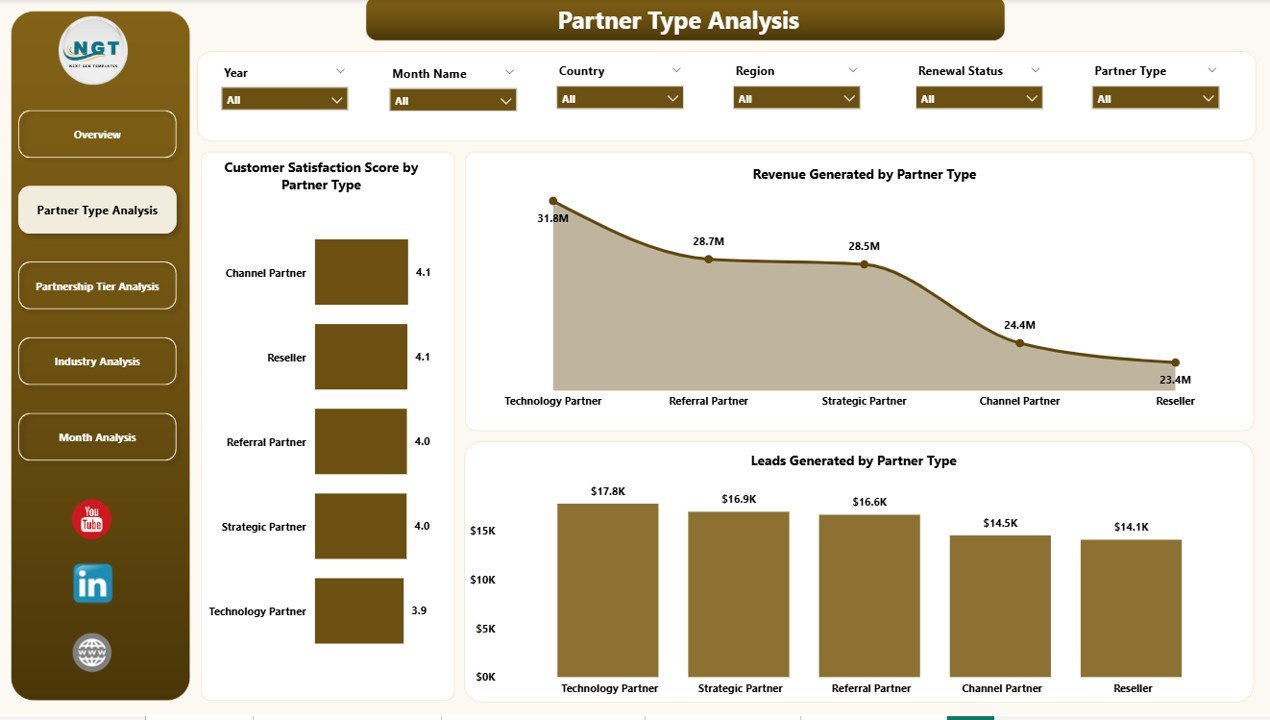
Partnership models vary. Some partners focus on referrals. Others focus on distribution. Therefore, you must analyze them separately.
This page focuses on performance by Partner Type.
Charts Included:
-
Customer Satisfaction Score by Partner Type
-
Revenue Generated by Partner Type
-
Leads Generated by Partner Type
Because each partner type behaves differently, this page helps you compare performance side by side.
For example:
-
Technology Partners may generate higher revenue.
-
Referral Partners may generate more leads.
-
Strategic Partners may show higher satisfaction scores.
Therefore, you can adjust commission plans, incentives, and strategies accordingly.
Click to Purchases Partner Alliances Dashboard in Power BI
3️⃣ Partnership Tier Analysis – Which Tier Drives Maximum Value?
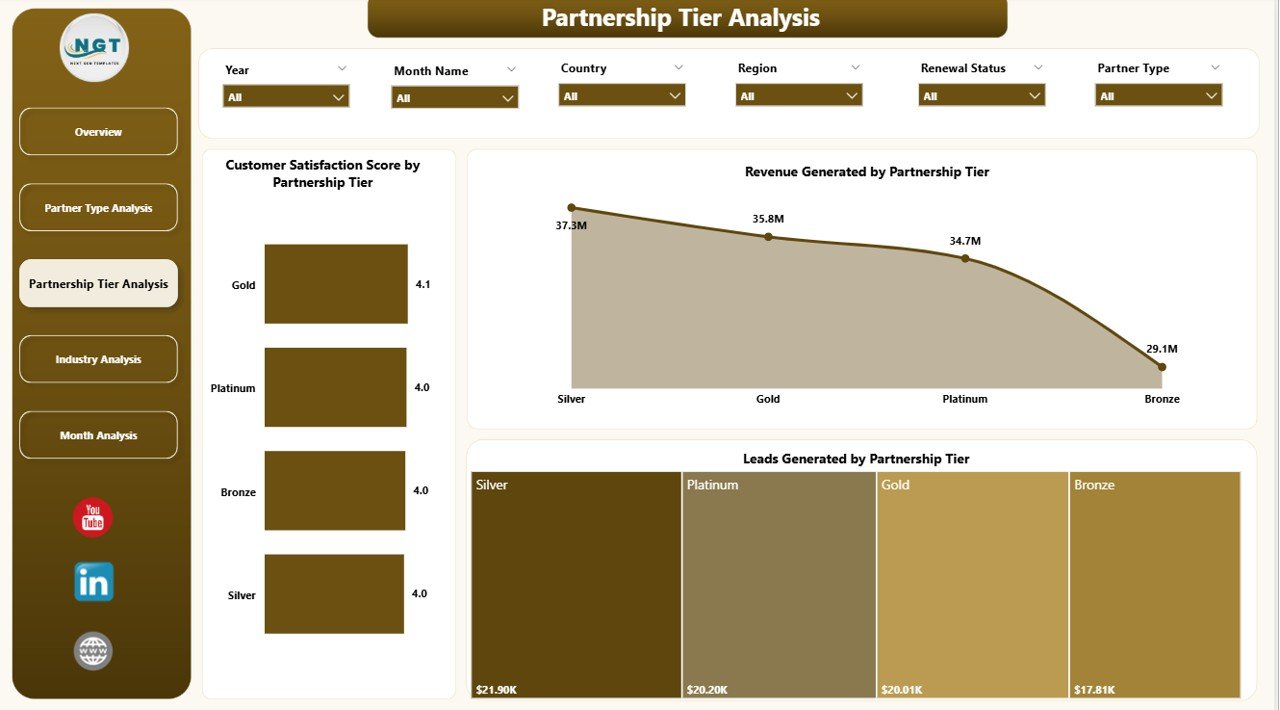
Organizations often categorize partners into tiers such as:
-
Gold
-
Silver
-
Bronze
-
Platinum
However, not all tiers perform equally. Therefore, you must track their impact carefully.
Charts Included:
-
Customer Satisfaction Score by Partnership Tier
-
Revenue Generated by Partnership Tier
-
Leads Generated by Partnership Tier
This analysis helps answer key questions:
-
Does the Gold tier generate higher revenue?
-
Do Bronze partners bring more leads?
-
Which tier needs performance improvement?
As a result, you can redesign tier benefits and upgrade criteria.
4️⃣ Industry Analysis – Which Industries Contribute Most?
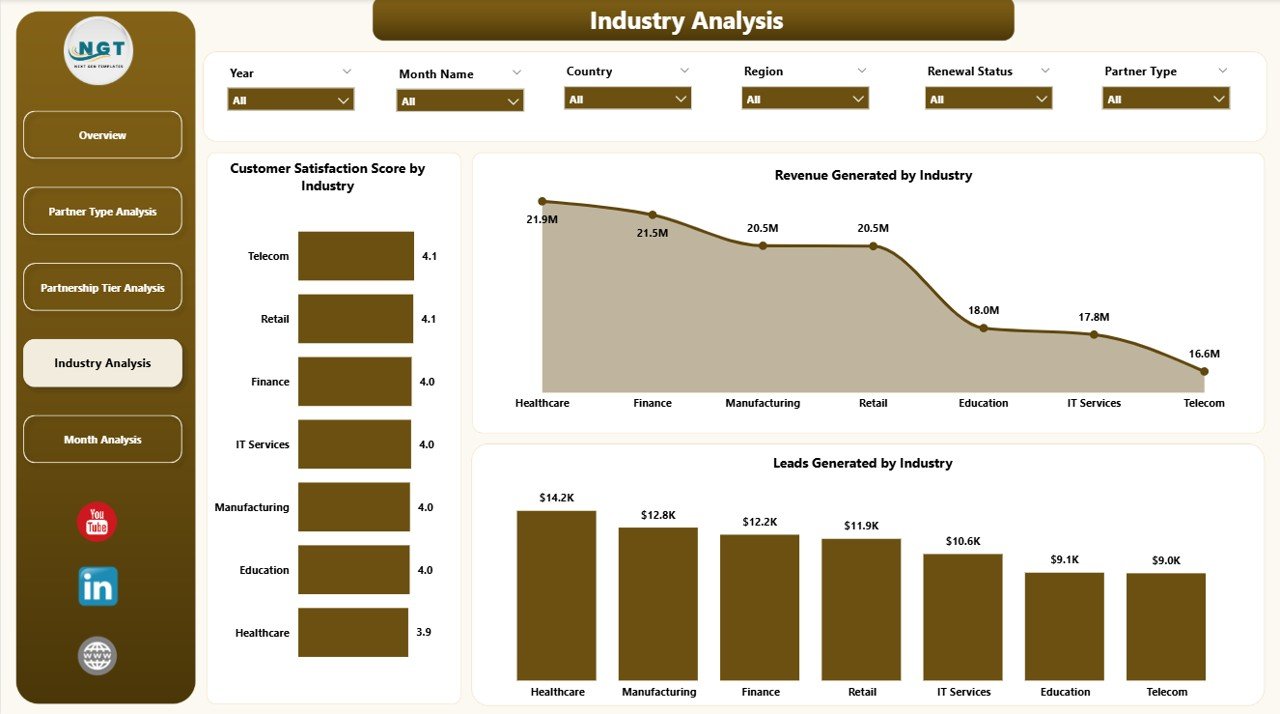
Partnership performance often varies by industry.
For example:
-
IT industry alliances may generate recurring revenue.
-
Healthcare partners may focus on long-term contracts.
-
Manufacturing alliances may generate seasonal leads.
Therefore, industry-level analysis becomes essential.
Charts Included:
-
Customer Satisfaction Score by Industry
-
Revenue Generated by Industry
-
Leads Generated by Industry
Because of this page, you can identify high-performing industries. Moreover, you can expand alliance efforts in profitable sectors.
5️⃣ Month Analysis – How Does Performance Change Over Time?
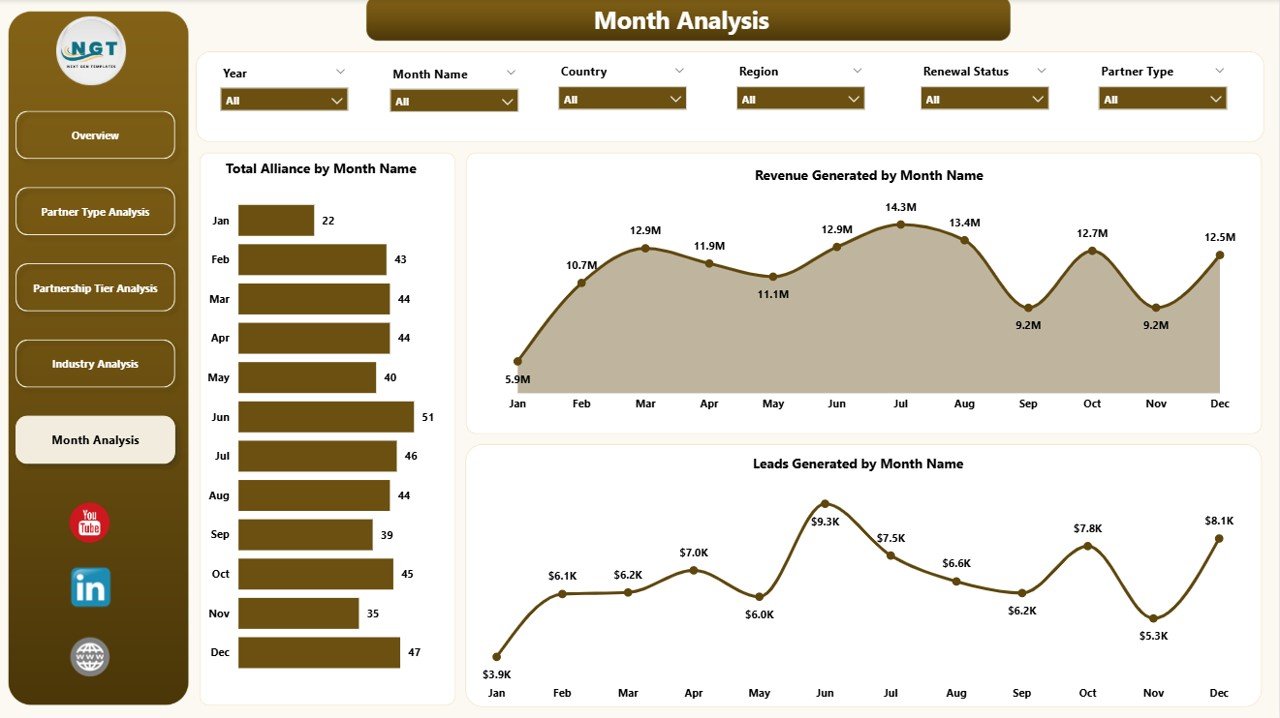
Trends matter. However, static numbers do not show progress.
Therefore, the Month Analysis page tracks:
-
Total Alliances by Month
-
Revenue Generated by Month
-
Leads Generated by Month
This page helps you identify:
-
Seasonal growth patterns
-
Revenue spikes
-
Lead generation trends
-
Slow months
As a result, you can align marketing campaigns and sales efforts accordingly.
Key KPIs to Track in a Partner Alliances Dashboard
Tracking the right KPIs ensures measurable growth.
Here are the most important metrics:
-
Customer Satisfaction Score (CSAT)
-
Active Alliance Percentage
-
Total Revenue from Partners
-
Revenue per Account Manager
-
Revenue per Country
-
Leads Generated
-
Revenue by Partner Type
-
Revenue by Tier
-
Industry Contribution %
-
Monthly Alliance Growth
Moreover, you can create calculated measures in Power BI using DAX to automate performance tracking.
Advantages of Partner Alliances Dashboard in Power BI
Now let us explore the benefits in detail.
1️⃣ Centralized Reporting
You can manage all alliance data in one Power BI file. Therefore, you eliminate scattered spreadsheets.
2️⃣ Real-Time Insights
Power BI refreshes data quickly. Consequently, you always view updated performance.
3️⃣ Better Decision-Making
Because the dashboard provides clear visuals, managers can make faster decisions.
4️⃣ Improved Accountability
When you track revenue by manager or region, accountability increases.
5️⃣ Enhanced Partner Strategy
Industry and tier analysis help you refine your partnership model.
6️⃣ Performance Transparency
Every stakeholder sees the same data. Therefore, confusion reduces.
7️⃣ Scalability
As partnerships grow, you can expand the dashboard without redesigning the structure.
Best Practices for the Partner Alliances Dashboard
To maximize results, follow these best practices.
1️⃣ Maintain Clean Data
Ensure you update partner data consistently. Remove duplicates. Standardize naming conventions.
2️⃣ Define Clear KPIs
Before building the dashboard, define measurable KPIs such as revenue targets and satisfaction benchmarks.
3️⃣ Use Consistent Tier Criteria
Avoid changing tier rules frequently. Instead, create clear qualification metrics.
4️⃣ Review Monthly Trends
Analyze monthly data regularly. Identify growth or decline patterns early.
5️⃣ Align Incentives with Insights
If one partner type generates higher revenue, adjust incentives accordingly.
6️⃣ Use Role-Based Access
Restrict sensitive revenue data if necessary. Power BI allows secure sharing.
7️⃣ Automate Data Refresh
Schedule refresh to ensure updated reporting without manual effort.
How Does This Dashboard Improve Alliance Strategy?
This dashboard improves strategy in multiple ways.
First, it identifies top-performing partners.
Second, it highlights weak areas.
Third, it supports data-driven conversations.
Fourth, it improves forecasting accuracy.
Therefore, companies move from reactive management to proactive alliance planning.
Who Can Use a Partner Alliances Dashboard in Power BI?
Click to Purchases Partner Alliances Dashboard in Power BI
This dashboard suits:
-
Alliance Managers
-
Sales Directors
-
Business Development Teams
-
Channel Managers
-
Marketing Leaders
-
Executive Leadership
Moreover, any organization that works with distributors, referral partners, resellers, or strategic collaborators can benefit.
Conclusion
Strategic partnerships play a critical role in business growth. However, without proper monitoring, companies lose visibility and direction.
A Partner Alliances Dashboard in Power BI provides clarity, control, and confidence. It centralizes data, visualizes performance, and enables better decisions. Moreover, it helps organizations track revenue, leads, satisfaction, tiers, industries, and monthly growth in one interactive solution.
Therefore, if you want to strengthen your alliance strategy, improve accountability, and boost revenue performance, this dashboard offers the perfect solution.
Data drives partnerships. Insight drives growth. And Power BI drives both.
Frequently Asked Questions with Answers
1️⃣ What is a Partner Alliances Dashboard in Power BI?
It is an interactive Power BI solution that tracks alliance performance, revenue, leads, satisfaction scores, and trends in one centralized dashboard.
2️⃣ Can I customize this dashboard?
Yes, you can modify KPIs, charts, filters, and DAX measures according to your business needs.
3️⃣ Does this dashboard support monthly analysis?
Yes, the Month Analysis page tracks alliances, revenue, and leads by month.
4️⃣ Which industries can use this dashboard?
Any industry that works with partners, distributors, or alliances can use it, including IT, healthcare, manufacturing, and consulting.
5️⃣ Is Power BI required to use this dashboard?
Yes, you need Power BI Desktop to view and modify the dashboard.
6️⃣ How often should I update the data?
You should update the data monthly or weekly, depending on your reporting cycle.
7️⃣ Does this dashboard help improve partner performance?
Yes, because it highlights strengths and weaknesses clearly, you can take corrective action quickly.
Visit our YouTube channel to learn step-by-step video tutorials