Running a pawnshop requires sharp decision-making. You manage loans, inventory, customer transactions, redemptions, defaults, and profit margins every single day. However, if you rely on scattered spreadsheets or manual calculations, you lose control quickly. As a result, small errors grow into big losses.
So, how can you monitor performance clearly and take fast action?
The answer is simple.
You need a Pawnshops KPI Dashboard in Excel.
Click to Purchases Pawnshops KPI Dashboard in Excel
This ready-to-use Excel template helps pawnshop owners, managers, and finance teams track all critical KPIs in one structured workbook. Moreover, it provides Month-to-Date (MTD) and Year-to-Date (YTD) insights instantly. Therefore, you can improve profitability, reduce risk, and strengthen cash flow without wasting time.
In this complete guide, you will learn:
-
What a Pawnshops KPI Dashboard in Excel is
-
Why pawnshops need structured KPI tracking
-
Detailed explanation of all 7 worksheets
-
Advantages of the Pawnshops KPI Dashboard in Excel
-
Best practices for implementation
-
Frequently asked questions with answers
Let us explore everything step by step.
What Is a Pawnshops KPI Dashboard in Excel?
A Pawnshops KPI Dashboard in Excel is a structured performance management system built inside Microsoft Excel. It tracks key performance indicators related to loans, inventory, revenue, customer behavior, and risk management.
Instead of juggling multiple files, you can:
-
Track MTD and YTD performance
-
Compare Actual vs Target results
-
Analyze Previous Year (PY) performance
-
Monitor loan redemption rates
-
Evaluate inventory turnover
-
Control default ratios
-
Improve profit margins
Moreover, the dashboard updates automatically when you select a month. Therefore, you can analyze business performance within seconds.
Why Do Pawnshops Need a KPI Dashboard?
Pawnshops operate in a fast-moving environment. Customers walk in daily with different items, loan amounts vary, redemption timelines differ, and inventory moves constantly. Because of this complexity, tracking performance manually creates confusion.
However, when you use a structured KPI dashboard:
-
You gain full visibility
-
You reduce financial risk
-
You improve loan recovery rates
-
You control operational costs
-
You increase profitability
In addition, data-driven decisions replace guesswork. As a result, you build a stronger and more stable pawnshop business.
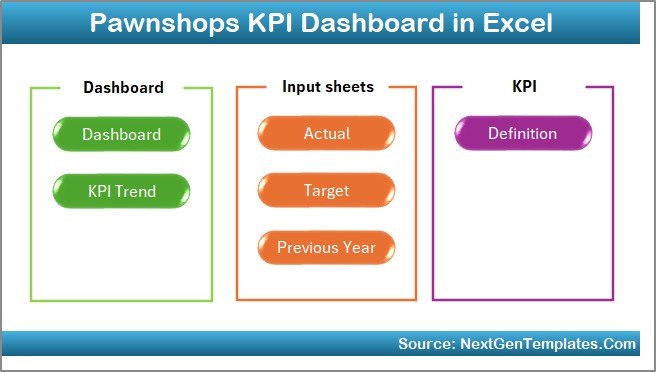
What Are the 7 Worksheets in the Pawnshops KPI Dashboard in Excel?
This ready-to-use template includes 7 structured worksheets. Each sheet plays a specific role. Let us understand them in detail.
1️⃣ Home Sheet – Your Navigation Center
The Home sheet works as an index page. It includes six interactive buttons that help you jump directly to the respective sheets.
Instead of scrolling through tabs, you can navigate quickly. Therefore, you save time and improve usability.
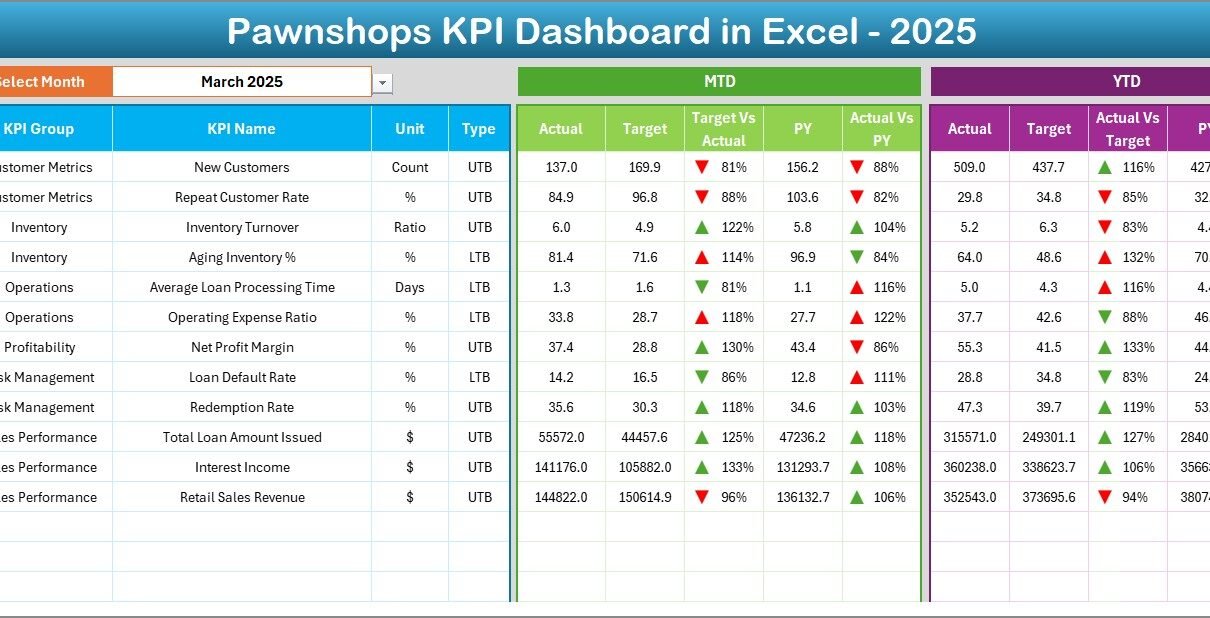
2️⃣ Dashboard Sheet Tab – The Main Performance View
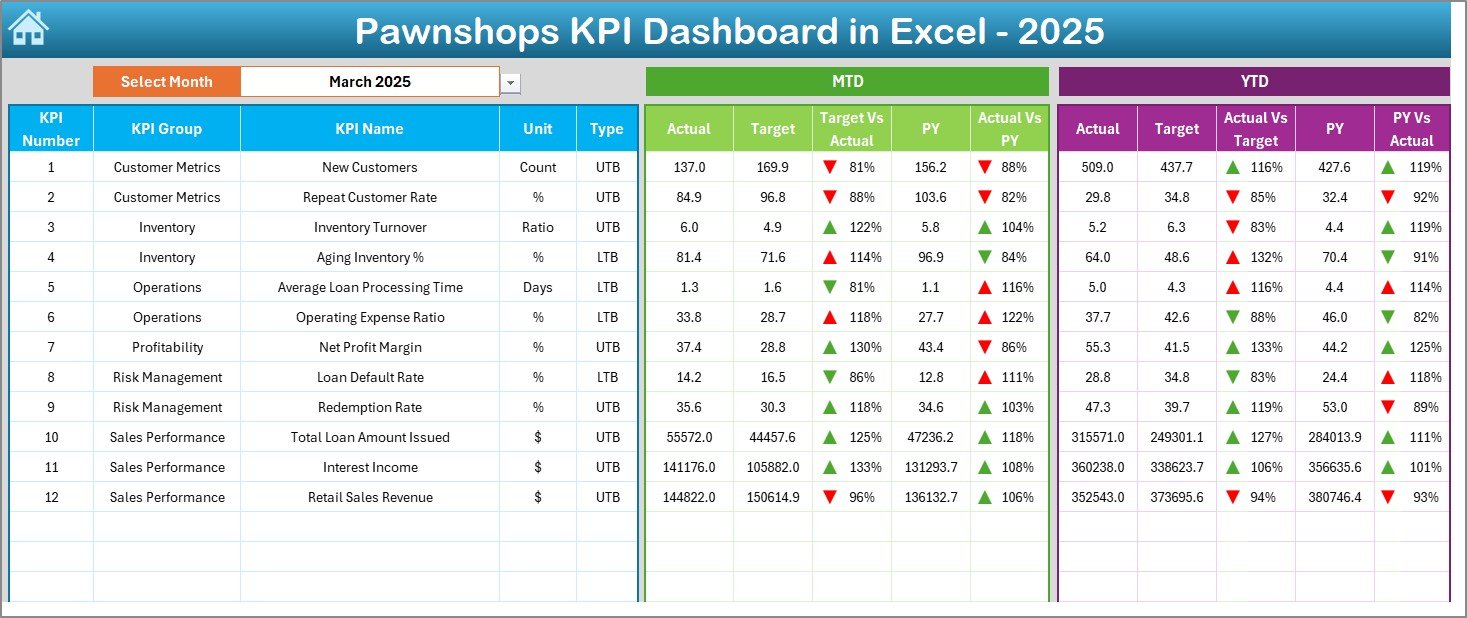
This sheet acts as the core of the entire system.
On cell D3, you can select the month from a drop-down list. Once you select a month, the entire dashboard updates instantly.
Here, you can see:
📊 MTD Performance Section
-
MTD Actual
-
MTD Target
-
MTD Previous Year
-
Target vs Actual comparison
-
Previous Year vs Actual comparison
-
Conditional formatting with up/down arrows
📈 YTD Performance Section
-
YTD Actual
-
YTD Target
-
YTD Previous Year
-
Target vs Actual analysis
-
PY vs Actual analysis
-
Visual indicators
Because of this structure, you can quickly identify:
-
Which KPIs meet targets
-
Which KPIs miss targets
-
Whether performance improves compared to last year
Therefore, you can take corrective action immediately.
Click to Purchases Pawnshops KPI Dashboard in Excel
3️⃣ KPI Trend Sheet Tab – Deep Performance Analysis
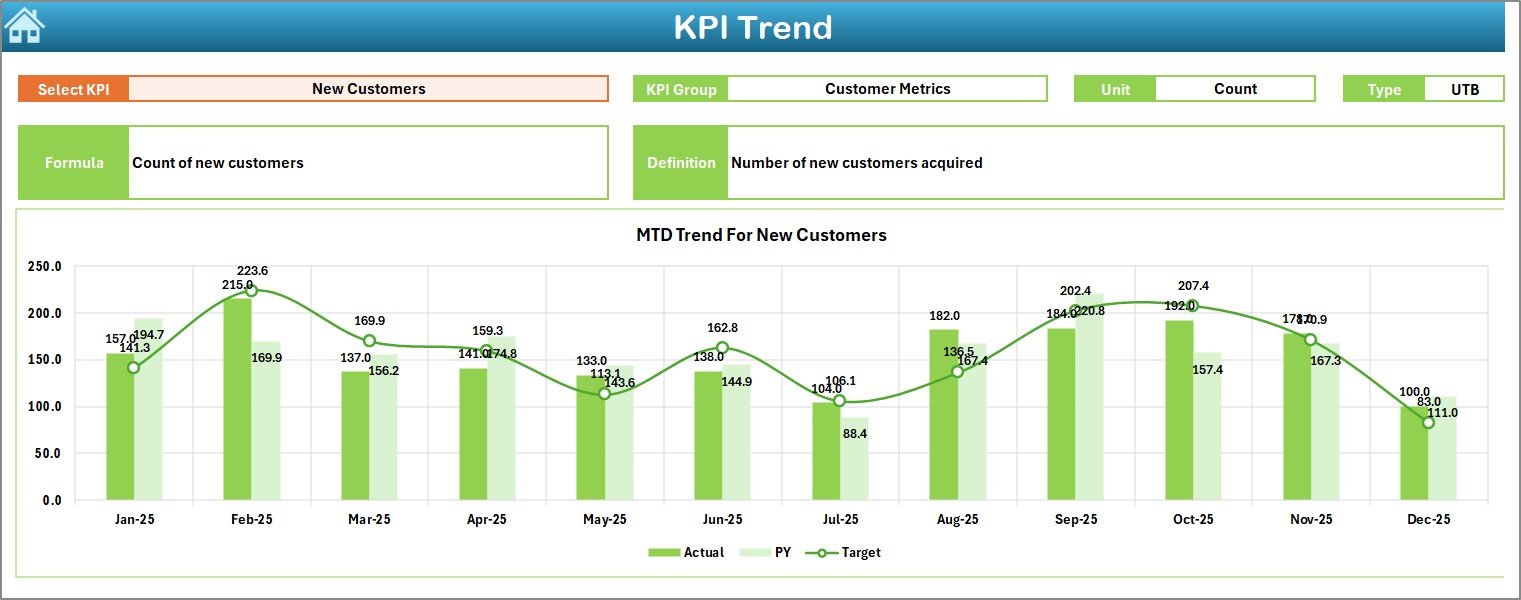
The KPI Trend sheet allows detailed KPI-level analysis.
On cell C3, you can select the KPI name from a drop-down list.
Once selected, the sheet displays:
-
KPI Group
-
Unit of KPI
-
Type (Lower the Better or Upper the Better)
-
Formula
-
KPI Definition
Additionally, you can see:
-
MTD trend chart (Actual, Target, PY)
-
YTD trend chart (Actual, Target, PY)
Therefore, instead of reviewing raw numbers, you can analyze trends visually. As a result, you detect patterns, seasonality, and risk signals early.
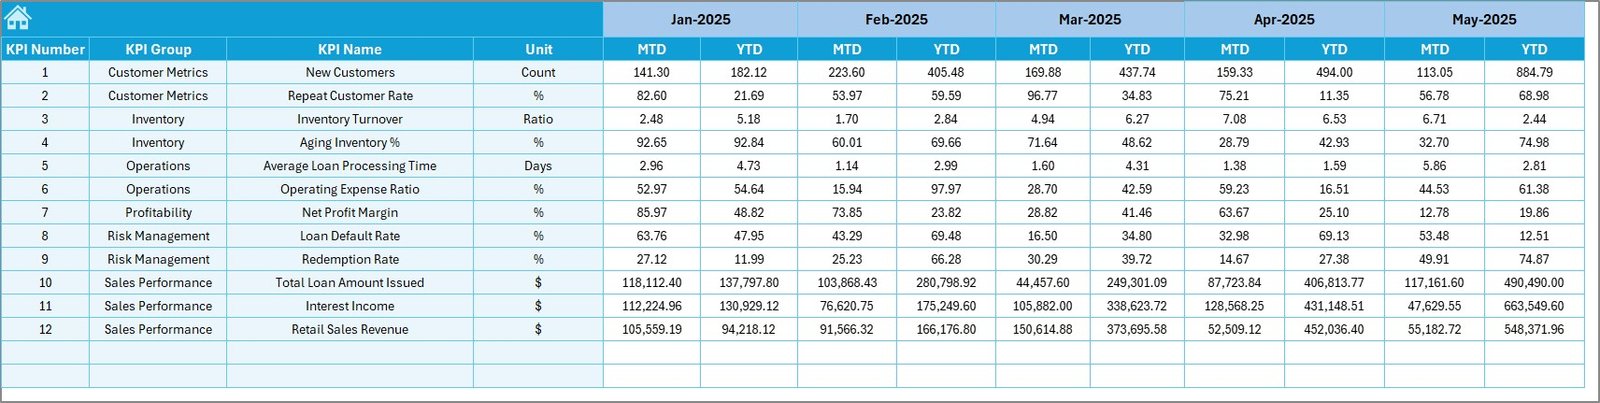
4️⃣ Actual Numbers Input Sheet – Enter Current Year Data
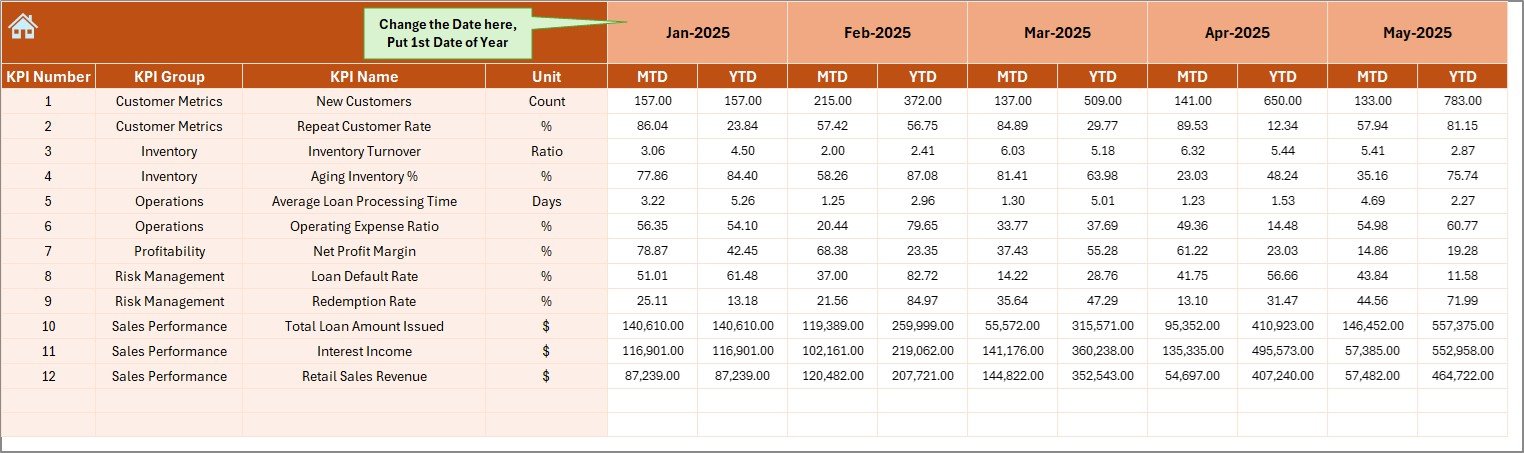
This sheet captures real performance numbers.
On cell E1, you define the first month of the financial year. After that, you simply enter MTD and YTD actual values for each KPI.
Because of this structured input design:
-
You avoid formula errors
-
You prevent accidental data damage
-
You maintain clean data
Moreover, the dashboard updates automatically once you enter values.
5️⃣ Target Sheet Tab – Set Performance Goals
In this sheet, you enter:
-
MTD target numbers
-
YTD target numbers
Targets help you measure success clearly. Without targets, you cannot evaluate performance properly.
Therefore, this sheet ensures accountability and growth tracking.
6️⃣ Previous Year Number Sheet – Historical Comparison
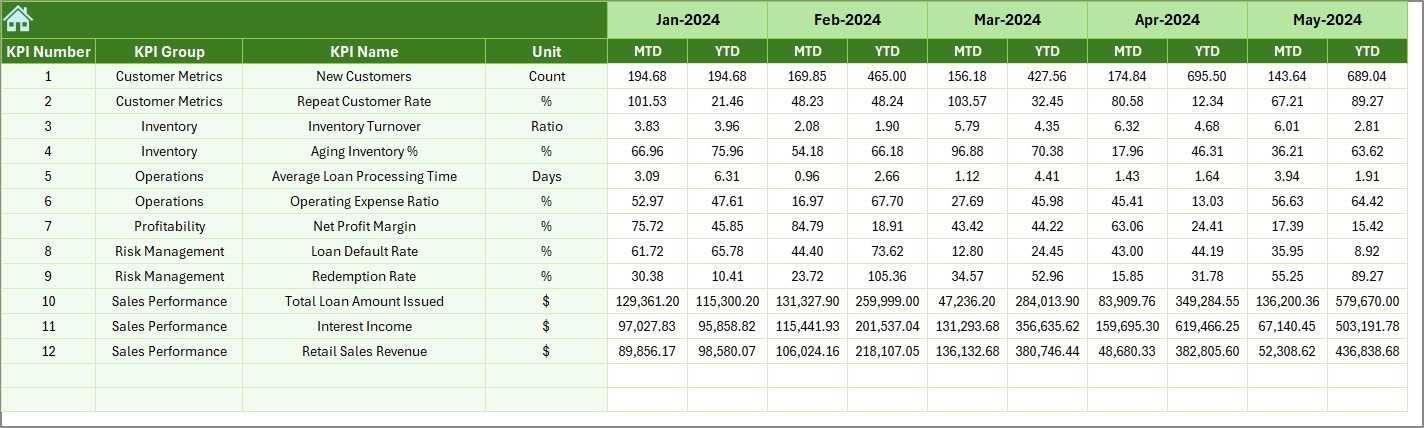
Here, you enter previous year numbers for each KPI.
Because of this data:
-
You measure growth accurately
-
You compare seasonal performance
-
You identify long-term improvement
As a result, you make strategic decisions based on trends instead of short-term fluctuations.
Click to Purchases Pawnshops KPI Dashboard in Excel
7️⃣ KPI Definition Sheet Tab – KPI Structure and Logic
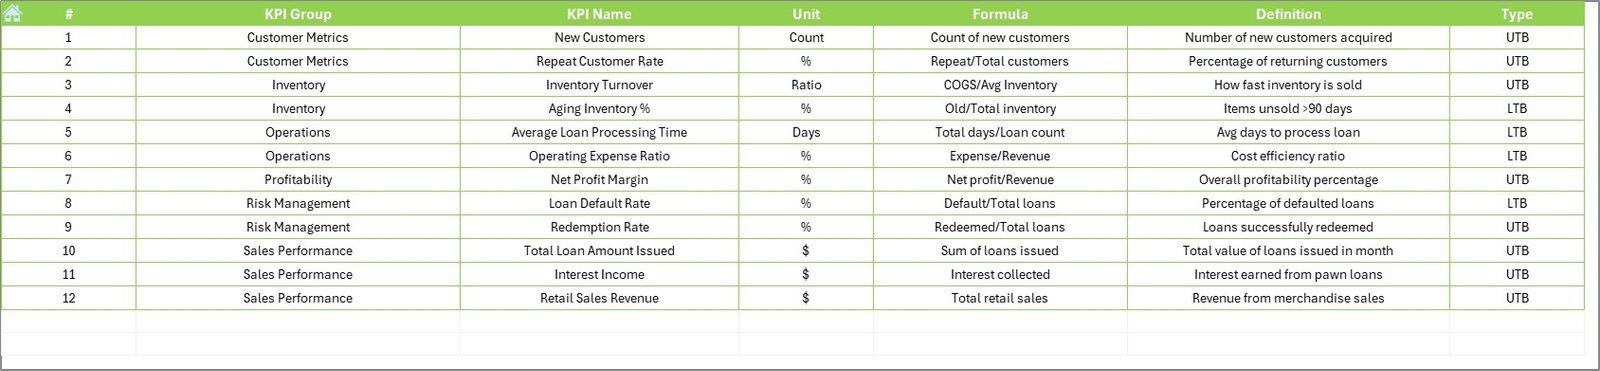
This sheet stores:
-
KPI Name
-
KPI Group
-
Unit
-
Formula
-
Definition
-
KPI Type (LTB or UTB)
This sheet acts as the backbone of the dashboard.
For example:
-
Loan Redemption Rate – UTB
-
Default Rate – LTB
-
Average Loan Amount – UTB
-
Inventory Holding Days – LTB
Because of this structure, users understand each KPI clearly. Therefore, confusion reduces significantly.
What KPIs Should a Pawnshop Track?
Although the template allows customization, common pawnshop KPIs include:
💰 Financial KPIs
-
Total Loan Disbursed
-
Interest Income
-
Total Revenue
-
Gross Profit Margin
-
Operating Cost Ratio
🔄 Operational KPIs
-
Loan Redemption Rate
-
Default Rate
-
Inventory Turnover
-
Average Loan Processing Time
👥 Customer KPIs
-
Repeat Customer Rate
-
New Customer Count
-
Customer Retention Rate
📦 Inventory KPIs
-
Inventory Value
-
Average Holding Days
-
Inventory Liquidation Rate
Tracking these KPIs ensures balanced growth.
Advantages of Pawnshops KPI Dashboard in Excel
Now let us explore the key advantages.
1️⃣ Complete Business Visibility
You see financial, operational, and customer KPIs in one place. Therefore, you eliminate blind spots.
2️⃣ Faster Decision-Making
Since the dashboard updates instantly, you do not waste time compiling reports.
3️⃣ Improved Profitability
When you track margins and defaults carefully, you reduce losses. As a result, profits increase.
4️⃣ Better Risk Management
Default rates and inventory holding days directly affect cash flow. This dashboard highlights risks early.
5️⃣ Easy Customization
Because it runs in Excel, you can modify KPIs according to your business needs.
6️⃣ Clear Trend Analysis
MTD and YTD charts help you understand patterns clearly.
7️⃣ No Technical Expertise Required
Anyone familiar with Excel can use it easily.
How Does MTD and YTD Tracking Improve Pawnshop Performance?
MTD tracking helps you monitor short-term results. Therefore, you detect problems within the current month.
On the other hand, YTD tracking shows long-term progress. Because of this, you evaluate strategic growth.
When you combine both:
-
You control daily operations
-
You measure yearly success
-
You align actions with targets
-
Click to Purchases Pawnshops KPI Dashboard in Excel
Best Practices for the Pawnshops KPI Dashboard in Excel
To maximize benefits, follow these best practices:
✅ 1. Enter Data Regularly
Update actual numbers monthly without delay.
✅ 2. Set Realistic Targets
Use historical data to define achievable targets.
✅ 3. Review Trends Monthly
Do not focus only on one month. Instead, analyze trends.
✅ 4. Monitor Risk KPIs Closely
Pay special attention to default rate and inventory holding days.
✅ 5. Train Staff
Ensure managers understand KPI definitions clearly.
✅ 6. Backup Data
Save copies regularly to avoid data loss.
How Can Pawnshop Owners Use This Dashboard for Growth?
You can use it for:
-
Branch performance comparison
-
Staff performance review
-
Cash flow forecasting
-
Loan portfolio analysis
-
Strategic planning
Moreover, you can present dashboard reports during management meetings. Therefore, discussions become data-driven and focused.
Who Should Use the Pawnshops KPI Dashboard in Excel?
This template works perfectly for:
-
Independent pawnshop owners
-
Multi-branch pawnshop chains
-
Finance managers
-
Operations managers
-
Business analysts
If you want structured performance monitoring, this dashboard fits your needs.
Conclusion
Pawnshops operate in a complex financial environment. You manage loans, inventory, customers, and cash flow simultaneously. Therefore, you need clarity and structure.
The Pawnshops KPI Dashboard in Excel provides exactly that.
It centralizes data.
It tracks MTD and YTD performance.
It compares Actual vs Target and Previous Year.
It highlights risk and opportunity.
Most importantly, it transforms numbers into actionable insights.
If you want to grow your pawnshop business with confidence, this dashboard becomes your performance control center.
Frequently Asked Questions with Answers
1️⃣ What is a Pawnshops KPI Dashboard in Excel?
It is a ready-to-use Excel template that tracks financial, operational, and customer KPIs for pawnshops.
2️⃣ Can I customize the KPIs?
Yes. You can add, modify, or remove KPIs easily using the KPI Definition sheet.
3️⃣ Do I need advanced Excel skills?
No. Basic Excel knowledge is enough to operate the dashboard.
4️⃣ How often should I update the data?
You should update data monthly. However, you can update more frequently if required.
5️⃣ Can I use this for multiple branches?
Yes. You can duplicate sheets or extend the data model to include branch-level tracking.
6️⃣ Does the dashboard support MTD and YTD comparison?
Yes. It shows MTD and YTD Actual, Target, and Previous Year comparisons with visual indicators.