Payroll plays a major role in every organization. It not only manages employee salaries but also ensures accurate payments, compliance, cost control, and financial transparency. Because companies handle thousands of salary transactions every month, teams need a clear and simple way to monitor payroll trends, employee performance, deductions, allowances, and payouts. A Payroll Management Dashboard in Power BI solves this need perfectly.
In this article, you will learn everything about creating and using a Payroll Management Dashboard in Power BI. You will see how it works, why companies depend on it, and what each dashboard page shows. You will also explore the advantages, best practices, and answers to common questions. So let’s begin and understand how Power BI transforms payroll reporting.
Click to Purchases Payroll Management Dashboard in Power BI
What Is a Payroll Management Dashboard in Power BI?
A Payroll Management Dashboard in Power BI is a ready-to-use reporting system that converts payroll data into simple, visual insights. It helps HR and finance teams track salaries, overtime, deductions, net pay, department spending, and branch-wise payroll performance. Instead of checking hundreds of Excel sheets or manual reports, teams view everything on a single screen.
The dashboard brings all payroll KPIs into one place. It shows trends by month, performance by employee group, and cost breakdown by location. As a result, leaders take fast and informed decisions about manpower planning, budgeting, and payroll optimization.
Why Do Companies Use a Payroll Dashboard?
Payroll involves many numbers and departments. It becomes difficult to track everything in traditional reports. Therefore, companies move toward dashboards because dashboards:
-
Organize data clearly
-
Reduce manual errors
-
Improve cost visibility
-
Give real-time insights
-
Support compliance and audits
-
Speed up decision-making
Since Power BI connects with HRMS, Excel, and ERP systems, you can refresh the dashboard instantly. It saves time and brings accuracy to payroll operations.
Key Features of the Payroll Management Dashboard in Power BI
We designed this dashboard with five powerful pages. Each page gives a different payroll view so you understand the complete story behind your data.
Let’s explore each page in detail.
1. Overview Page: What Insights Do You See on the Main Screen?
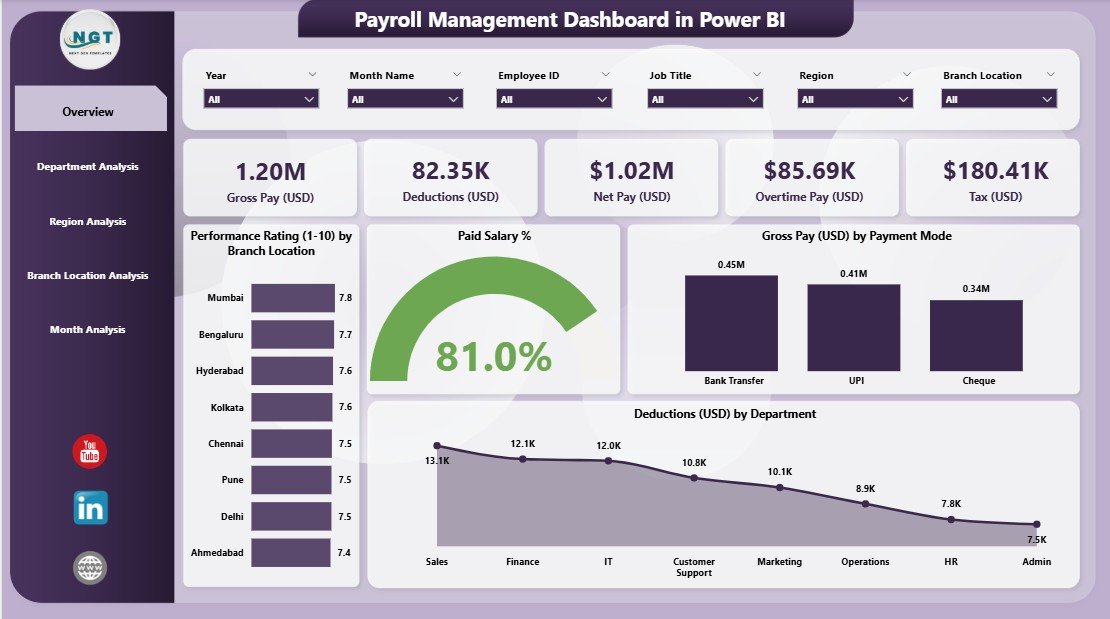
The Overview Page works as the main control center of the dashboard. It shows combined payroll insights so you understand the complete picture in just a few seconds.
Here, you will see:
✔ Four Important KPI Cards
These cards highlight the most important payroll metrics:
-
Total Paid Salary %
-
Gross Pay (USD)
-
Deduction (USD)
-
Performance Rating Score
Because these cards update instantly when you change filters, you view the exact status of payroll at any moment.
✔ Four Workload and Performance Charts
The main page includes:
-
Performance Rating by Branch Location
-
Paid Salary % by different categories
-
Gross Pay (USD) by Payment Mode
-
Deductions (USD) by Department
These visuals help you understand how payroll varies across departments, locations, and payment methods.
✔ Why This Page Matters
The Overview Page helps leaders find quick answers like:
-
Which branch performs better?
-
Which department receives the highest salary payout?
-
Which payment mode employees prefer the most?
-
How much salary companies deduct and why?
This page gives a strong starting point for deeper analysis.
2. Department Analysis: How Does Each Department Perform?
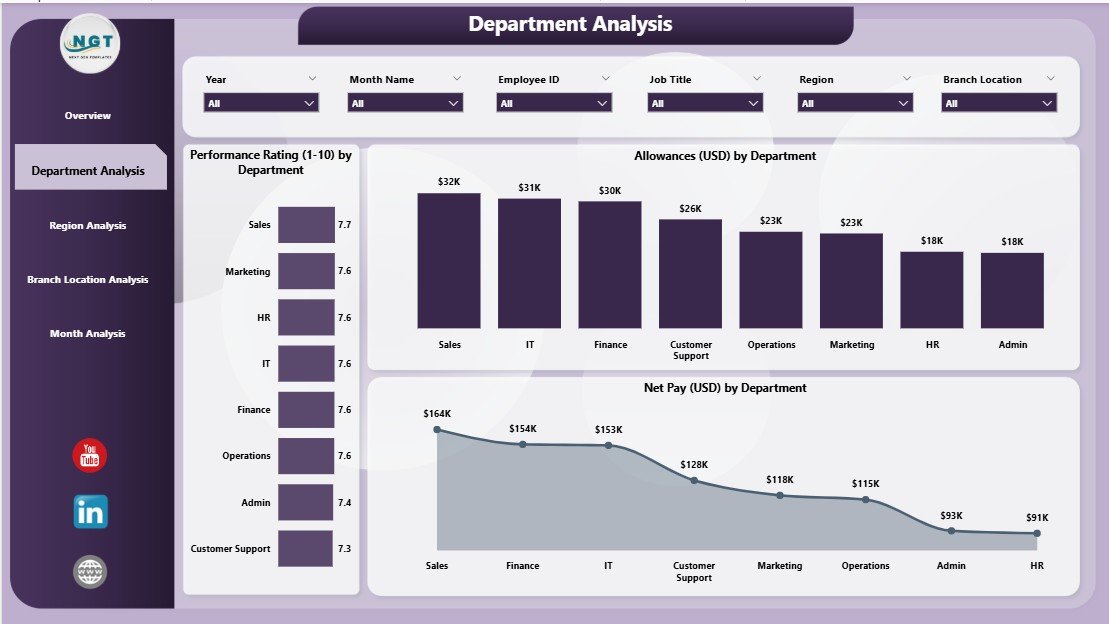
The Department Analysis Page gives a clear view of payroll distribution and workforce performance across departments. When HR teams want to analyze salary cost by team, this page becomes the most useful.
✔ Charts You Will See on This Page
-
Performance Rating by Department
-
Allowance (USD) by Department
-
Net Pay (USD) by Department
These visuals help you track both employee strength and payroll cost. Because departments vary in size and workload, this page brings clarity in comparing salary patterns.
✔ How This Page Helps
You can easily:
-
Identify high-performing teams
-
Compare allowance spending
-
Spot departments where salary cost increases
-
Measure employee productivity trends
This page supports budgeting and departmental manpower planning.
Click to Purchases Payroll Management Dashboard in Power BI
3. Region Analysis: What Does Payroll Look Like Across Regions?
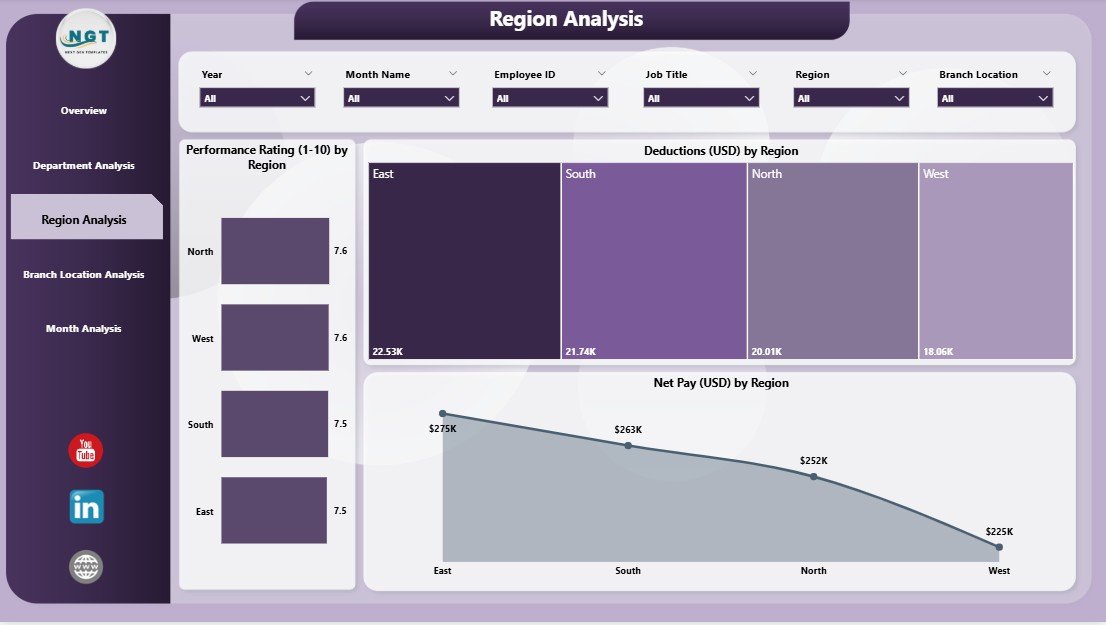
Organizations with multiple regions face different salary structures, living costs, and workforce sizes. The Region Analysis Page helps compare payroll performance across geographic regions.
✔ Three Key Charts
You will see:
-
Performance Rating by Region
-
Deduction (USD) by Region
-
Net Pay (USD) by Region
These charts tell you how each region performs and how much salary companies spend there.
✔ Why This View Is Important
Regional analysis helps you:
-
Understand pay variations
-
Spot deduction-related issues
-
Compare net pay distribution
-
Monitor region-wise productivity
Because regions operate differently, this page helps you improve policies and manage pay gaps.
4. Branch Location Analysis: How Do Branches Differ in Payroll Spending?
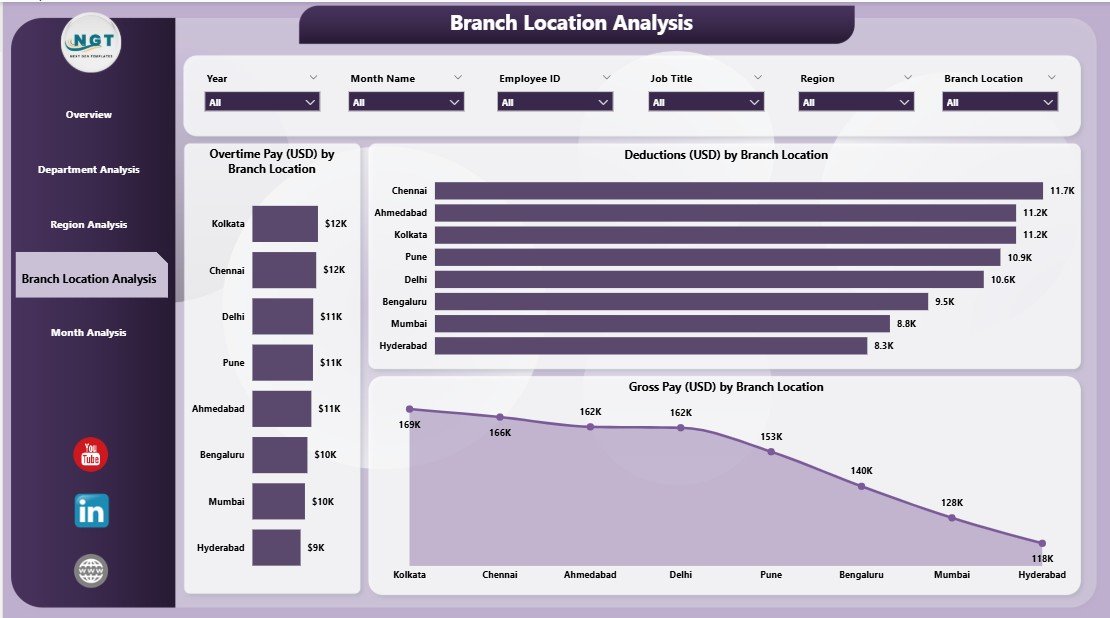
Branches operate with different employee sizes, overtime requirements, and workload. The Branch Location Analysis Page shows branch-level payroll performance.
✔ Charts Included on This Page
-
Overtime Pay (USD) by Branch Location
-
Deduction (USD) by Branch Location
-
Gross Pay (USD) by Branch Location
These visuals highlight how workload and compensation vary across branches.
✔ How This Page Adds Value
This page helps you:
-
Track branches with high overtime
-
Compare salary spending patterns
-
Understand branch workforce distribution
-
Improve staffing decisions
If any branch has sudden overtime or deduction spikes, you quickly identify and resolve the issue.
5. Monthly Trends: How Do Payroll Patterns Change Over Time?
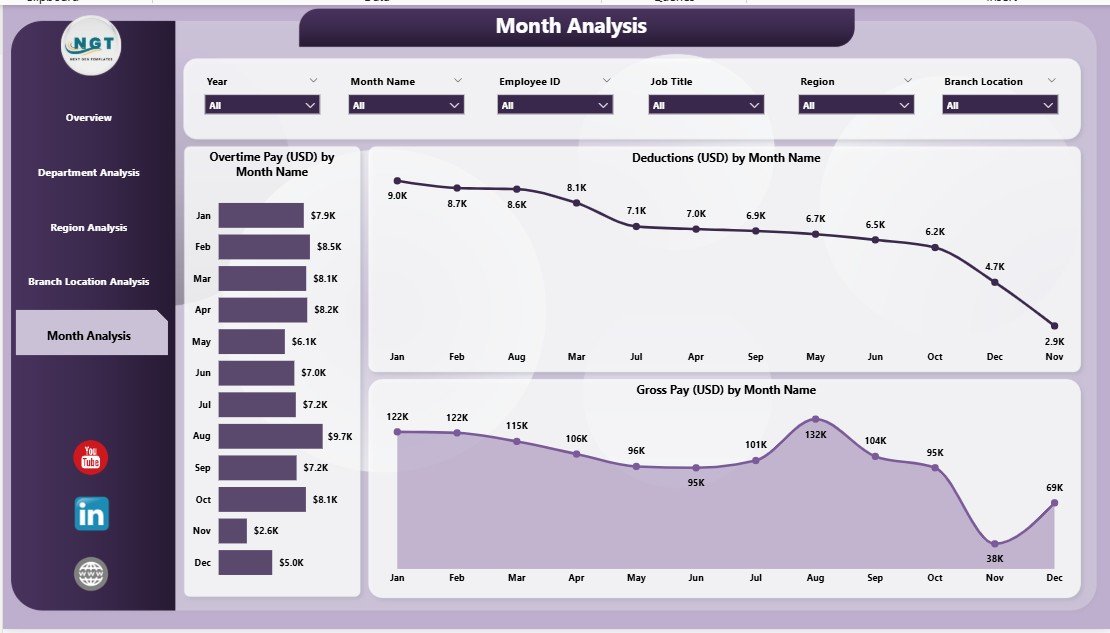
Payroll changes month by month because of hiring, resignations, overtime, and seasonal workloads. The Monthly Trends Page helps you track these month-wise changes clearly.
✔ Trend Charts You Will See
-
Overtime Pay (USD) by Month
-
Deduction (USD) by Month
-
Gross Pay (USD) by Month
These charts reveal patterns and help you forecast future budgets.
✔ What You Learn from This Page
You can easily analyze:
-
Salary trends across months
-
Seasonal overtime patterns
-
Changes in deductions and allowances
-
Yearly cost forecasting
This page works as a financial planning tool for HR and finance teams.
Advantages of a Payroll Management Dashboard in Power BI
A Payroll Management Dashboard gives many benefits. Let’s explore how it improves payroll management.
1. Clear and Simple Reporting
Teams get a clean visual summary of all payroll activities. They no longer spend hours searching through spreadsheets.
2. Better Decision-Making
The dashboard helps leaders make fast and accurate decisions because they see all payroll KPIs in one place.
3. Reduced Manual Errors
Power BI refreshes data directly from the source systems, so mistakes reduce and accuracy improves.
4. Strong Compliance Support
Payroll regulations demand transparency. The dashboard supports audits and compliance checks with clear visuals.
5. Real-Time Monitoring
You see salary changes and cost shifts instantly. This helps you control unnecessary spending.
6. Department & Region Comparison
Comparative insights support budgeting, manpower planning, and fairness in salary structure.
7. Helps Forecast Future Payroll Costs
Trend charts help predict upcoming expenses, bonuses, and overtime peaks.
Best Practices for Using a Payroll Management Dashboard in Power BI
Click to Purchases Payroll Management Dashboard in Power BI
To get maximum value from your dashboard, follow these best practices.
1. Keep Data Clean and Updated
Accurate data gives accurate insights. Always maintain clean payroll data.
2. Use Consistent KPI Definitions
Define KPIs like net pay, overtime, and deductions clearly so teams understand them in the same way.
3. Refresh Data Regularly
Schedule automatic data refresh to monitor daily or monthly changes.
4. Use Filters and Slicers Wisely
Filters help you focus on specific departments, regions, or months. Use them to explore deeper insights.
5. Compare Trends Over Time
Monthly and yearly trends help you understand long-term performance.
6. Use Role-Level Security
Protect sensitive payroll information by assigning access levels only to required staff.
7. Train Your HR & Finance Teams
Make sure employees understand how to read dashboards and use insights in decision-making.
How Does a Payroll Dashboard Support HR & Finance Teams?
A well-designed payroll dashboard supports both HR and finance teams by:
-
improving accountability
-
controlling salary budgets
-
forecasting future manpower costs
-
reducing errors and delays
-
aligning payroll with HR strategy
Because dashboards present insights visually, teams understand data quickly and take action faster.
Conclusion
A Payroll Management Dashboard in Power BI brings clarity, accuracy, and speed to payroll operations. It removes guesswork, organizes complex data, and presents insights in a clean visual format. With five powerful pages—Overview, Department Analysis, Region Analysis, Branch Location Analysis, and Monthly Trends—companies gain complete visibility into payroll performance.
This dashboard not only improves reporting but also supports better decision-making, cost optimization, and compliance. HR and finance teams rely on it to ensure fair, accurate, and timely payroll management.
Frequently Asked Questions (FAQs)
1. What is the purpose of a Payroll Management Dashboard in Power BI?
It helps HR and finance teams monitor salaries, deductions, allowances, overtime, department performance, and monthly payroll trends in a simple visual format.
2. Who uses a payroll dashboard?
HR managers, finance teams, payroll specialists, auditors, and senior leadership use this dashboard for decision-making and reporting.
3. Does this dashboard update automatically?
Yes. You can connect Power BI to HR or payroll systems and set automatic refresh schedules.
4. Can I customize the dashboard?
Yes. You can add new KPIs, modify visuals, or connect additional data sources as per business needs.
5. How does it help during audits?
The dashboard offers transparent, clear, and organized payroll data. Auditors use it to verify transactions and compliance.
6. Can small companies use a payroll dashboard?
Yes. Organizations of all sizes benefit from payroll dashboards because they simplify reporting and improve accuracy.
7. Does this dashboard replace payroll software?
No. It enhances your payroll software by turning raw data into useful insights.
Visit our YouTube channel to learn step-by-step video tutorials