The pet care industry continues to grow rapidly. Pet owners now demand grooming, boarding, daycare, training, and veterinary services with high quality and consistency. Therefore, pet care businesses must track performance clearly and regularly.
However, many pet service providers still depend on scattered spreadsheets. As a result, they struggle to monitor revenue, bookings, customer satisfaction, repeat visits, and service efficiency in one place.
So, how can you manage your pet care business more professionally?
The answer is simple.
You need a Pet Care Services KPI Dashboard in Excel.
This ready-to-use Excel dashboard helps pet grooming salons, boarding centers, veterinary clinics, pet daycare facilities, and training institutes monitor key performance indicators (KPIs) in one structured system. Moreover, it provides real-time monthly and yearly comparisons. Consequently, you gain better control, faster insights, and smarter decision-making.
In this comprehensive guide, you will learn:
-
What a Pet Care Services KPI Dashboard in Excel is
-
Why pet businesses need KPI tracking
-
Detailed explanation of all 7 worksheets
-
Important KPIs for pet care businesses
-
Advantages of Pet Care Services KPI Dashboard in Excel
-
Best Practices for the Pet Care Services KPI Dashboard in Excel
-
Frequently Asked Questions
Let us explore everything step by step.
Click to Purchases Pet Care Services KPI Dashboard in Excel
📊 What Is a Pet Care Services KPI Dashboard in Excel?
A Pet Care Services KPI Dashboard in Excel is a structured performance management tool. It collects, organizes, and analyzes important business metrics in one interactive Excel workbook.
Instead of checking multiple reports, you can view:
-
Monthly revenue performance
-
Booking trends
-
Customer satisfaction scores
-
Target vs actual comparisons
-
Year-over-year growth
Furthermore, the dashboard uses automated formulas, drop-down selections, and visual indicators. Therefore, you can track performance quickly without manual calculations.
🐶 Why Do Pet Care Businesses Need KPI Tracking?
The pet care industry involves many moving parts. For example:
-
Grooming appointments
-
Boarding occupancy rates
-
Vet consultations
-
Product sales
-
Staff performance
-
Customer retention
If you fail to track these metrics, you lose visibility. Consequently, you cannot identify growth opportunities or operational problems.
Here’s Why KPI Tracking Matters:
-
It improves financial control
-
It increases operational efficiency
-
It supports data-driven decisions
-
It reduces manual reporting time
-
It enhances customer satisfaction
Moreover, when you compare actual numbers with targets, you understand whether your business moves in the right direction.
Click to Purchases Pet Care Services KPI Dashboard in Excel
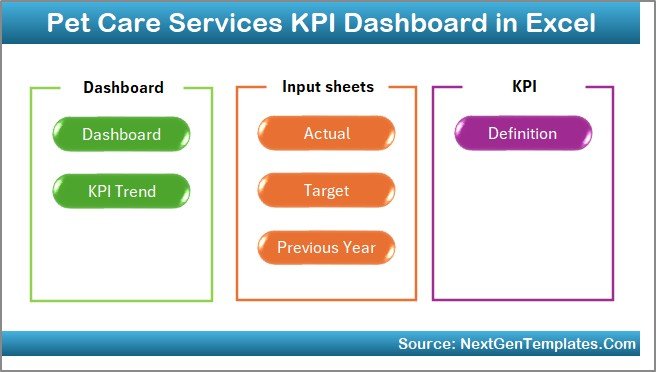
📁 What Are the 7 Worksheets in the Pet Care Services KPI Dashboard in Excel?
This ready-to-use template contains 7 powerful worksheets. Each sheet serves a specific purpose.
Let us explore them one by one.
1️⃣ Home Sheet – Your Navigation Center
The Home Sheet works as an index page.
Here, you get:
-
6 navigation buttons
-
Quick access to all sheets
-
Clean and structured layout
Therefore, you can move between sheets without confusion. This design improves user experience and saves time.
Click to Purchases Pet Care Services KPI Dashboard in Excel
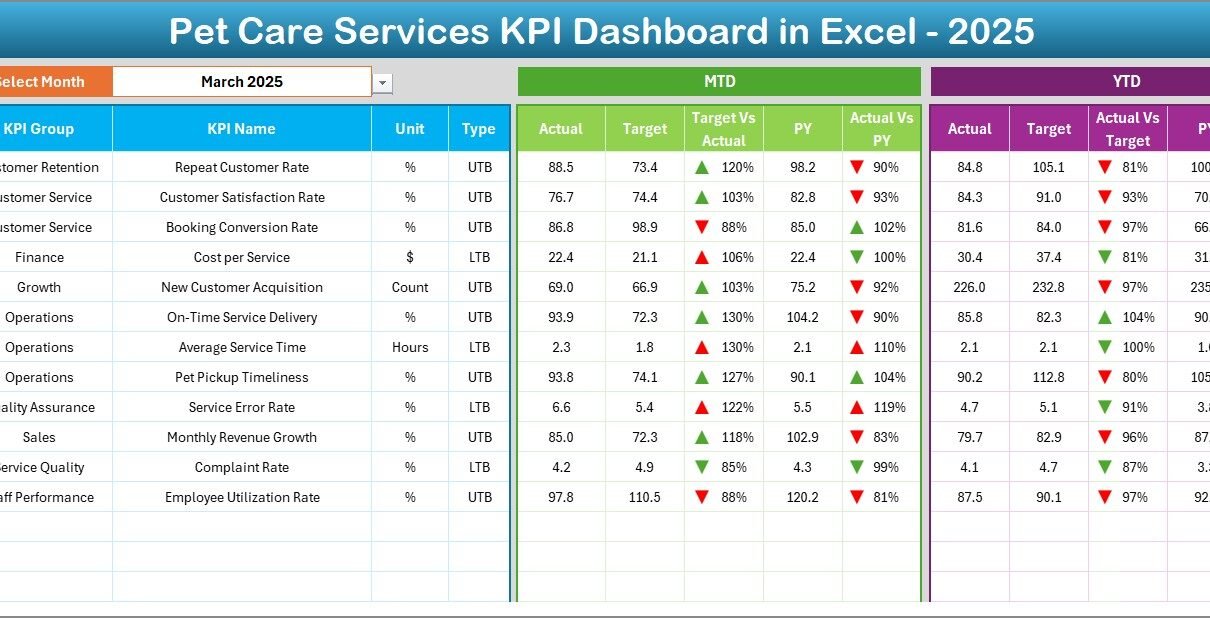
2️⃣ Dashboard Sheet – Where All KPIs Come Together
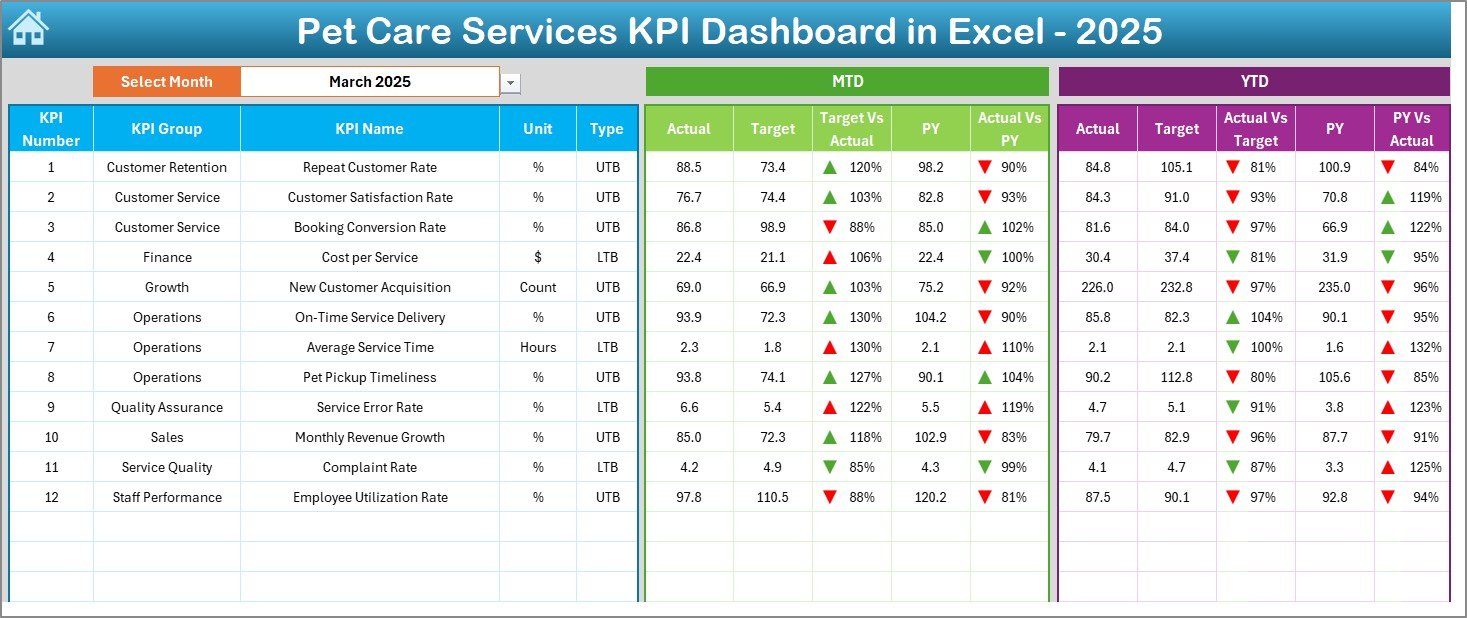
This sheet acts as the heart of the dashboard.
What Does It Show?
On cell D3, you can select the month from a drop-down menu. Once you select a month, the entire dashboard updates automatically.
It Displays:
-
MTD (Month-To-Date) Actual
-
MTD Target
-
MTD Previous Year
-
Target vs Actual comparison
-
Previous Year vs Actual comparison
-
YTD (Year-To-Date) Actual
-
YTD Target
-
YTD Previous Year
Additionally, the dashboard uses:
-
Conditional formatting
-
Up and down arrows
-
Visual indicators
Therefore, you can instantly identify whether performance improves or declines.
Click to Purchases Pet Care Services KPI Dashboard in Excel
3️⃣ KPI Trend Sheet – Deep Performance Analysis
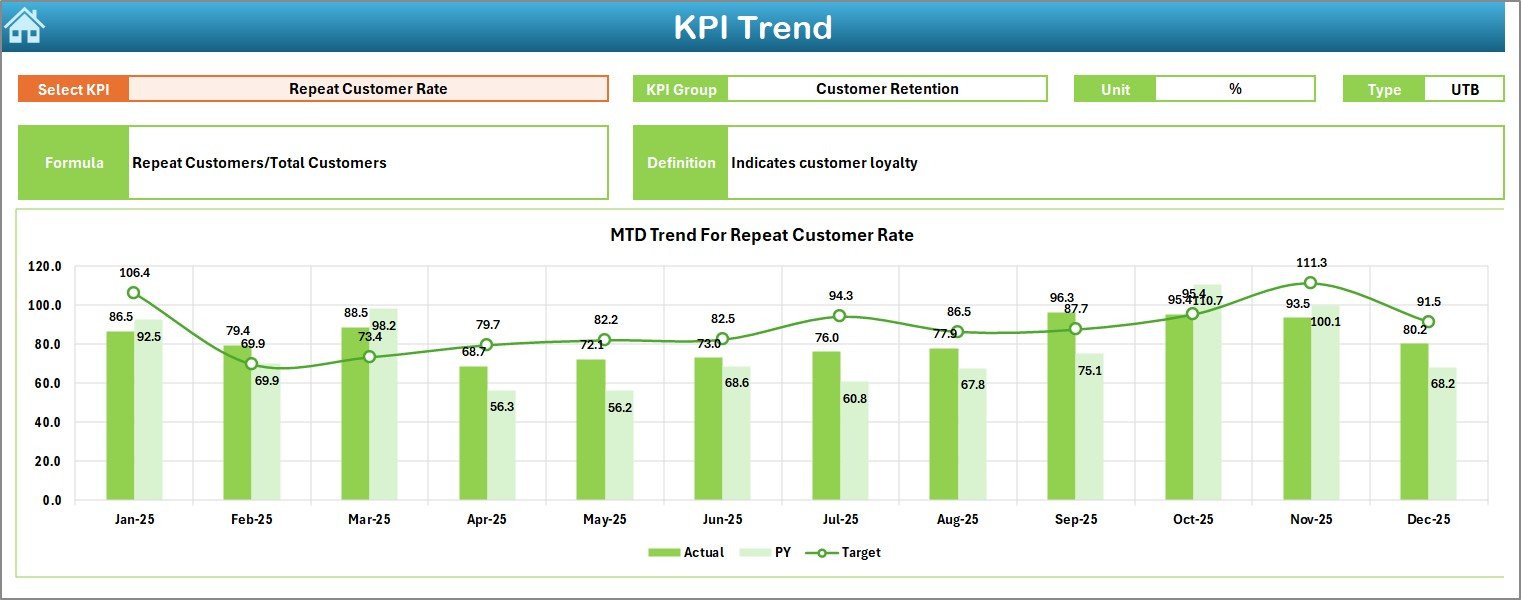
The KPI Trend Sheet allows detailed KPI analysis.
On cell C3, you can select a specific KPI.
Once selected, the sheet shows:
-
KPI Group
-
Unit of Measurement
-
KPI Type (Lower the Better or Upper the Better)
-
KPI Formula
-
KPI Definition
Moreover, it displays:
-
MTD Trend Chart
-
YTD Trend Chart
-
Actual vs Target vs Previous Year comparison
Therefore, you can track patterns and identify seasonal trends.
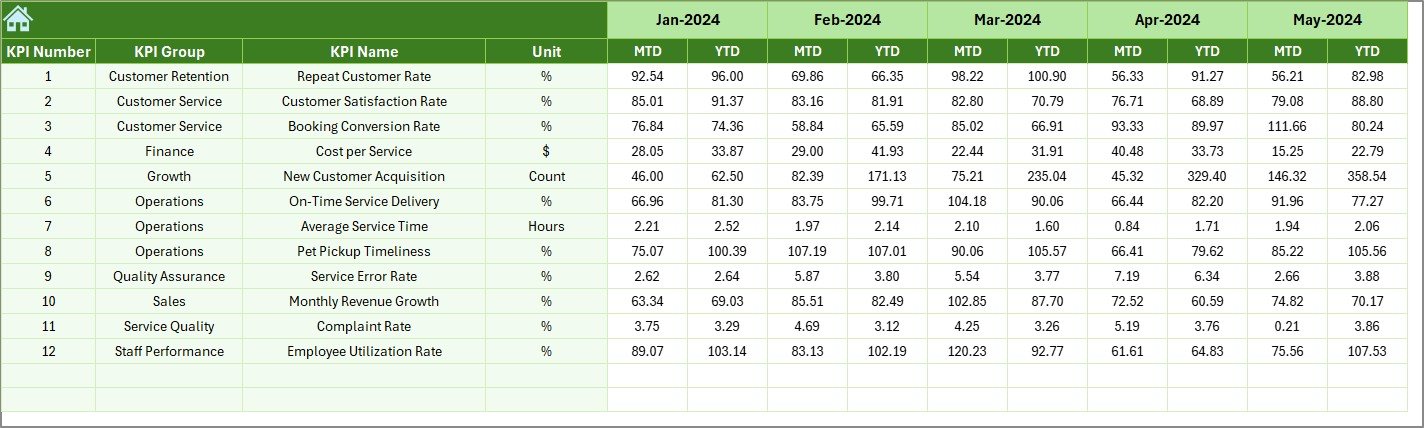
4️⃣ Actual Numbers Input Sheet – Enter Current Year Data
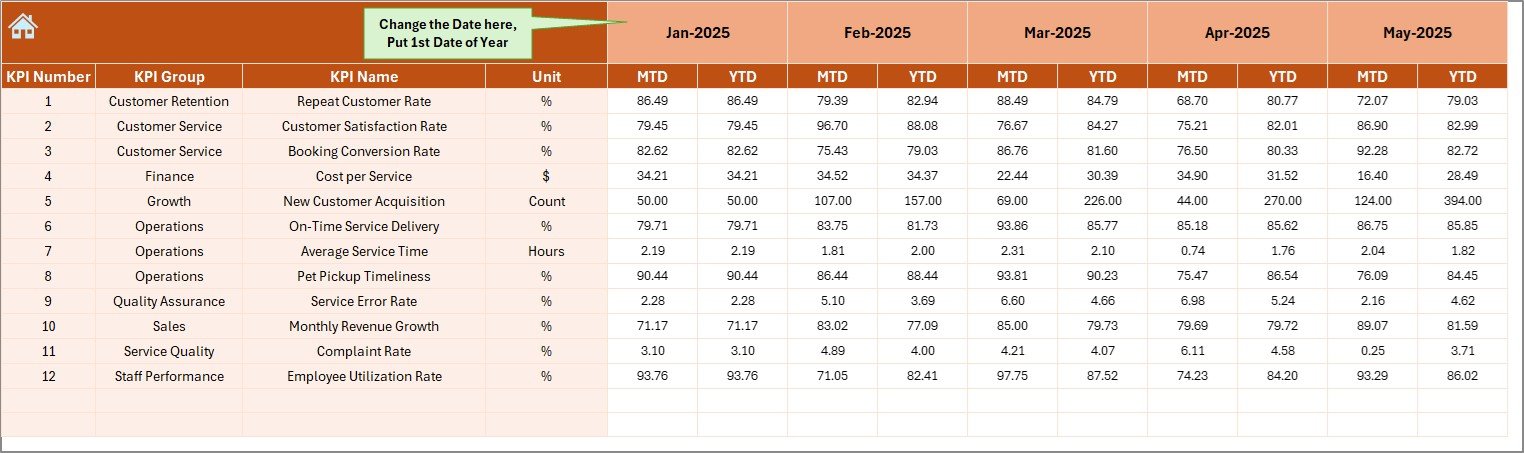
In this sheet, you enter:
-
MTD Actual numbers
-
YTD Actual numbers
On cell E1, you enter the first month of the year. After that, the system calculates the rest automatically.
Because of this structure, data entry becomes simple and organized.
5️⃣ Target Sheet – Define Your Business Goals
This sheet allows you to enter:
-
Monthly targets
-
YTD targets
When you set realistic targets, you create measurable goals. Consequently, you can track progress more effectively.
Click to Purchases Pet Care Services KPI Dashboard in Excel
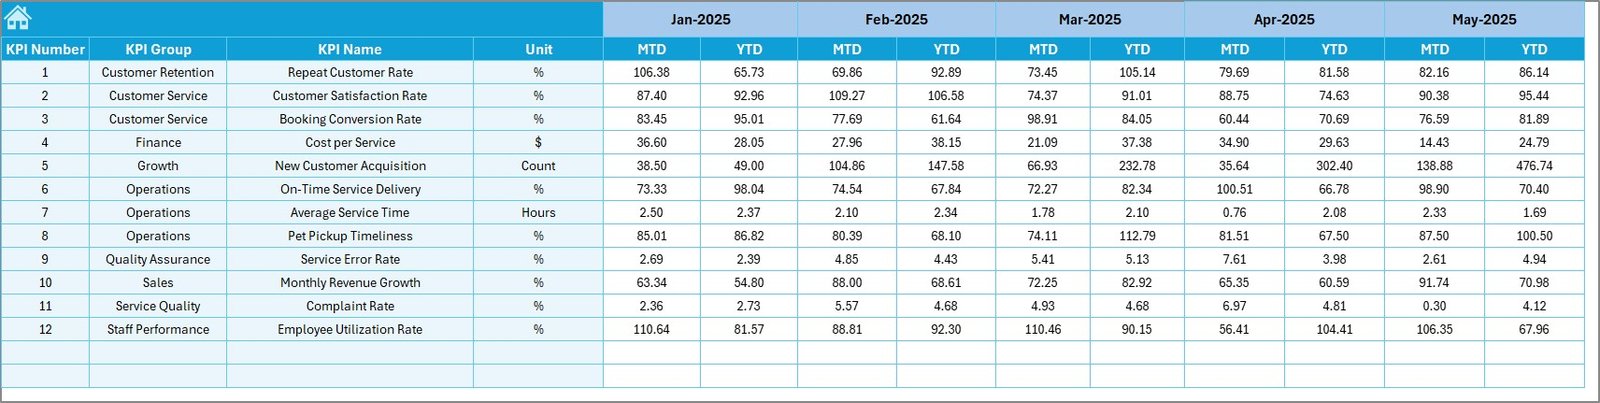
6️⃣ Previous Year Number Sheet – Year-on-Year Comparison
Here, you enter last year’s numbers.
When you compare current performance with previous year data, you:
-
Identify growth
-
Detect performance gaps
-
Understand seasonal trends
Therefore, this sheet strengthens long-term analysis.
7️⃣ KPI Definition Sheet – KPI Structure & Clarity
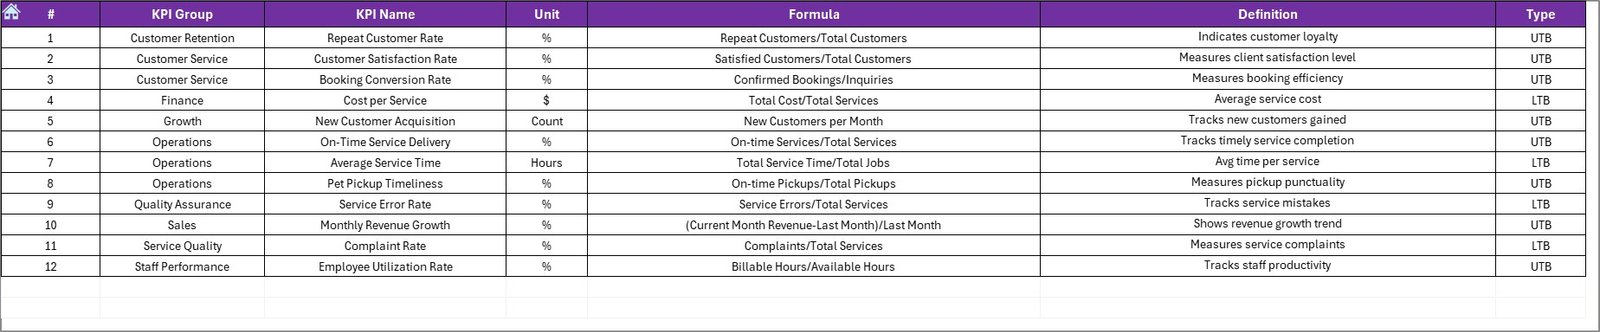
This sheet stores:
-
KPI Name
-
KPI Group
-
Unit
-
Formula
-
Definition
Because of this structure, your dashboard remains organized and standardized.
Click to Purchases Pet Care Services KPI Dashboard in Excel
🐕 What Are the Important KPIs for Pet Care Services?
A pet care business must track both financial and operational metrics.
Below are key KPIs you should include:
Financial KPIs
-
Total Revenue
-
Revenue per Service
-
Revenue per Customer
-
Average Transaction Value
-
Profit Margin
Operational KPIs
-
Appointment Utilization Rate
-
Boarding Occupancy Rate
-
Service Completion Time
-
Staff Productivity
Customer KPIs
-
Customer Retention Rate
-
Repeat Visit Rate
-
Customer Satisfaction Score
-
Net Promoter Score (NPS)
Marketing KPIs
-
Cost per Acquisition
-
Lead Conversion Rate
-
Online Booking Rate
When you track these KPIs consistently, you gain complete visibility over your business.
🚀 How Does This Dashboard Improve Decision-Making?
This dashboard supports decision-making in several ways.
1️⃣ Quick Visibility
Instead of reviewing multiple files, you see all KPIs in one screen.
2️⃣ Clear Comparisons
You compare:
-
Actual vs Target
-
Actual vs Previous Year
Therefore, you understand performance gaps instantly.
3️⃣ Data-Driven Planning
When trends show decline, you take corrective action quickly. Moreover, when numbers improve, you can scale operations confidently.
Click to Purchases Pet Care Services KPI Dashboard in Excel
⭐ Advantages of Pet Care Services KPI Dashboard in Excel
The Pet Care Services KPI Dashboard in Excel offers many benefits.
✅ 1. Centralized Performance Monitoring
You track all KPIs in one structured file.
✅ 2. Easy to Use
Excel-based design ensures accessibility for all users.
✅ 3. Automated Calculations
Formulas calculate MTD and YTD values automatically.
✅ 4. Visual Insights
Conditional formatting and charts highlight performance trends.
✅ 5. Year-over-Year Analysis
Previous year comparison helps strategic planning.
✅ 6. Scalable Structure
You can customize KPIs based on your business size.
Click to Purchases Pet Care Services KPI Dashboard in Excel
🛠️ Best Practices for the Pet Care Services KPI Dashboard in Excel
To maximize dashboard effectiveness, follow these best practices.
✔️ 1. Update Data Regularly
Enter actual numbers at the end of each month.
✔️ 2. Set Realistic Targets
Do not set unrealistic targets. Instead, use historical data to define achievable goals.
✔️ 3. Review Trends Monthly
Analyze trend charts regularly. Consequently, you identify issues early.
✔️ 4. Monitor Low-Performing KPIs
Focus on KPIs with negative indicators.
✔️ 5. Train Your Team
Ensure staff understand KPI definitions and targets.
✔️ 6. Customize When Needed
Adjust KPIs based on service expansion or market changes.
📈 How Can Pet Businesses Use This Dashboard for Growth?
Pet businesses can use this dashboard for:
-
Expansion planning
-
Pricing strategy evaluation
-
Staff performance analysis
-
Service optimization
-
Marketing ROI tracking
When you consistently review KPIs, you identify growth opportunities faster.
🏁 Conclusion
The pet care industry continues to expand. Therefore, businesses must adopt structured performance management systems.
The Pet Care Services KPI Dashboard in Excel provides:
-
Clear KPI tracking
-
Automated comparisons
-
Trend analysis
-
Target monitoring
-
Year-over-year evaluation
Moreover, it simplifies reporting and improves strategic planning.
If you want to grow your pet grooming salon, veterinary clinic, boarding facility, or daycare center, this dashboard will transform your performance tracking approach.
Now is the time to move from scattered spreadsheets to structured insights.
Click to Purchases Pet Care Services KPI Dashboard in Excel
❓ Frequently Asked Questions (FAQs)
1. What type of pet businesses can use this dashboard?
Pet grooming salons, boarding centers, veterinary clinics, pet daycare facilities, and training institutes can use it.
2. Do I need advanced Excel skills to use this dashboard?
No. You only need basic Excel knowledge to enter data and select months.
3. Can I customize the KPIs?
Yes. You can modify KPI names, groups, and formulas based on your business model.
4. How often should I update the dashboard?
You should update it monthly for accurate MTD and YTD tracking.
5. Does this dashboard support year-over-year comparison?
Yes. The Previous Year sheet allows complete year-over-year analysis.
6. Can I use this dashboard for multiple branches?
Yes. You can duplicate sheets or add branch-level KPIs for multi-location tracking.
Click to Purchases Pet Care Services KPI Dashboard in Excel
Visit our YouTube channel to learn step-by-step video tutorials