The pharmaceutical industry moves fast. Regulations change often. Competition grows every year. Pricing pressure increases across markets. Moreover, companies must balance innovation, compliance, profitability, and safety at the same time.However, many pharma companies still depend on scattered spreadsheets and delayed reports. As a result, leaders struggle to track sales trends, discount impact, regional performance, and therapy profitability in real time.So, how can pharmaceutical companies gain full visibility across products, regions, and channels?You need a Pharmaceuticals Dashboard in Power BI.This comprehensive dashboard centralizes sales, cost, profit, therapy performance, and ESG indicators into one powerful reporting system. Therefore, executives, finance teams, and sales managers can make faster and smarter decisions.
Click to buy Pharmaceuticals Dashboard in Power BI
What Is a Pharmaceuticals Dashboard in Power BI?
A Pharmaceuticals Dashboard in Power BI is an interactive business intelligence solution that tracks pharma performance metrics in real time. It connects structured data to dynamic visuals. As a result, it transforms raw numbers into clear insights.
Instead of reviewing static monthly reports, decision-makers can:
- Monitor Gross Sales, Net Sales, and Profit instantly
- Analyze discount impact across channels
- Track Units Sold by therapy area
- Compare Profit Margin% by region and product
- Review ESG and safety trends monthly
Moreover, Power BI allows you to use slicers. Therefore, you can filter by month, region, therapy area, or sales channel with just one click.
Why Do Pharmaceutical Companies Need a Dashboard?
Pharma operations involve multiple moving parts. Companies manage:
- Hundreds of SKUs
- Multiple therapy areas
- Complex distribution channels
- Strict regulatory requirements
- Regional pricing strategies
However, without centralized reporting, leaders lose clarity. Consequently, they react slowly to market shifts.
A Pharmaceuticals Dashboard solves this problem because it:
- Brings all KPIs into one system
- Reduces manual reporting time
- Improves forecasting accuracy
- Highlights profit leaks quickly
Therefore, organizations gain control over performance before problems grow.
Key Features of the Pharmaceuticals Dashboard in Power BI
This dashboard includes 5 interactive pages inside the Power BI Desktop file. Each page focuses on a specific performance dimension.
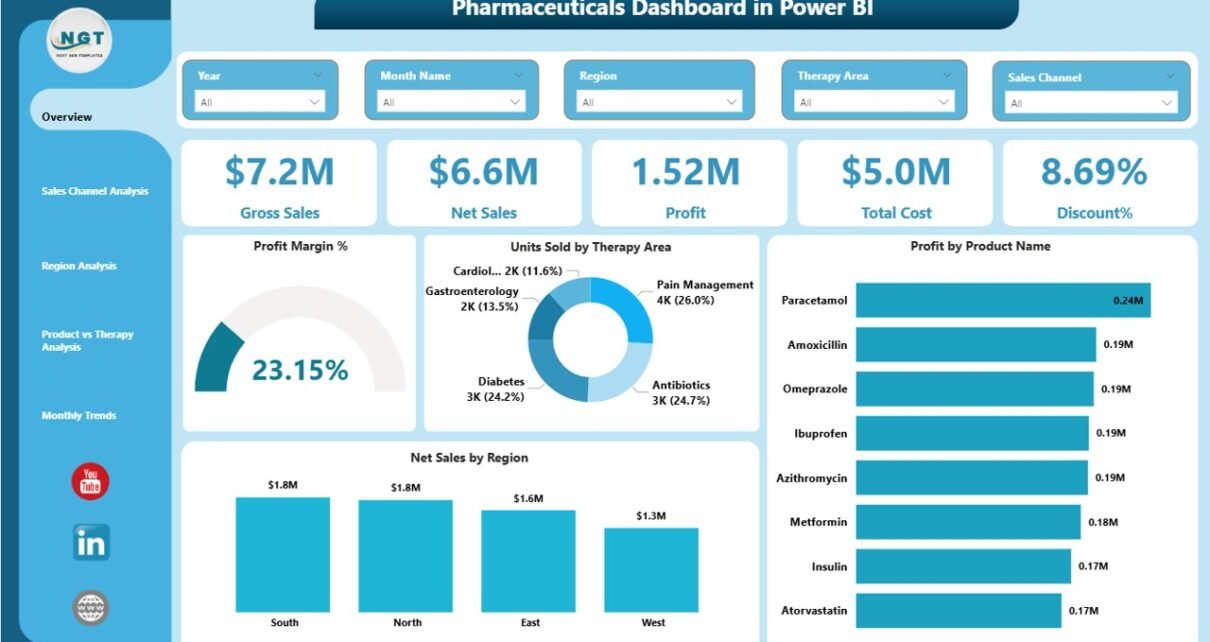
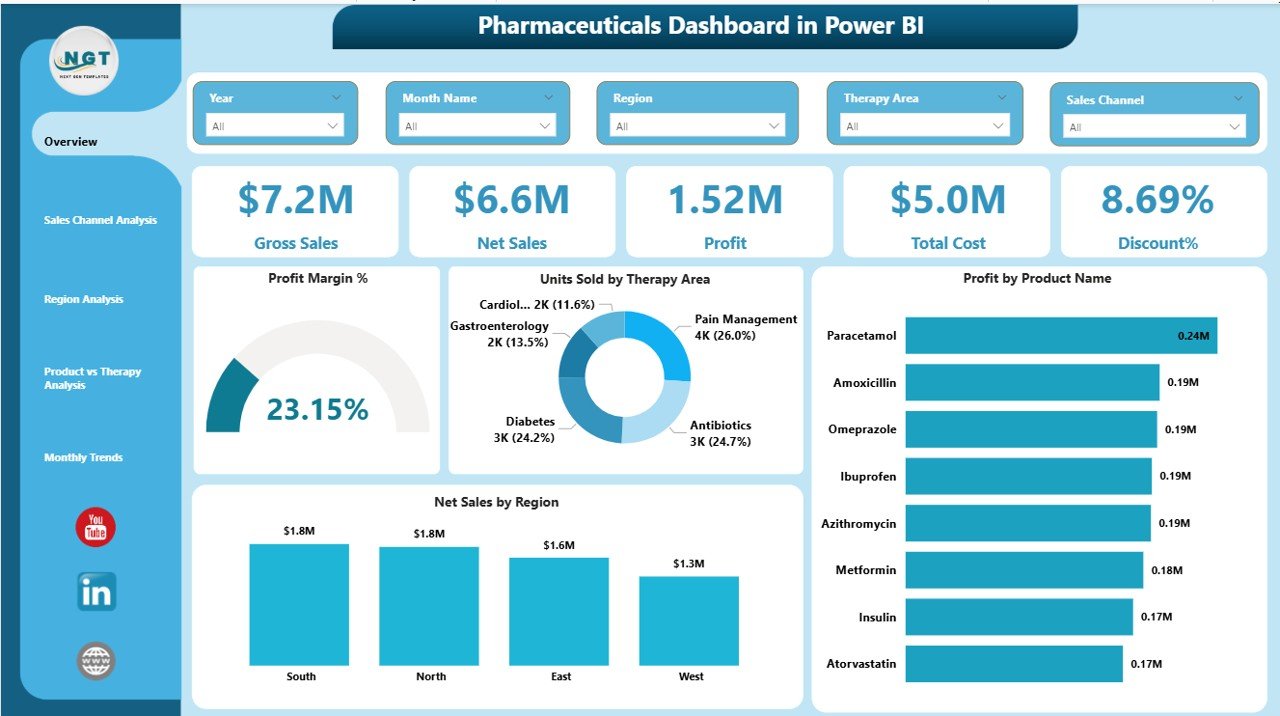
Overview Page – How Does the Company Perform Overall?
The Overview Page acts as the central control panel. It provides high-level performance insights at a glance.
Key Cards Displayed:
- Gross Sales
- Net Sales
- Profit
- Total Cost
- Discount %
Additionally, this page shows:
- Profit Margin %
- Units Sold by Therapy Area
- Profit by Product Name
- Net Sales by Region
Because this page includes slicers, users can filter data by month, region, or therapy area instantly. Therefore, executives can review performance in seconds.
For example, if Gross Sales reach $50 million but Discount % increases to 18%, leaders can quickly analyze the impact on Net Sales and Profit.
Click to buy Pharmaceuticals Dashboard in Power BI
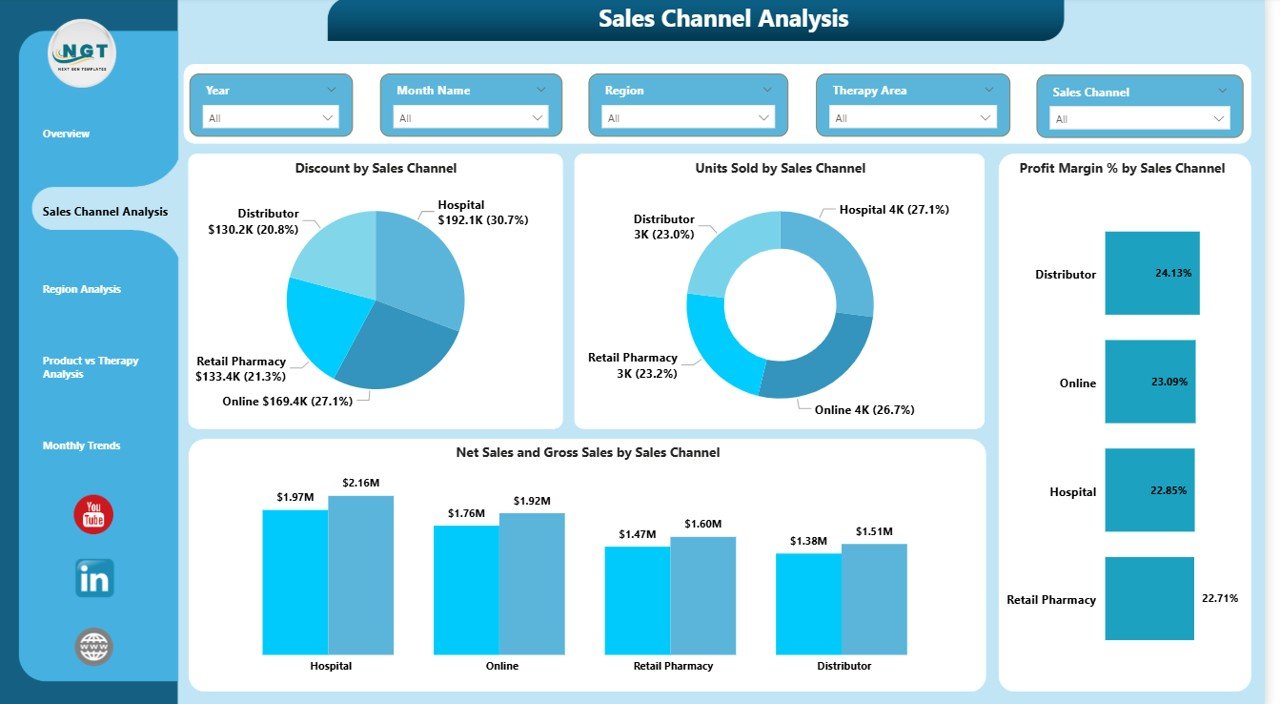
Sales Channel Analysis – Which Channel Drives Maximum Profit?
Pharma companies sell through multiple channels such as:
- Retail pharmacies
- Hospital supply
- Distributors
- Online channels
Therefore, analyzing channel performance becomes critical.
This page includes:
- Discount % by Sales Channel
- Units Sold by Sales Channel
- Profit Margin % by Sales Channel
- Net Sales and Gross Sales by Sales Channel
For example, if hospital sales generate high volume but low margin, managers can adjust pricing strategy. Similarly, if retail shows high profitability, companies can allocate more marketing budget.
As a result, leadership improves channel optimization.
Click to buy Pharmaceuticals Dashboard in Power BI
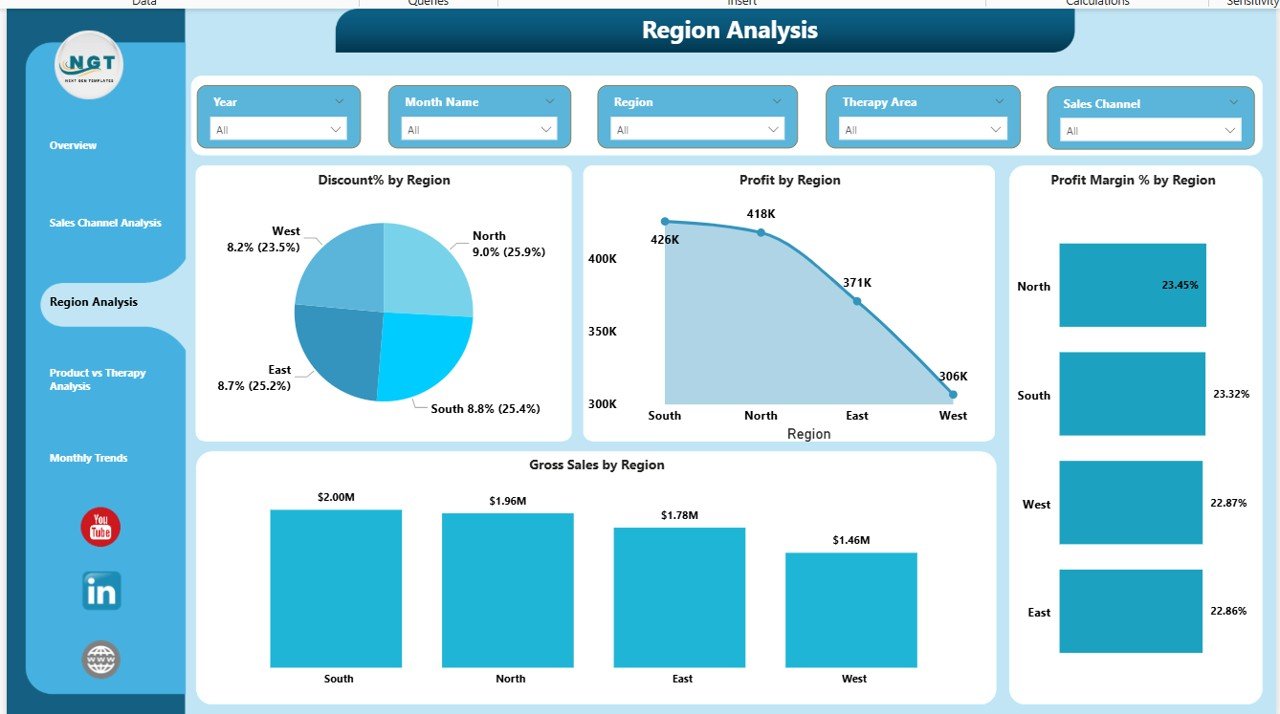
Region Analysis – Which Markets Perform Best?
Geographic expansion plays a key role in pharma growth. However, each region shows different pricing and regulatory conditions.
This page displays:
- Discount % by Region
- Profit by Region
- Profit Margin % by Region
- Gross Sales by Region
For instance, North America may show high Gross Sales but moderate Profit Margin%. Meanwhile, Asia-Pacific may show lower volume but higher growth potential.
Therefore, regional analysis supports better investment planning.
Click to buy Pharmaceuticals Dashboard in Power BI
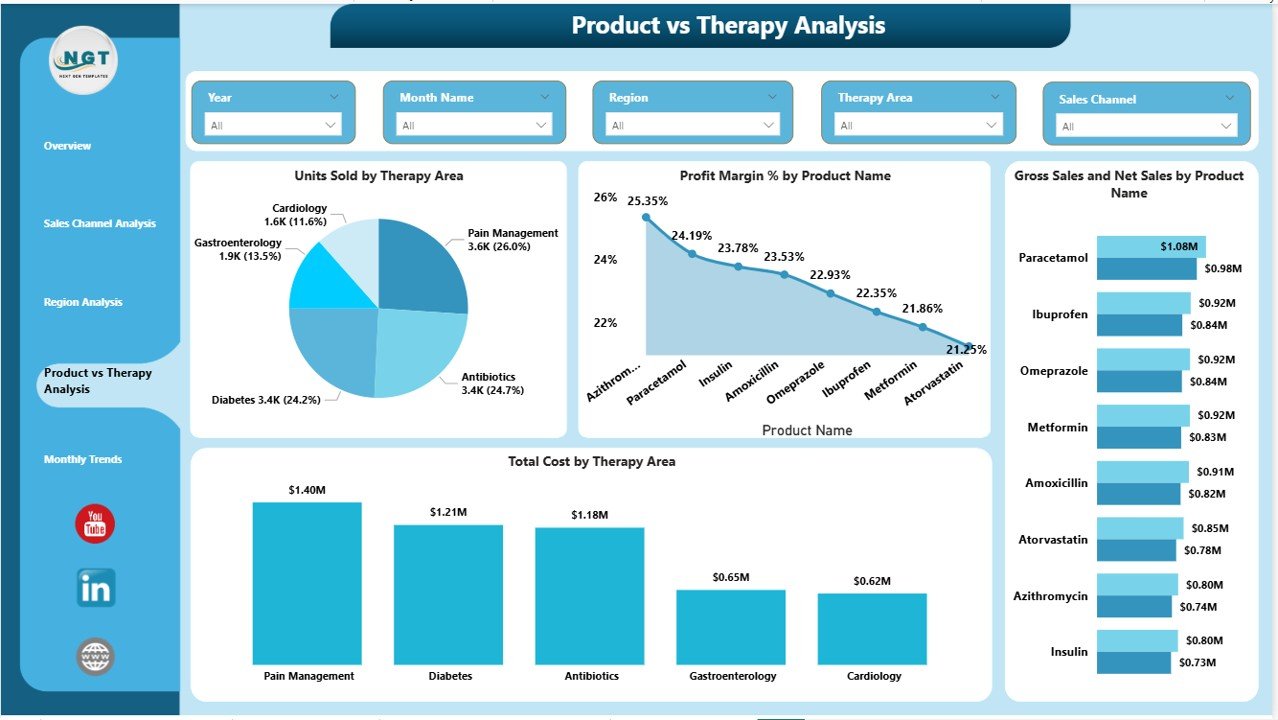
Product vs Therapy Analysis – Which Products Lead the Market?
Pharmaceutical companies operate across multiple therapy areas such as:
- Cardiology
- Oncology
- Neurology
- Diabetes
- Vaccines
This page includes:
- Units Sold by Therapy Area
- Profit Margin % by Product Name
- Gross Sales and Net Sales by Product
- Total Cost by Therapy Area
Because therapy performance varies significantly, this page helps management:
- Identify best-selling therapy segments
- Detect low-performing products
- Adjust pricing strategy
- Plan R&D focus areas
For example, Oncology may generate higher margins, while generic antibiotics may show lower profitability.
Therefore, companies align production and marketing strategies accordingly.
Click to buy Pharmaceuticals Dashboard in Power BI
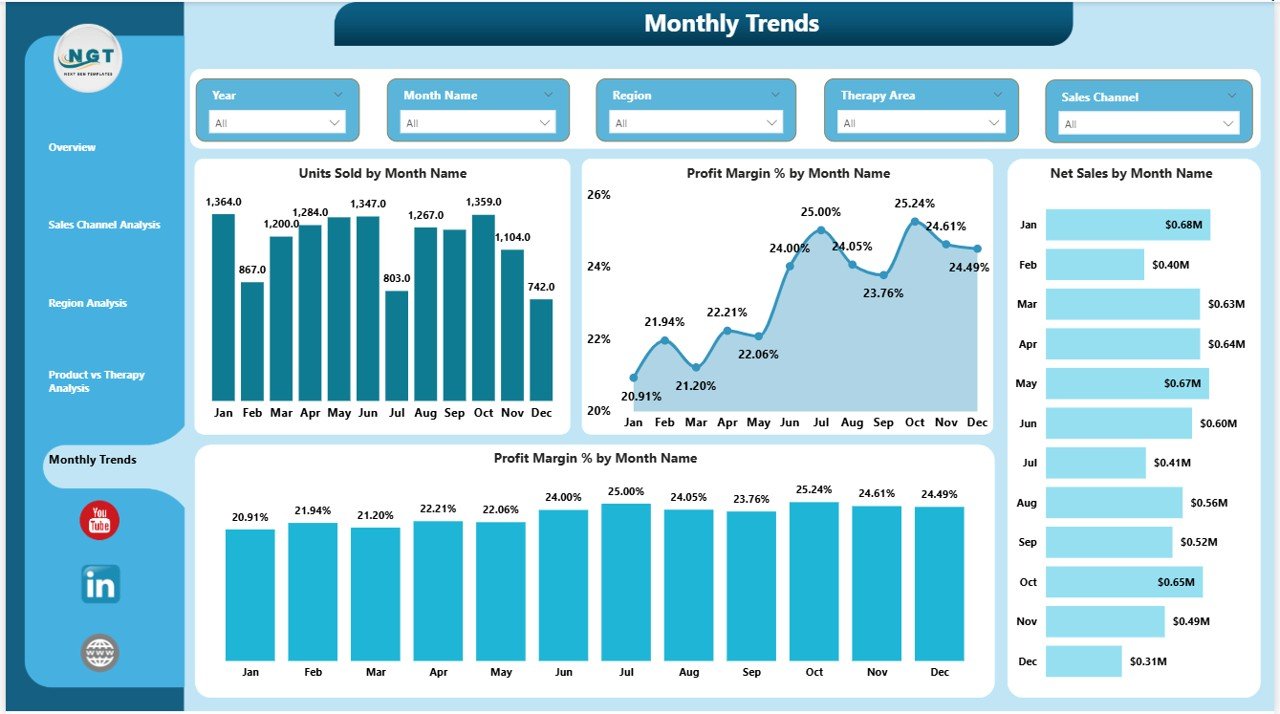
Monthly Performance Trend – How Does Monthly Performance Trend?
Modern pharmaceutical companies must focus on sustainability and safety. Investors and regulators expect transparency.
This page tracks:
- Units Sold by Month
- Profit Margin % by Month
- Net Sales by Month
- Monthly performance trends
Since this page shows monthly insights, decision-makers can detect seasonal trends quickly.
For example:
- Flu vaccine sales may spike in Q4.
- Profit Margin% may decline during heavy discount periods.
As a result, companies improve forecasting and risk management.
Click to buy Pharmaceuticals Dashboard in Power BI
How Does This Dashboard Improve Decision-Making?
The Pharmaceuticals Dashboard in Power BI improves decisions because it provides:
- Real-time visibility
- Interactive filtering
- Clear KPI comparisons
- Visual trend tracking
Moreover, it reduces manual errors. Therefore, teams spend less time preparing reports and more time analyzing insights.
For example, instead of exporting 10 Excel files, users can review all KPIs in one dashboard within 2 minutes.
Advantages of Pharmaceuticals Dashboard in Power BI
Now let us explore the key advantages in detail.
- Real-Time Performance Monitoring
Leaders can see performance instantly. Therefore, they react quickly to pricing or demand shifts.
- Better Profitability Control
The dashboard tracks Profit Margin % by product and region. As a result, management identifies margin leakage quickly.
- Improved Sales Channel Optimization
Since the dashboard compares Gross vs Net Sales by channel, teams can reduce excessive discounting.
- Stronger Strategic Planning
Therapy-level insights support better resource allocation. Therefore, R&D investments become more focused.
- Reduced Reporting Time
Automated visuals eliminate manual report creation. Consequently, finance teams save hours every month.
- Enhanced Transparency
Because the dashboard centralizes data, everyone works with the same numbers. Therefore, internal alignment improves.
What KPIs Should a Pharmaceutical Dashboard Include?
A strong dashboard must track measurable KPIs such as:
- Gross Sales
- Net Sales
- Total Cost
- Profit
- Profit Margin %
- Discount %
- Units Sold
- Therapy Area Performance
- Regional Revenue
- Channel Margin
Each KPI should follow a clear formula. For example:
Profit Margin % = (Profit ÷ Net Sales) × 100
When teams track these KPIs consistently, performance improves steadily.
Best Practices for the Pharmaceuticals Dashboard in Power BI
To maximize the value of this dashboard, follow these best practices:
- Keep Data Clean and Structured
Always maintain consistent data formats. Therefore, Power BI models load smoothly.
- Update Data Regularly
Schedule weekly or monthly updates. Consequently, leadership always reviews fresh insights.
- Use Clear KPI Definitions
Define each KPI clearly. For example, clarify whether Net Sales include returns or not.
- Avoid Overcrowding Visuals
Keep charts simple and readable. Therefore, decision-makers interpret data quickly.
- Enable Security Roles
Restrict sensitive financial data by role. As a result, compliance improves.
- Review Performance Monthly
Conduct monthly dashboard reviews. Consequently, teams stay aligned with targets.
How Can Pharma Teams Use This Dashboard Daily?
Different teams benefit differently:
Sales Teams
- Monitor channel performance
- Track discount impact
Finance Teams
- Analyze profit margins
- Compare Gross vs Net Sales
Regional Managers
- Evaluate territory performance
- Identify growth opportunities
Executives
- Review overall financial health
- Make expansion decisions
Therefore, the dashboard supports organization-wide visibility.
Implementation Steps for Pharmaceuticals Dashboard in Power BI
If you plan to deploy this dashboard, follow these steps:
- Collect structured sales and cost data
- Standardize product and region naming
- Import data into Power BI
- Create relationships between tables
- Design interactive visuals
- Add slicers for filtering
- Test calculations
- Deploy and train users
When you follow this process, implementation becomes smooth.
How Does This Dashboard Support Compliance and ESG Goals?
Pharma companies must maintain transparency. Therefore, ESG tracking becomes essential.
This dashboard supports ESG by:
- Monitoring monthly performance
- Highlighting operational trends
- Supporting data-driven sustainability decisions
As investors demand accountability, structured dashboards become even more important.
Future Scope of Pharmaceutical Dashboards
Technology continues to evolve. Therefore, dashboards will become even smarter.
Future enhancements may include:
- AI-based sales forecasting
- Predictive demand analysis
- Automated anomaly detection
- Integration with ERP systems
Consequently, pharma companies will gain even stronger control over performance.
Conclusion: Why Should You Invest in a Pharmaceuticals Dashboard in Power BI?
The pharmaceutical industry demands precision, speed, and transparency. However, manual reporting slows growth and hides profit leakage.
A Pharmaceuticals Dashboard in Power BI changes that.
It centralizes sales, cost, product, region, and channel insights into one structured system. Moreover, it enables real-time filtering and performance comparison.
Therefore, companies improve profitability, enhance strategic decisions, and strengthen market positioning.
If you want complete visibility and better financial control, this dashboard offers a practical and powerful solution.
Frequently Asked Questions with Answers
- What is a Pharmaceuticals Dashboard in Power BI?
It is an interactive reporting tool that tracks pharma KPIs such as sales, profit, and margins in real time.
- Who should use this dashboard?
Sales managers, finance teams, regional managers, and executives can use it effectively.
- Can I customize the dashboard?
Yes. You can modify KPIs, add new visuals, and adjust filters according to business needs.
- How often should I update the dashboard?
You should update it weekly or monthly, depending on reporting requirements.
- Does this dashboard improve profitability?
Yes. It highlights margin gaps, discount impact, and underperforming regions. Therefore, leaders can take corrective action quickly.
- Is Power BI suitable for pharmaceutical analytics?
Yes. Power BI supports interactive visuals, strong calculations, and secure data handling, which makes it ideal for pharma analytics.
Visit our YouTube channel to learn step-by-step video tutorials
Watch the step-by-step video tutorial:
Click to buy Pharmaceuticals Dashboard in Power BI