Managing physiotherapy and rehabilitation services requires accuracy, clarity, and speed. Clinics, hospitals, and independent physiotherapists handle patient sessions, treatment costs, therapist performance, and recovery outcomes every day. However, when this data stays scattered across multiple Excel files, tracking performance becomes difficult and time-consuming.
That is exactly where a Physiotherapy and Rehabilitation Dashboard in Excel becomes a powerful solution.
In this detailed article, you will learn what a Physiotherapy and Rehabilitation Dashboard in Excel is, how it works, why it matters, and how it supports better clinical and business decisions. Moreover, you will explore its page-wise structure, advantages, best practices, and real-world use cases. Finally, you will find a dedicated FAQ section to answer common questions.
Click to Purchases Physiotherapy and Rehabilitation Dashboard in excel
What Is a Physiotherapy and Rehabilitation Dashboard in Excel?
A Physiotherapy and Rehabilitation Dashboard in Excel is a ready-to-use analytical tool that transforms raw physiotherapy data into meaningful insights. Instead of reviewing multiple reports, you can monitor patient treatments, sessions, costs, and therapist performance from one interactive Excel dashboard.
Because Excel supports pivot tables, charts, slicers, and formulas, this dashboard allows you to:
-
Track completed and ongoing treatments
-
Compare planned vs completed sessions
-
Analyze treatment costs and outcomes
-
Review therapist and condition-wise performance
-
Monitor monthly trends
As a result, decision-making becomes faster, clearer, and more reliable.
Why Do Physiotherapy Clinics Need a Dashboard in Excel?
Physiotherapy centers operate in a data-rich environment. Every patient visit creates new data points related to sessions, pain scores, treatment types, and costs. However, without structured analysis, this data adds little value.
A Physiotherapy and Rehabilitation Dashboard in Excel solves this challenge by:
-
Centralizing all operational data
-
Providing visual performance indicators
-
Highlighting gaps between planned and actual sessions
-
Supporting clinical and financial decision-making
Therefore, clinics can improve patient outcomes while also improving operational efficiency.
How Does a Physiotherapy and Rehabilitation Dashboard in Excel Work?
The dashboard works by connecting structured data tables with pivot tables and pivot charts. Once the data updates, the dashboard refreshes automatically.
Core Workflow:
-
Data gets entered or imported into a Data Sheet
-
Pivot tables summarize the data
-
Charts visualize trends and comparisons
-
Slicers filter data by city, condition, therapist, treatment type, or month
-
KPI cards show high-level performance indicators
As a result, users can analyze complex data without advanced technical skills.
Page Navigator: Easy Navigation Across the Dashboard
The dashboard includes a Page Navigator located on the left side, which allows smooth navigation across all analytical pages. Because of this feature, users can jump between views without scrolling or searching.
This navigation improves usability and ensures faster access to insights.
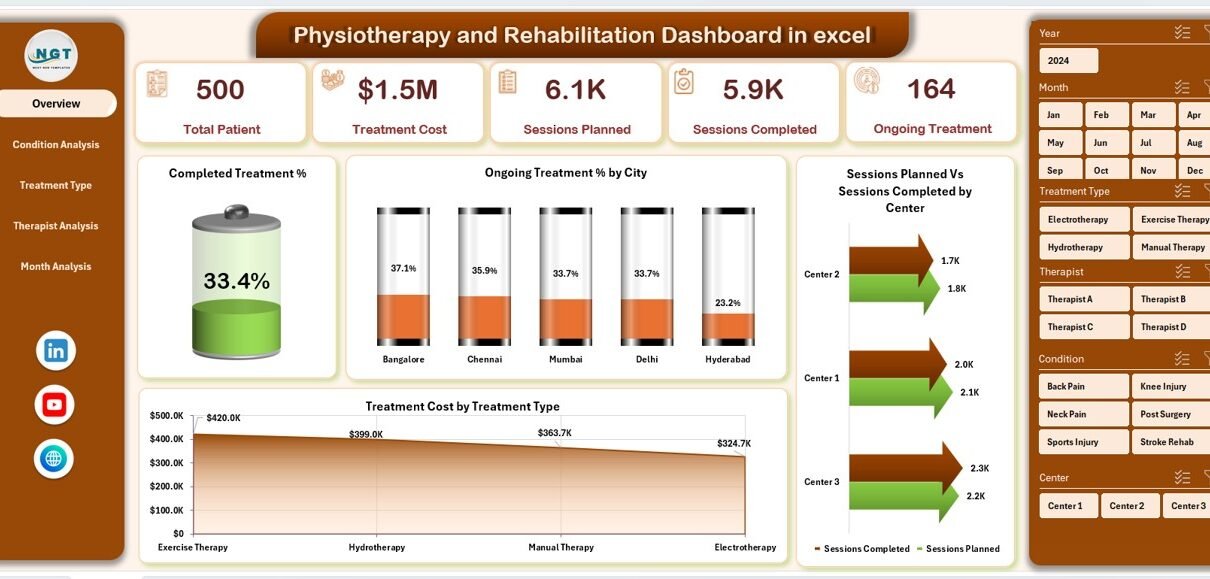
Overview Page: What Does the Overview Page Show?
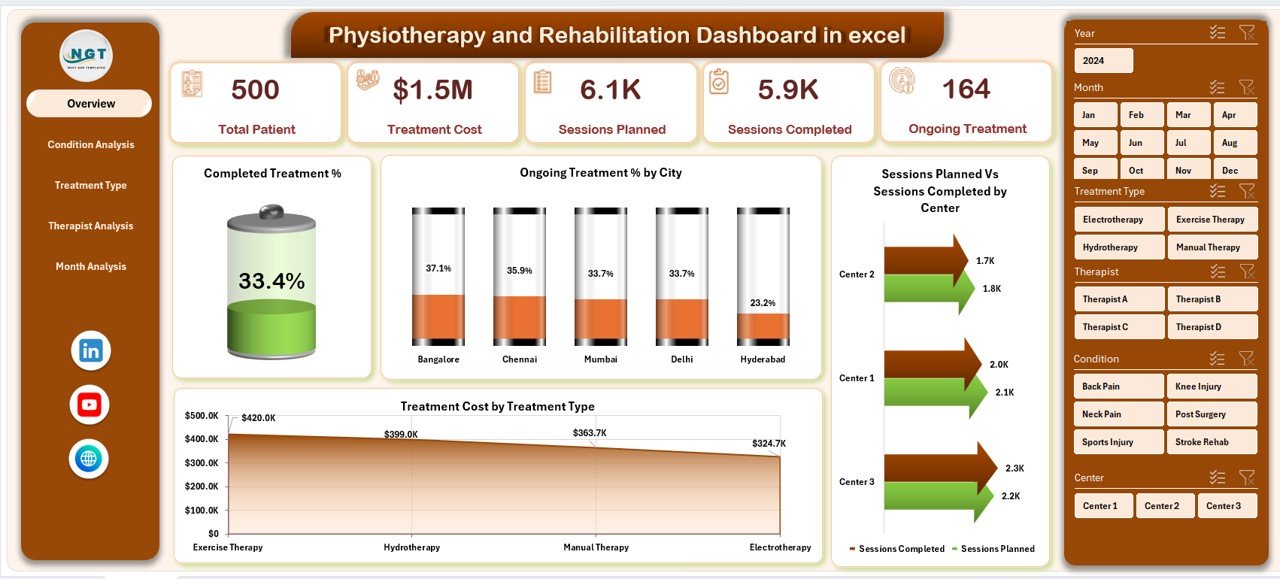
The Overview Page serves as the main control panel of the dashboard. It provides a snapshot of overall performance using cards, charts, and slicers.
Key Elements of the Overview Page:
-
Right-side slicer for quick filtering
-
Four KPI cards for instant insights
-
Four analytical charts
KPIs and Charts on the Overview Page:
-
Completed Treatment %
-
Ongoing Treatment % by City
-
Sessions Planned vs Sessions Completed by Centre
-
Treatment Cost by Treatment Type
Because this page highlights both clinical and operational metrics, managers can immediately understand overall performance.
Condition Analysis Page: How Does Condition-Wise Analysis Help?
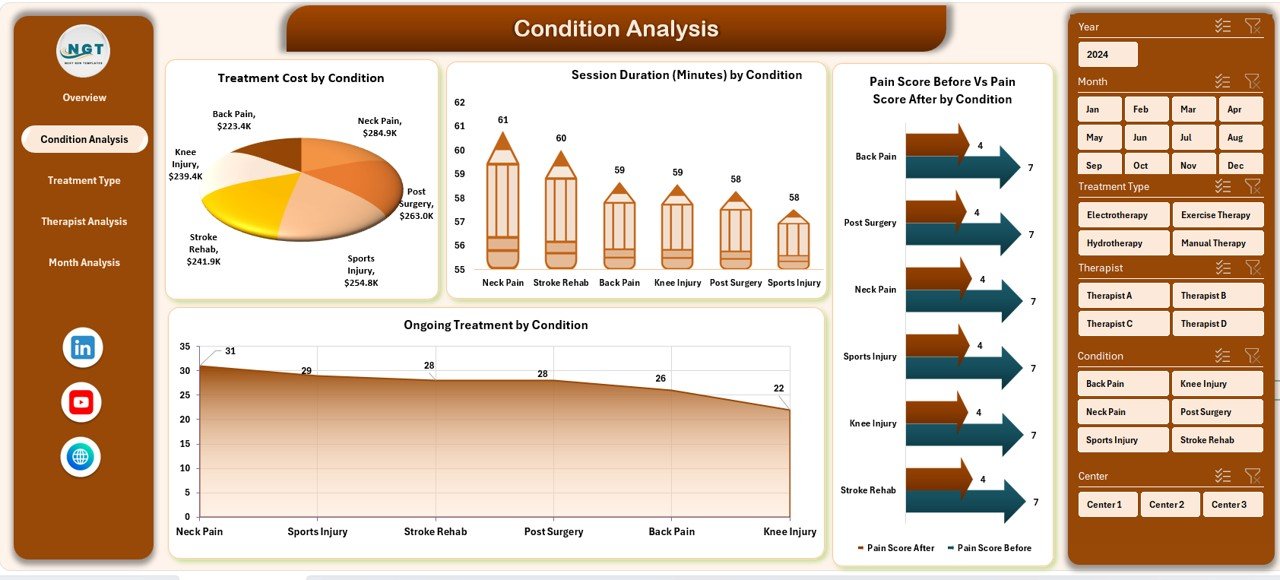
The Condition Analysis Page focuses on patient conditions and their treatment outcomes. This page helps clinics understand which conditions require more time, cost, or sessions.
Features of the Condition Analysis Page:
-
Right-side slicer for filtering
-
Four detailed charts for comparison
Charts Included:
-
Treatment Cost by Condition
-
Session Duration by Condition
-
Pain Score Before vs Pain Score After by Condition
-
Ongoing Treatment by Condition
With this analysis, clinics can identify:
-
High-cost conditions
-
Conditions with slower recovery
-
Effectiveness of treatments across conditions
Therefore, treatment planning becomes more informed and patient-centric.
Click to Purchases Physiotherapy and Rehabilitation Dashboard in excel
Treatment Type Analysis Page: Why Is Treatment-Wise Analysis Important?
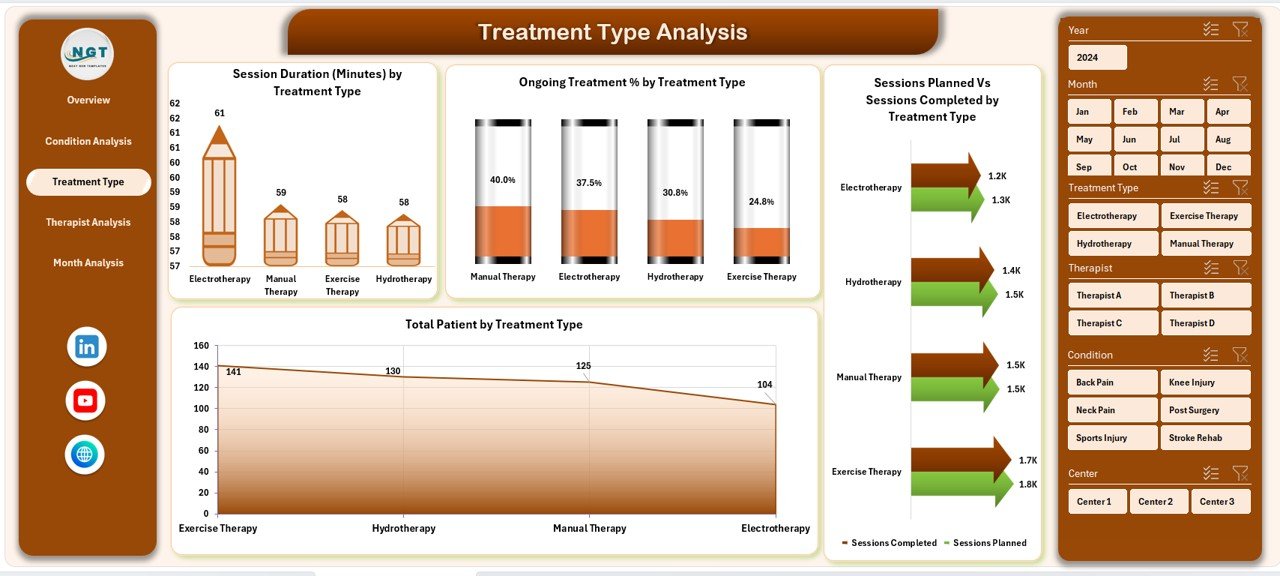
Different physiotherapy treatments produce different outcomes and costs. The Treatment Type Analysis Page breaks down performance by treatment category.
Key Insights from This Page:
-
Performance of each treatment type
-
Patient distribution across treatments
-
Session completion efficiency
Charts Available:
-
Session Duration by Treatment Type
-
Ongoing Treatment % by Treatment Type
-
Sessions Planned vs Sessions Completed by Treatment Type
-
Total Patients by Treatment Type
As a result, clinics can:
-
Optimize treatment offerings
-
Improve session planning
-
Control treatment costs
Therapist Analysis Page: How Can You Evaluate Therapist Performance?
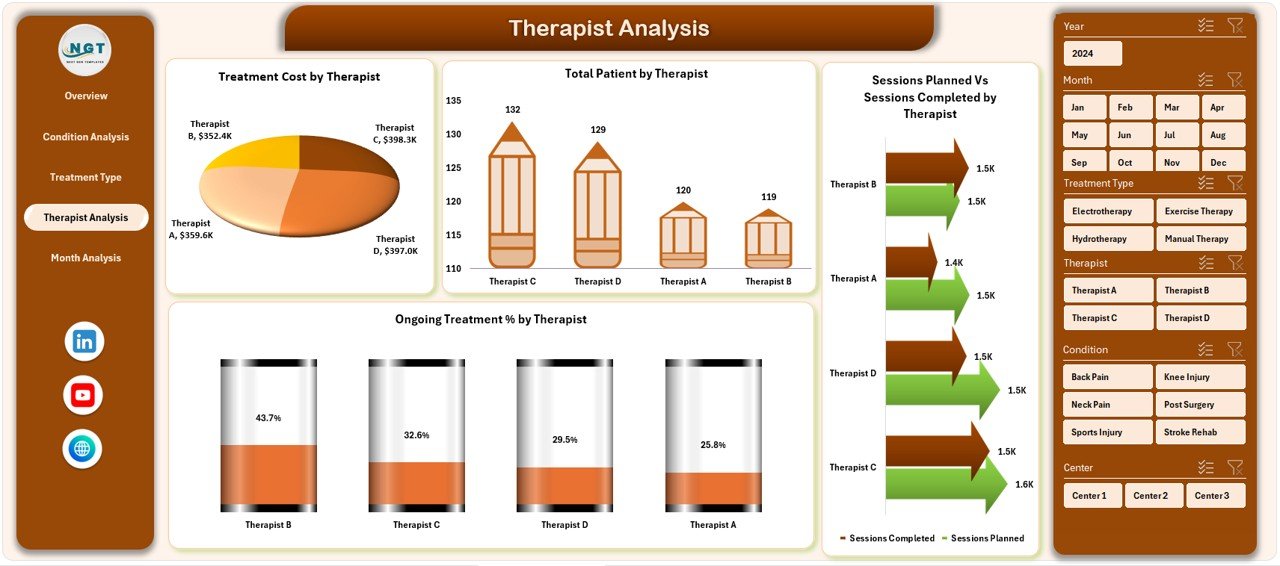
Therapist performance plays a critical role in patient recovery and clinic reputation. The Therapist Analysis Page provides a clear view of individual therapist contributions.
Key Components:
-
Right-side slicer for therapist filtering
-
Four performance charts
Charts Included:
-
Treatment Cost by Therapist
-
Total Patients by Therapist
-
Sessions Planned vs Sessions Completed by Therapist
-
Ongoing Treatment % by Therapist
With this data, clinic managers can:
-
Balance therapist workloads
-
Identify high-performing therapists
-
Provide targeted training or support
Month Analysis Page: Why Track Monthly Trends?
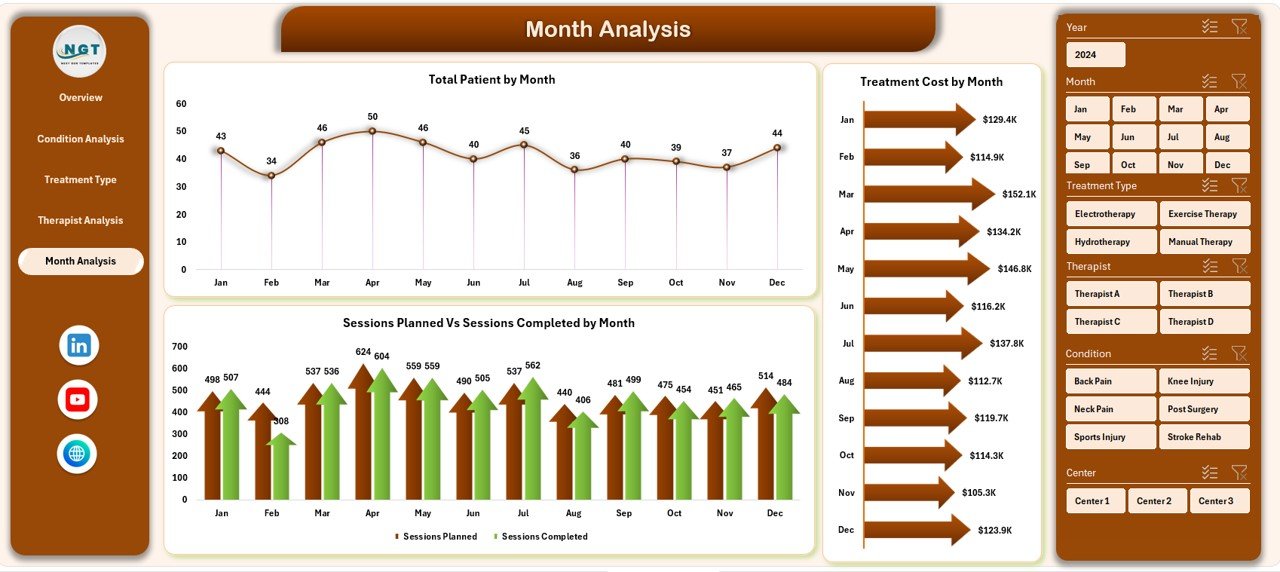
Healthcare performance changes over time. The Month Analysis Page helps clinics identify seasonal patterns and growth trends.
Key Metrics on the Month Analysis Page:
-
Treatment Cost by Month
-
Total Patients by Month
-
Sessions Planned vs Sessions Completed by Month
Because of this analysis, clinics can:
-
Forecast future demand
-
Manage staffing needs
-
Control monthly costs
Support Sheet and Data Sheet: The Backbone of the Dashboard
Click to Purchases Physiotherapy and Rehabilitation Dashboard in excel
Behind every powerful dashboard lies clean data.
Data Sheet:
-
Stores raw physiotherapy and rehabilitation data
-
Includes patient details, sessions, treatments, costs, therapists, and dates
Support Sheet:
-
Holds helper tables and calculations
-
Supports slicers, pivots, and formulas
By keeping data structured, the dashboard remains stable and scalable.
Advantages of Physiotherapy and Rehabilitation Dashboard in Excel
Using a Physiotherapy and Rehabilitation Dashboard in Excel offers several practical benefits.
Key Advantages:
-
📊 Centralized data analysis in one file
-
⏱ Faster decision-making through visual KPIs
-
📈 Clear tracking of sessions, costs, and outcomes
-
👩⚕️ Better therapist performance management
-
💰 Improved cost control and financial planning
-
🔄 Easy updates with refreshed data
Because Excel remains widely used, this dashboard requires no expensive software or technical training.
Who Can Use a Physiotherapy and Rehabilitation Dashboard in Excel?
This dashboard suits a wide range of healthcare professionals.
Ideal Users:
-
Physiotherapy clinics
-
Rehabilitation centers
-
Hospitals and healthcare networks
-
Independent physiotherapists
-
Clinic managers and administrators
-
Healthcare analysts
Each user group benefits from structured insights and simplified reporting.
Best Practices for the Physiotherapy and Rehabilitation Dashboard in Excel
To get maximum value from the dashboard, you should follow proven best practices.
1. Keep Data Clean and Consistent
Always use standardized formats for dates, treatment names, and therapist names. Clean data improves accuracy.
2. Update Data Regularly
Frequent updates ensure real-time insights. Therefore, schedule weekly or monthly data refreshes.
3. Use Slicers Strategically
Apply slicers to filter by city, condition, therapist, or month. This approach helps focus on specific insights.
4. Limit Manual Changes
Avoid editing pivot tables directly. Instead, update the source data to maintain dashboard integrity.
5. Review KPIs Periodically
Track whether selected KPIs still match clinic goals. Adjust metrics as services evolve.
6. Train Staff on Usage
Ensure staff understand how to use filters, navigate pages, and interpret charts.
By following these best practices, clinics can maintain reliable and actionable dashboards.
How Does This Dashboard Improve Patient Outcomes?
Better data leads to better care. This dashboard helps clinics:
-
Identify delayed recoveries early
-
Monitor pain score improvements
-
Ensure session adherence
-
Optimize therapist assignments
As a result, patient satisfaction and recovery rates improve steadily.
Why Choose Excel for a Physiotherapy and Rehabilitation Dashboard?
Excel remains a trusted tool across healthcare organizations.
Key Reasons:
-
Familiar interface
-
No additional licensing cost
-
Flexible customization
-
Easy integration with existing data
Therefore, Excel dashboards deliver high value with minimal investment.
Conclusion
A Physiotherapy and Rehabilitation Dashboard in Excel transforms raw healthcare data into meaningful insights. By organizing performance across overview, condition, treatment type, therapist, and month analysis pages, this dashboard supports smarter clinical and operational decisions.
Moreover, its ready-to-use structure, interactive slicers, and clear charts make it suitable for clinics of all sizes. When used with best practices, this dashboard improves efficiency, reduces costs, and enhances patient outcomes.
Frequently Asked Questions (FAQs)
What is a Physiotherapy and Rehabilitation Dashboard in Excel?
It is an Excel-based analytical tool that tracks treatments, sessions, costs, therapists, and patient outcomes in one interactive dashboard.
Can small clinics use this dashboard?
Yes, small clinics can use it easily because Excel requires no complex setup or software.
Does this dashboard support pivot charts?
Yes, all charts in this dashboard use pivot tables and pivot charts.
Can I customize KPIs and charts?
Yes, you can modify KPIs, charts, and slicers based on clinic requirements.
How often should I update the data?
You should update the data weekly or monthly for accurate insights.
Does this dashboard require advanced Excel skills?
No, basic knowledge of Excel filters and pivots is enough to use the dashboard effectively.
Visit our YouTube channel to learn step-by-step video tutorials