Podcasting has grown into a multi-billion-dollar digital industry. However, managing podcast platforms without clear performance visibility often creates confusion around costs, revenue, host performance, and profitability. Although data exists, many teams still rely on scattered Excel files or manual reports. As a result, valuable insights remain hidden.
That is exactly where a Podcast Platforms Dashboard in Excel becomes a powerful and practical solution.
In this detailed article, you will clearly understand what a Podcast Platforms Dashboard in Excel is, how it works, and why it matters. Moreover, you will learn how each dashboard page helps analyze costs, revenue, hosts, platforms, and trends. Additionally, this guide covers advantages, best practices, and frequently asked questions—explained in simple, easy language.
Click to Purchases Podcast Platforms Dashboard in Excel
What Is a Podcast Platforms Dashboard in Excel?
A Podcast Platforms Dashboard in Excel is a structured, interactive reporting tool built to analyze podcast business performance across platforms, hosts, countries, subscription models, and time periods.
Instead of maintaining multiple reports, this dashboard centralizes everything into one Excel file. As a result, podcast managers can track revenue, cost, profit, ratings, and margins from a single view.
Most importantly, this dashboard helps users:
-
Monitor total cost, revenue, and profit
-
Analyze platform-level and host-level performance
-
Track completion rates and downloads
-
Understand cost structure and monetization
-
Identify monthly performance trends
Because the dashboard uses Excel, users can customize and update it easily without technical complexity.
Why Do Podcast Platforms Need a Dashboard in Excel?
Podcast platforms operate with multiple cost components, revenue streams, and content creators. Therefore, without structured visibility, profitability becomes difficult to control.
Without a dashboard:
-
Cost leaks remain unnoticed
-
High-performing hosts go unidentified
-
Some platforms underperform silently
-
Strategic decisions rely on guesswork
However, a Podcast Platforms Dashboard in Excel solves these problems by delivering:
-
Centralized performance visibility
-
Faster analysis and reporting
-
Clear cost and revenue breakdown
-
Action-oriented insights
As a result, podcast businesses gain clarity, control, and confidence.
Click to Purchases Podcast Platforms Dashboard in Excel
Overview of Podcast Platforms Dashboard in Excel
This ready-to-use Podcast Platforms Dashboard in Excel includes a left-side Page Navigator and five structured analytical pages.
The five dashboard pages are:
-
Overview Page
-
Platform Analysis
-
Host Name Analysis
-
Cost Analysis
-
Monthly Trends
In addition, the file includes support and data sheets for structured data management.
Let us now explore each page in detail.
What Does the Overview Page Show?
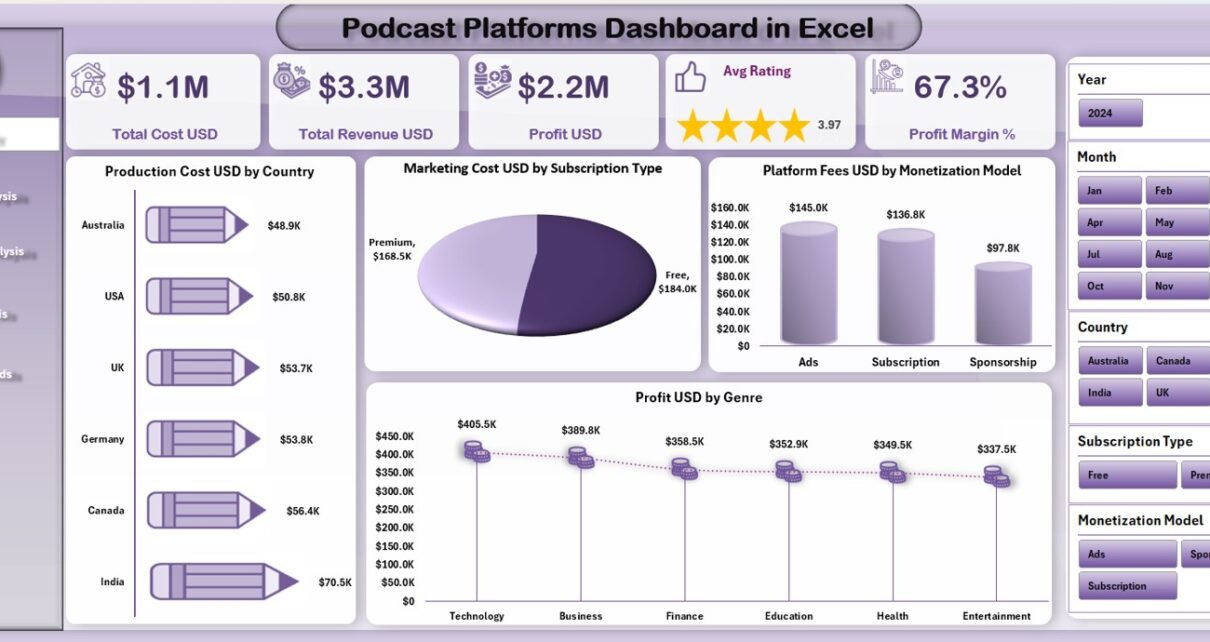
The Overview Page serves as the main landing page of the dashboard. It summarizes overall performance at a glance.
KPI Cards on Overview Page
On the top section, the dashboard displays five KPI cards:
-
Total Cost (USD)
-
Total Revenue (USD)
-
Profit (USD)
-
Average Rating
-
Profit Margin (%)
These cards immediately show the financial health of podcast operations.
Charts on Overview Page
The Overview Page also includes four insightful charts:
-
Production Cost USD by Country
-
Marketing Cost USD by Subscription Type
-
Platform Fees USD by Monetization Model
-
Profit USD by Genre
Because these charts explain how money flows across countries, subscriptions, monetization models, and genres, decision-makers can quickly identify strengths and risks.
Click to Purchases Podcast Platforms Dashboard in Excel
How Does Platform Analysis Improve Platform-Level Decisions?
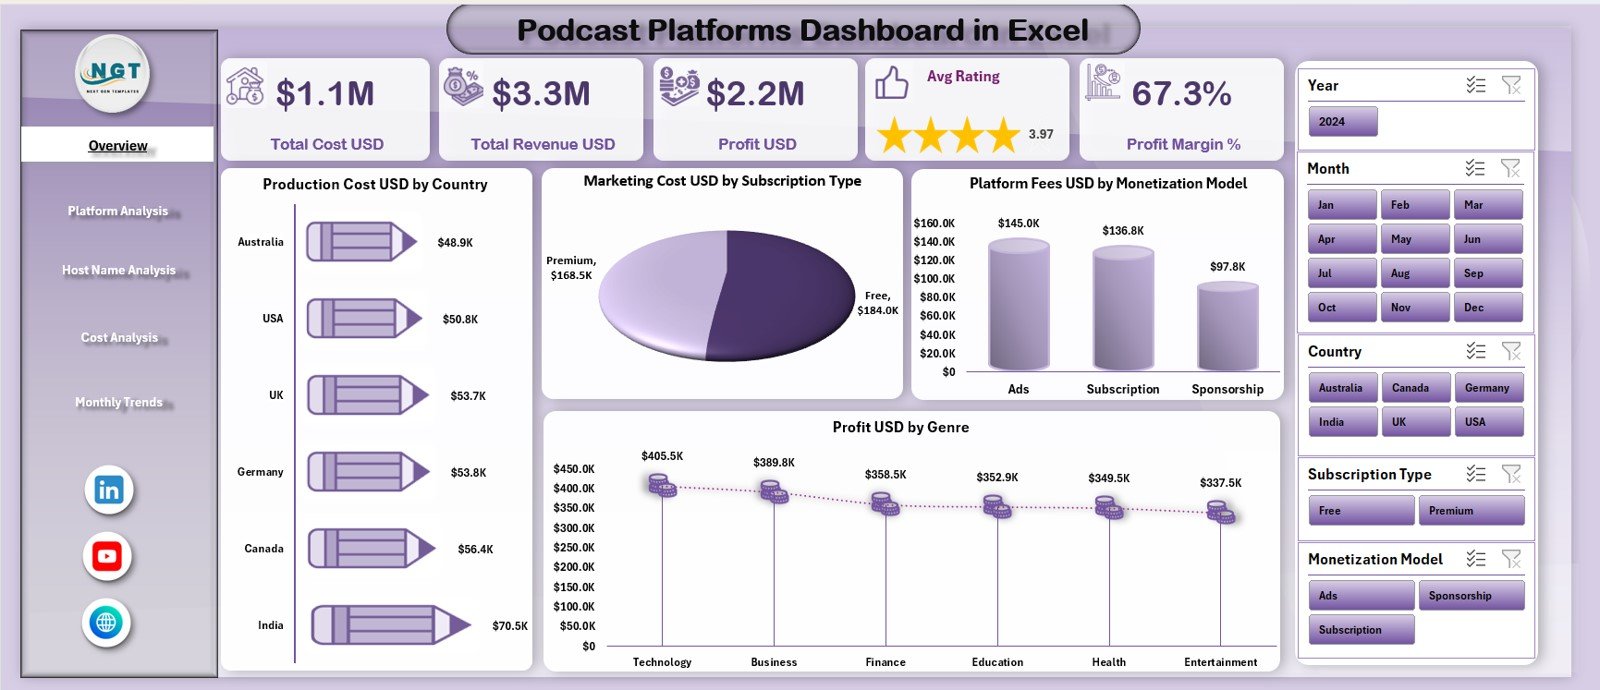
The Platform Analysis page focuses on performance comparison across podcast platforms.
This page displays four analytical charts:
-
Subscription Revenue USD by Platform
-
Platform Fees USD by Platform
-
Marketing Cost USD by Platform
-
Total Podcasts by Platform
Because platforms differ in cost structures and audience reach, this page helps teams:
-
Identify revenue-generating platforms
-
Monitor high-fee platforms
-
Optimize marketing investment
-
Balance podcast distribution strategies
As a result, platform-level decisions become easier and more accurate.
What Insights Does Host Name Analysis Provide?
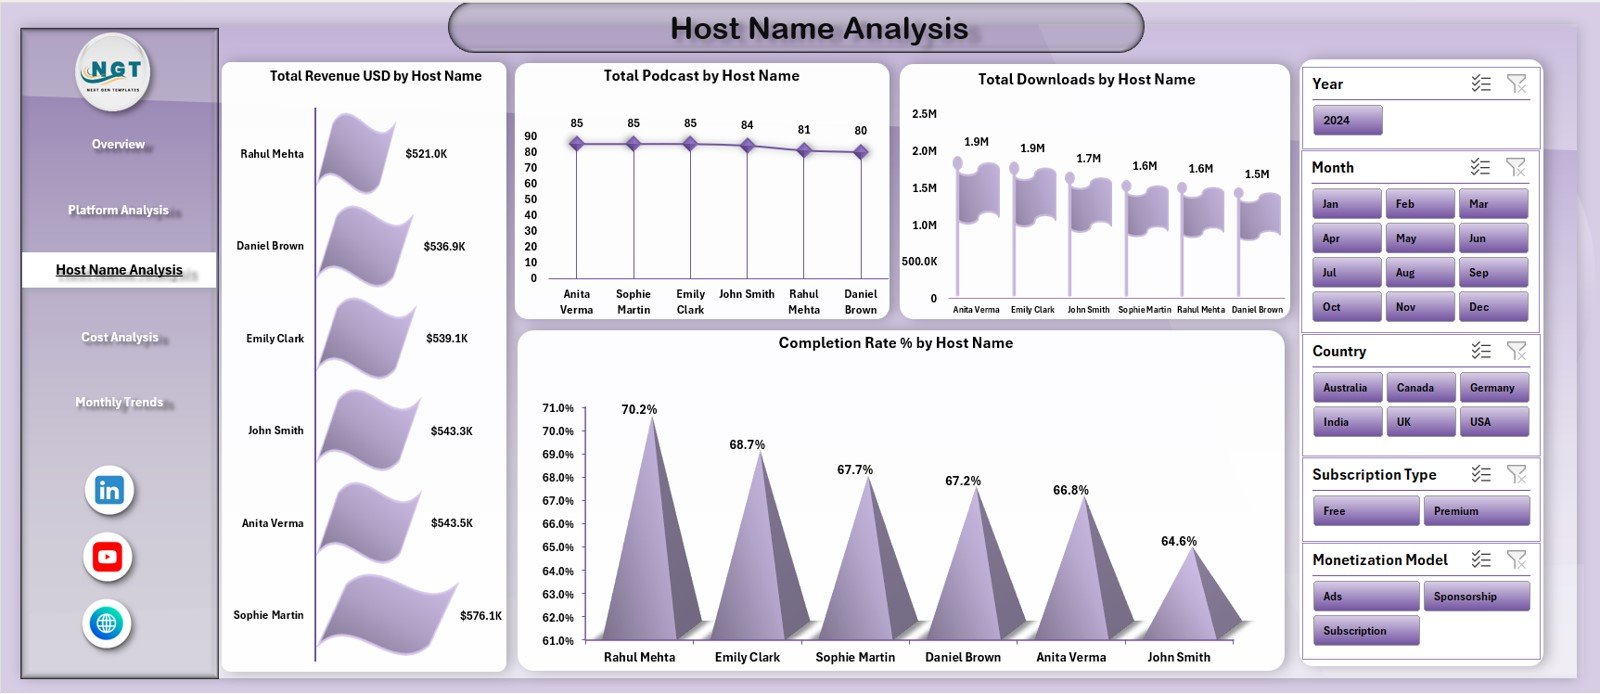
Hosts form the backbone of any podcast platform. Therefore, understanding host performance becomes crucial.
The Host Name Analysis page includes four powerful charts:
-
Total Revenue USD by Host Name
-
Total Podcasts by Host Name
-
Total Downloads by Host Name
-
Completion Rate % by Host Name
With this page, managers can:
-
Identify high-earning hosts
-
Understand audience engagement
-
Spot hosts with strong completion rates
-
Plan content investment effectively
Because of this insight, content strategies become data-driven instead of opinion-based.
Why Is the Cost Analysis Page Important?
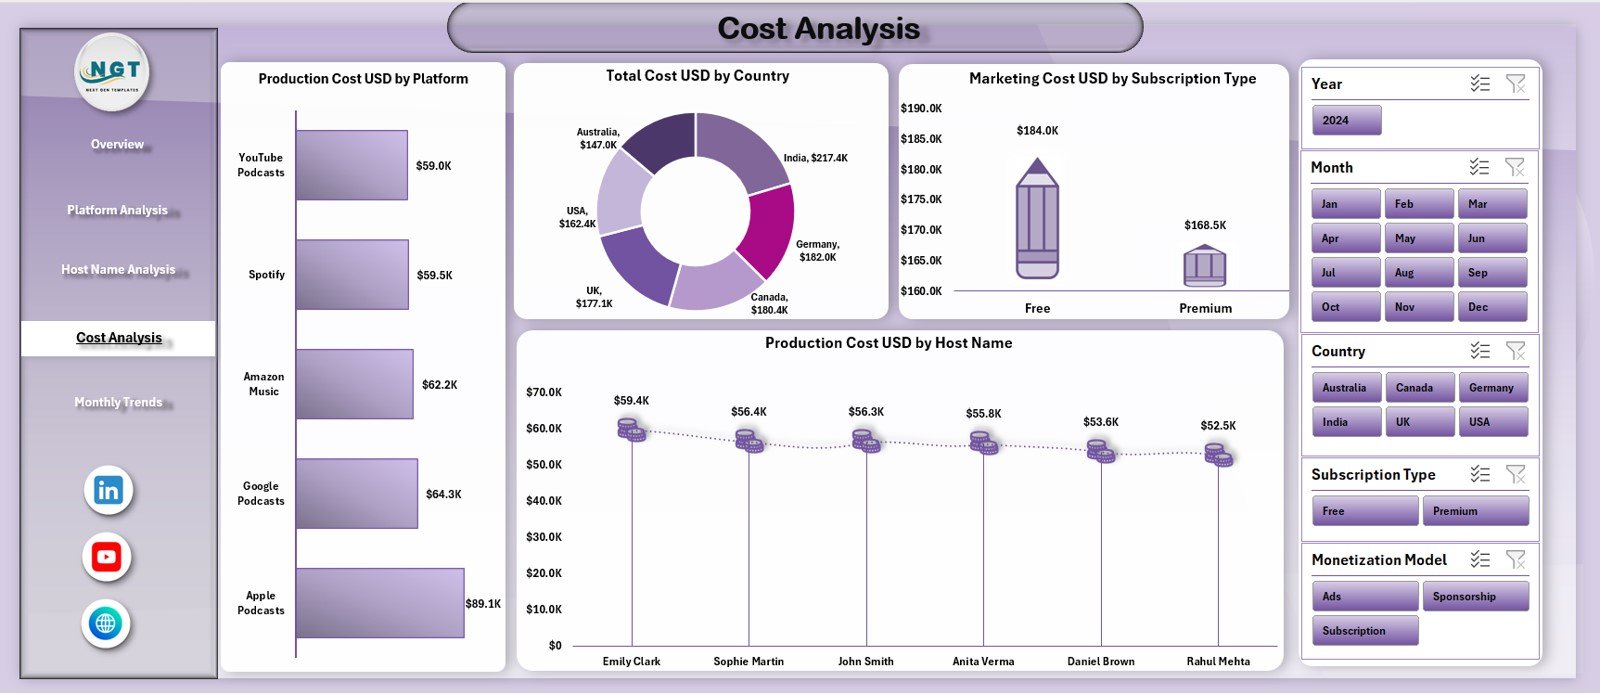
Cost control plays a major role in podcast profitability. Therefore, the Cost Analysis page focuses entirely on expense breakdown.
This page displays four cost-focused charts:
-
Production Cost USD by Platform
-
Total Cost USD by Country
-
Marketing Cost USD by Subscription Type
-
Production Cost USD by Host Name
Because of these visuals, teams can:
-
Identify cost-heavy platforms
-
Control international production expenses
-
Optimize marketing budgets
-
Manage host-level production costs
As a result, financial efficiency improves across operations.
How Does the Monthly Trends Page Support Strategic Planning?
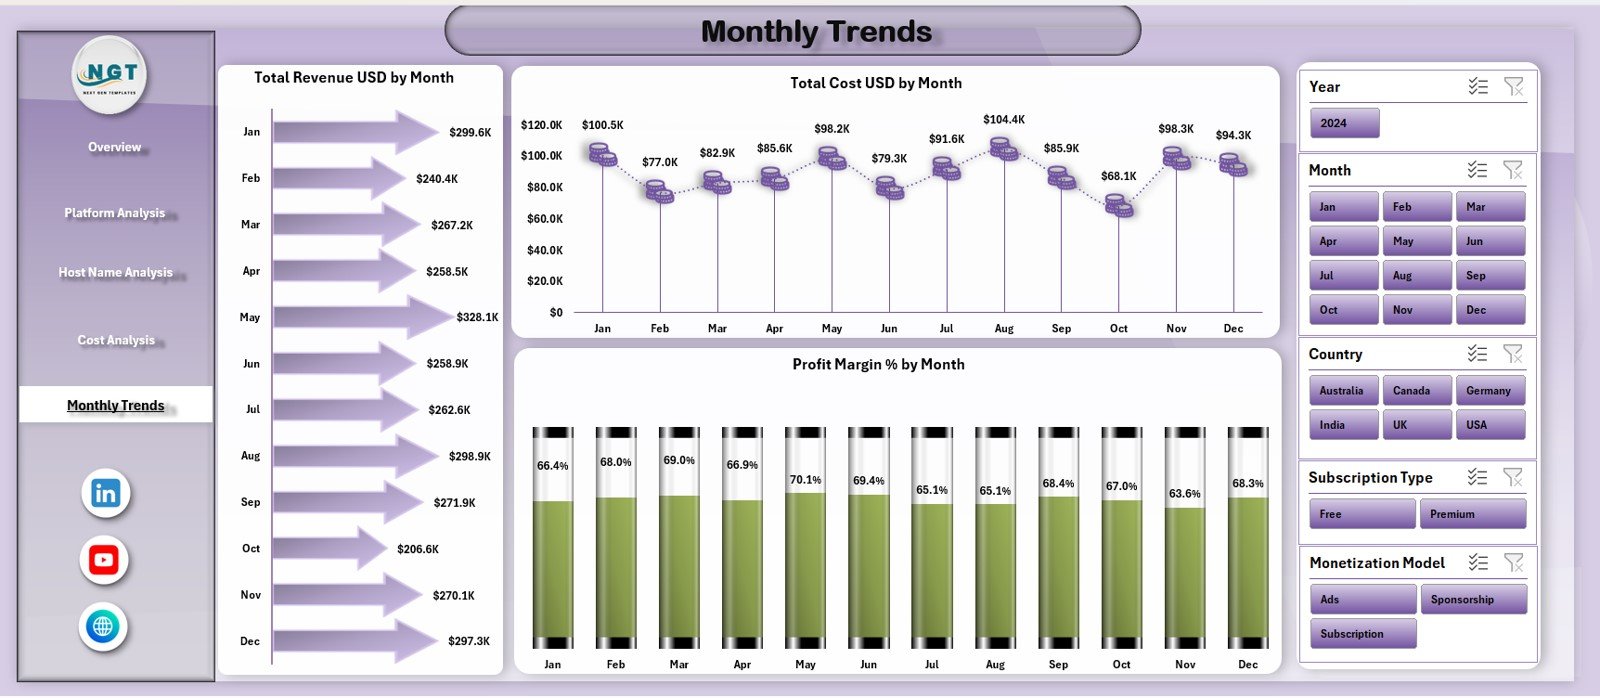
The Monthly Trends page helps analyze time-based performance.
This page includes three trend charts:
-
Total Revenue USD by Month
-
Total Cost USD by Month
-
Profit Margin % by Month
Podcast demand often fluctuates based on seasons, marketing campaigns, and content releases. Therefore, monthly insights help teams:
-
Forecast revenue trends
-
Control rising costs
-
Adjust content schedules
-
Improve long-term profitability
Advantages of Podcast Platforms Dashboard in Excel
Using a Podcast Platforms Dashboard in Excel offers several powerful advantages.
Key Advantages
✅ Centralized podcast performance reporting
✅ Clear visibility of cost, revenue, and profit
✅ Strong host and platform analytics
✅ Better cost and marketing control
✅ Faster decision-making
✅ Reduced manual reporting effort
✅ Flexible and easy Excel-based structure
✅ Suitable for small and large podcast networks
Because of these advantages, podcast platforms operate with clarity and confidence.
Click to Purchases Podcast Platforms Dashboard in Excel
Best Practices for the Podcast Platforms Dashboard in Excel
To achieve the best results, podcast teams should follow proven best practices.
Best Practices
✅ Update data regularly and accurately
✅ Use consistent platform and host naming
✅ Review profit margin trends monthly
✅ Monitor completion rates for engagement insights
✅ Analyze cost data alongside revenue
✅ Validate data before final reporting
✅ Train users to interpret dashboard visuals
✅ Protect formulas to avoid data errors
Following these practices ensures reliable insights and better planning.
How This Dashboard Improves Podcast Business Decisions
This dashboard helps podcast businesses:
-
Improve host performance strategies
-
Optimize platform selection
-
Control production and marketing costs
-
Increase profitability
-
Enhance content planning
-
Improve audience engagement
As a result, podcast platforms grow sustainably and profitably.
Conclusion
The Podcast Platforms Dashboard in Excel converts complex podcast data into clear, actionable insights. Instead of reacting to problems late, podcast managers can now monitor cost, revenue, host performance, and trends in real time.
Because the dashboard includes overview metrics, platform analysis, host insights, cost breakdowns, and monthly trends, it supports both operational and strategic decisions. Moreover, Excel’s flexibility ensures easy customization and scalability.
For any podcast business that wants stronger visibility, better cost control, and smarter growth, this dashboard becomes an essential analytics tool.
Click to Purchases Podcast Platforms Dashboard in Excel
Frequently Asked Questions (FAQs)
What is the main goal of a Podcast Platforms Dashboard in Excel?
The main goal is to track podcast performance across revenue, cost, platforms, hosts, and trends in a single Excel dashboard.
Can non-technical users operate this dashboard?
Yes. Anyone with basic Excel knowledge can easily use and update this dashboard.
How often should podcast data be updated?
You should update the dashboard monthly or whenever new performance data becomes available.
Can this dashboard handle multiple platforms and hosts?
Yes. The dashboard supports detailed analysis across multiple platforms, hosts, and countries.
Does the dashboard support profitability tracking?
Yes. It tracks total profit and profit margin trends clearly.
Can this dashboard scale with a growing podcast business?
Yes. You can easily add new platforms, hosts, and months without changing the structure.
Click to Purchases Podcast Platforms Dashboard in Excel
Visit our YouTube channel to learn step-by-step video tutorials