Digital marketing thrives on data. Every click, impression, and conversion tells a story — but without proper tracking, even the best campaigns can lose direction. That’s where the PPC Campaign KPI Dashboard in Power BI comes in.
This powerful, ready-to-use dashboard transforms raw pay-per-click data into visual insights that marketers, advertisers, and business owners can understand at a glance. Whether you manage Google Ads, Facebook Ads, or LinkedIn campaigns, this dashboard gives you the clarity and control you need to maximize ROI.
Click to Purchases PPC Campaign KPI Dashboard in Power BI
What Is a PPC Campaign KPI Dashboard in Power BI?
A PPC Campaign KPI Dashboard in Microsoft Power BI is a visual reporting tool that helps you monitor and analyze your advertising performance across multiple channels.
Instead of juggling spreadsheets and manually calculating metrics, this dashboard pulls data from your Excel files or other sources, then organizes it into interactive visuals — making it easy to compare actuals vs. targets, identify trends, and track progress toward marketing goals.
🔍 Key Purpose of the Dashboard
-
Measure the effectiveness of PPC campaigns in real time
-
Identify areas where performance is above or below target
-
Enable faster decision-making through visual analytics
-
Provide month-to-date (MTD) and year-to-date (YTD) comparisons
-
Encourage a data-driven advertising strategy
With Power BI’s automation, marketers can spend less time preparing reports and more time optimizing campaigns for better conversions.
Structure of the PPC Campaign KPI Dashboard
This dashboard has three key pages in the Power BI file, each serving a distinct analytical purpose.
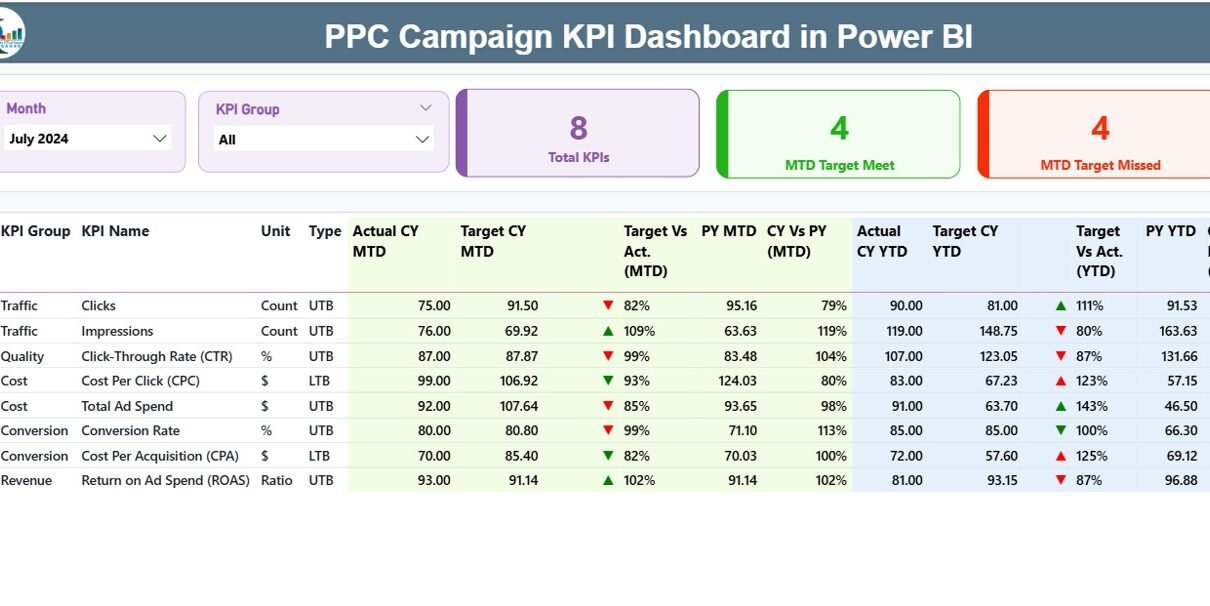
1️⃣ Summary Page – Your Command Center
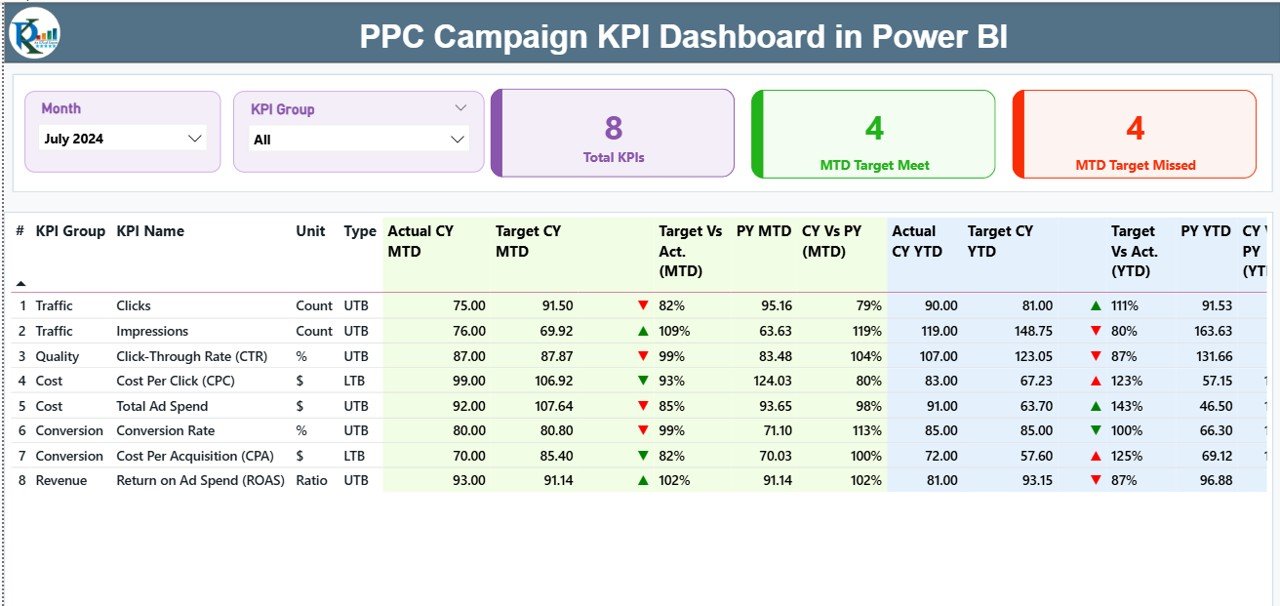
The Summary Page acts as the main control panel where users get an overview of campaign performance.
🔹 Top-Level Features
-
Slicers: Month and KPI Group slicers at the top let you instantly filter data.
Cards:
- Total KPI Count
- MTD Target Met Count
- MTD Target Missed Count
These quick-view cards provide a bird’s-eye view of campaign success.
📋 KPI Table Details
Below the summary section, a detailed table shows all KPI-level information including:
-
KPI Number – Sequential ID of each metric
-
KPI Group – The category or group (e.g., Traffic, Conversion, Cost Efficiency)
-
KPI Name – The metric being measured (e.g., Click-Through Rate, Conversion Cost)
-
Unit – The measurement unit (%, $, etc.)
-
Type – Whether the metric is “Lower the Better (LTB)” or “Upper the Better (UTB)”
-
Actual CY MTD – Actual Month-to-Date value for the current year
-
Target CY MTD – Target Month-to-Date value for the current year
-
MTD Icon – Visual indicator (green ▲ for achieved, red ▼ for missed targets)
-
Target vs Actual (MTD) – % comparison between actual and target values
-
PY MTD – Previous Year’s Month-to-Date value
-
CY vs PY (MTD) – % change vs the previous year’s performance
-
Actual CY YTD – Actual Year-to-Date value for the current year
-
Target CY YTD – Target Year-to-Date value for the current year
-
YTD Icon – Visual indicator for YTD status
-
Target vs Actual (YTD) – YTD performance percentage
-
PY YTD – Previous Year’s YTD value
-
CY vs PY (YTD) – Year-to-Year comparison percentage
This comprehensive table gives instant insight into which KPIs are meeting expectations and which need improvement.
Click to Purchases PPC Campaign KPI Dashboard in Power BI
2️⃣ KPI Trend Page – Visualizing Performance Over Time
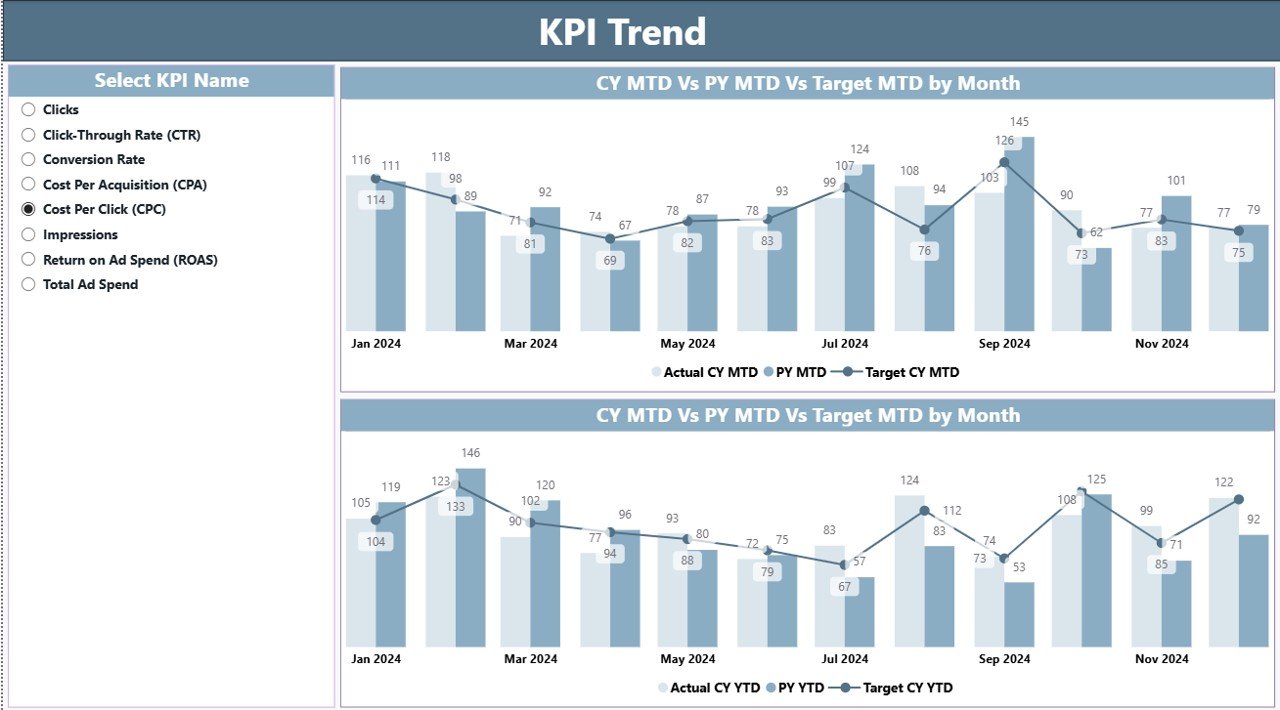
The KPI Trend Page lets you dive deeper into performance dynamics using combo charts.
📈 Key Highlights
-
Two combo charts display Actual, Target, and Previous Year data for both MTD and YTD.
-
A KPI Name slicer on the left allows you to select any metric for focused analysis.
This visualization helps track trends over time, identify seasonal performance fluctuations, and evaluate how strategic changes affect outcomes.
For instance, if you notice a dip in CTR (Click-Through Rate) over consecutive months, you can investigate ad copy, targeting, or budget distribution for improvement.
3️⃣ KPI Definition Page – Understanding the Metrics
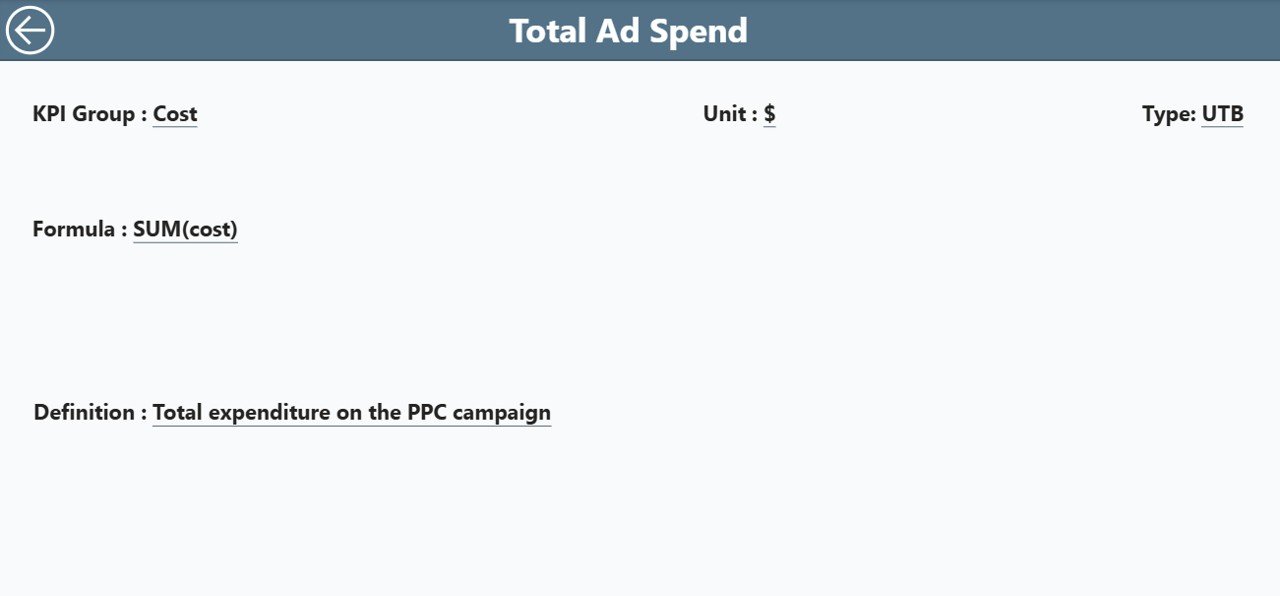
The KPI Definition Page acts as a reference library for all KPIs used in the dashboard.
It is designed as a hidden drill-through page, which means users can right-click on any KPI from the summary view to see:
-
KPI Formula
-
Definition
-
Calculation logic
-
KPI Type (LTB/UTB)
You can easily navigate back to the main page using the “Back” button on the top left corner.
This feature ensures transparency — every stakeholder understands what each metric represents and how it’s calculated.
📘 Data Source: Excel Integration for Automation
The backbone of this Power BI dashboard is an Excel data source containing three key worksheets.
1️⃣ Input_Actual Sheet
Enter actual performance data for each KPI, including:
-
KPI Name
-
Month (use the first day of the month for date consistency)
-
MTD and YTD numbers
2️⃣ Input_Target Sheet
Input target performance data using the same format:
-
KPI Name
-
Month (first day of the month)
-
MTD and YTD targets
3️⃣ KPI Definition Sheet
This sheet defines each KPI by including:
-
KPI Number
-
KPI Group
-
KPI Name
-
Unit
-
Formula
-
Definition
-
Type (LTB or UTB)
This simple Excel-Power BI connection ensures flexibility. Users can update Excel data monthly, and Power BI refreshes the visuals automatically.
Why Use Power BI for PPC Campaign Tracking?
While Google Ads and Facebook Ads provide individual reports, combining all your PPC data into one Power BI dashboard gives you a holistic performance view.
Here’s why this approach works better:
-
Unified Data View: Integrate metrics from multiple ad platforms.
-
Dynamic Filtering: Slice data by month, campaign, or KPI type in seconds.
-
Automation: Reduce manual report generation.
-
Visual Storytelling: Present your campaign story with interactive visuals.
-
Performance Benchmarking: Compare MTD and YTD results with previous years.
-
Executive Reporting: Create sleek, presentation-ready dashboards.
This setup helps digital marketers and agencies focus on actionable insights, not just data collection.
Key KPIs You Can Track in the Dashboard
Depending on your PPC strategy, you can track metrics across various categories:
📈 Traffic KPIs
-
Clicks
-
Impressions
-
Click-Through Rate (CTR)
-
Cost Per Click (CPC)
💰 Conversion KPIs
-
Conversions
-
Conversion Rate
-
Cost Per Conversion (CPA)
-
Revenue Generated
🎯 Efficiency KPIs
-
ROI (Return on Investment)
-
ROAS (Return on Ad Spend)
-
Quality Score
-
Bounce Rate
🕒 Engagement KPIs
-
Time on Site
-
Pages per Session
-
New vs Returning Visitors
You can easily modify or expand the KPI list in the Excel file as your campaign evolves.
Advantages of PPC Campaign KPI Dashboard in Power BI
Let’s explore why this dashboard is a must-have for marketers.
✅ 1. Centralized Data Tracking
All PPC performance data — from Google, Bing, Meta, or LinkedIn — appears in one unified interface. No need to toggle between platforms.
✅ 2. Real-Time Monitoring
Instantly identify if your campaign is on track. You can see MTD and YTD performance in real time with color-coded alerts.
✅ 3. Visual Clarity
Graphs, cards, and combo charts transform numbers into understandable visuals. Even non-technical stakeholders can grasp insights easily.
✅ 4. Historical Comparison
Compare current performance with previous periods (CY vs PY). This helps spot growth patterns and seasonal dips quickly.
✅ 5. Time-Saving Automation
Update the Excel source data, refresh Power BI, and your dashboard updates instantly — no manual recalculations.
✅ 6. Better Decision-Making
Power BI empowers teams to make fast, data-driven marketing decisions that improve budget allocation and ROI.
✅ 7. Improved Accountability
By defining KPIs clearly, everyone knows what success looks like. This increases transparency across marketing and management teams.
Best Practices for Using the PPC Campaign KPI Dashboard in Power BI
To get maximum benefit from this dashboard, follow these best practices:
🧮 1. Keep Data Consistent
Always use the same KPI names, units, and formats in both Actual and Target sheets. Inconsistent naming can cause broken visuals or misalignment.
📅 2. Update Monthly
Refresh your Excel data at the end of each month to keep MTD and YTD figures accurate. Regular updates make trend analysis more meaningful.
🔗 3. Use Drill-Through Pages Wisely
Leverage the hidden KPI Definition page to explain formulas and definitions to your team or clients. It avoids confusion about how each metric is calculated.
🎨 4. Maintain Design Uniformity
Stick to consistent color themes — for instance,
-
🟢 Green for performance above target
-
🔴 Red for below target
-
🟡 Yellow for near target
Consistency ensures visual harmony and faster interpretation.
📊 5. Track KPIs That Matter
Don’t overload the dashboard with every metric available. Focus on 10–15 critical KPIs that align with your campaign goals.
🧠 6. Automate Data Refresh
If possible, connect your dashboard directly to Google Ads or Meta Ads via Power BI connectors. This automation removes the need for manual Excel uploads.
🧩 7. Validate Formulas
Ensure that all calculated fields — such as Target vs Actual or CY vs PY — are accurate and aligned with your business definitions.
🧭 8. Keep Stakeholders Involved
Review the dashboard regularly with your team. Discuss performance drivers, not just numbers, to improve collaborative decision-making.
How to Interpret Dashboard Results Effectively
Click to Purchases PPC Campaign KPI Dashboard in Power BI
Even with an advanced dashboard, insights depend on interpretation. Here’s how to read and act on your PPC metrics:
🔸 Identify Winning Campaigns
Look for KPIs with green icons (targets met or exceeded). Study what worked — ad copy, keywords, or targeting — and replicate those strategies.
🔸 Spot Underperformers
Red indicators show areas for improvement. Dive deeper into those KPIs using the trend charts to uncover possible causes.
🔸 Analyze Yearly Growth
Use CY vs PY metrics to measure long-term performance improvements. If CTR or Conversion Rate shows positive growth year over year, your campaigns are evolving well.
🔸 Balance MTD and YTD Focus
Don’t rely solely on short-term (MTD) data. Review YTD trends to understand sustainable performance across quarters.
How to Customize the Dashboard
The PPC Campaign KPI Dashboard is flexible. You can modify it to suit your company’s branding or campaign structure.
Here’s how:
-
Add your company logo on the Summary page.
-
Rename slicers or cards to match campaign categories.
-
Add new visuals like funnel charts or gauge visuals for specific KPIs.
-
Use Power BI’s “Themes” to match your corporate color palette.
Such personalization not only improves visual appeal but also strengthens your reporting identity.
Example Use Case
Imagine a digital marketing agency managing campaigns for multiple clients.
Using this dashboard, the agency can:
-
Track each client’s PPC metrics in a single view.
-
Share interactive reports via Power BI Service links.
-
Highlight high-performing ads for upselling opportunities.
-
Quickly spot low ROI campaigns and adjust strategy.
As a result, both the agency and its clients save time, improve transparency, and make data-driven decisions faster.
Common Mistakes to Avoid
While using the dashboard, avoid these frequent pitfalls:
-
Forgetting to refresh Power BI after updating Excel
-
Using inconsistent date formats in the Excel source
-
Overloading visuals with too many KPIs
-
Ignoring previous year data comparisons
-
Using complex formulas without proper documentation
Avoiding these mistakes ensures smoother operation and accurate insights.
🏁 Conclusion
The PPC Campaign KPI Dashboard in Power BI is more than just a reporting tool — it’s a strategic command center for your digital marketing operations.
By combining automation, visualization, and interactivity, this dashboard gives you everything you need to monitor, evaluate, and enhance your advertising performance.
Whether you’re a marketing manager, PPC specialist, or business owner, this tool helps you stay informed, proactive, and ready to make smart data-driven decisions.
Frequently Asked Questions (FAQs)
1️⃣ What Is a PPC KPI Dashboard?
A PPC KPI Dashboard is a visual reporting tool that helps you track, analyze, and optimize campaign performance through key metrics like CTR, conversions, and ROI.
2️⃣ Why Use Power BI for PPC Analysis?
Power BI integrates data from multiple sources and presents it in a single, interactive dashboard, saving time and improving decision-making accuracy.
3️⃣ Can I Add My Own KPIs?
Yes. You can expand the KPI Definition Excel sheet by adding new metrics, units, and formulas that fit your campaign goals.
4️⃣ How Often Should I Update the Dashboard?
Ideally, update your data monthly to keep MTD and YTD insights relevant and accurate.
5️⃣ Can I Share the Dashboard With Clients?
Absolutely. You can publish the report to Power BI Service and share live, interactive dashboards via secure links.
6️⃣ Does It Work for All PPC Platforms?
Yes. You can import data from Google Ads, Facebook Ads, Bing, or any other source into Excel, and Power BI will visualize it seamlessly.
7️⃣ What Are the Key Metrics to Focus On?
Focus on CTR, CPC, Conversion Rate, CPA, and ROI — these metrics define campaign success across most PPC channels.
Visit our YouTube channel to learn step-by-step video tutorials