Procurement plays a critical role in controlling costs, improving supplier performance, and ensuring smooth operations across an organization. However, many procurement teams still struggle because they depend on manual reports, scattered spreadsheets, and delayed insights. As a result, decision-making becomes slow and reactive instead of strategic.
That is exactly why a Procurement Analytics Dashboard in Excel becomes essential.
In this detailed guide, you will learn what a Procurement Analytics Dashboard in Excel is, why organizations need it, how it works, what pages and features it includes, and how procurement teams use it to gain full visibility over cost, delivery, and performance metrics. Moreover, you will also explore its advantages, best practices, and frequently asked questions so you can implement it confidently.
Click to Purchases Procurement Analytics Dashboard in Excel
What Is a Procurement Analytics Dashboard in Excel?
A Procurement Analytics Dashboard in Excel is a ready-to-use analytical tool designed to track, analyze, and visualize procurement performance using structured data and interactive dashboards.
Instead of managing dozens of static reports, procurement teams can use this dashboard to:
-
Monitor procurement KPIs in one place
-
Track actual cost vs planned cost
-
Analyze delayed deliveries and lead times
-
Compare performance by department, category, region, and month
-
Make faster, data-driven procurement decisions
Because the dashboard runs entirely in Excel, teams can easily adopt it without additional software or technical training.
Why Do Organizations Need Procurement Analytics?
Procurement decisions directly impact profitability, supplier relationships, and operational efficiency. However, when teams rely on traditional reporting methods, several problems appear quickly.
Therefore, organizations need procurement analytics to:
-
Reduce uncontrolled procurement costs
-
Identify delayed deliveries and bottlenecks
-
Improve supplier accountability
-
Track department-wise procurement performance
-
Support strategic sourcing and negotiations
With a Procurement Analytics Dashboard in Excel, teams gain instant visibility into procurement data and eliminate guesswork from decision-making.
How Does the Procurement Analytics Dashboard in Excel Work?
The dashboard works on a simple yet powerful structure. First, procurement data gets captured inside a structured Data Sheet. Then, Excel formulas, pivot tables, and charts transform raw data into meaningful insights across multiple analytical pages.
Because everything updates dynamically, users only need to change slicer selections to instantly analyze performance by different dimensions.
Key Features of the Procurement Analytics Dashboard in Excel
This dashboard includes carefully designed features that make procurement analysis easy, fast, and insightful.
✅ Page Navigator for Easy Navigation
A Page Navigator, located on the left side, allows users to move easily across different analytical pages. As a result, users save time and avoid confusion when working with multi-page dashboards.
✅ Right-Side Slicers for Dynamic Analysis
Each analysis page includes right-side slicers, which allow users to filter data instantly by relevant parameters. Because of this, users can analyze performance from multiple perspectives without changing the underlying data.
✅ Multi-Page Analytical Design
The dashboard contains five interactive analysis pages, each designed to answer specific procurement questions.
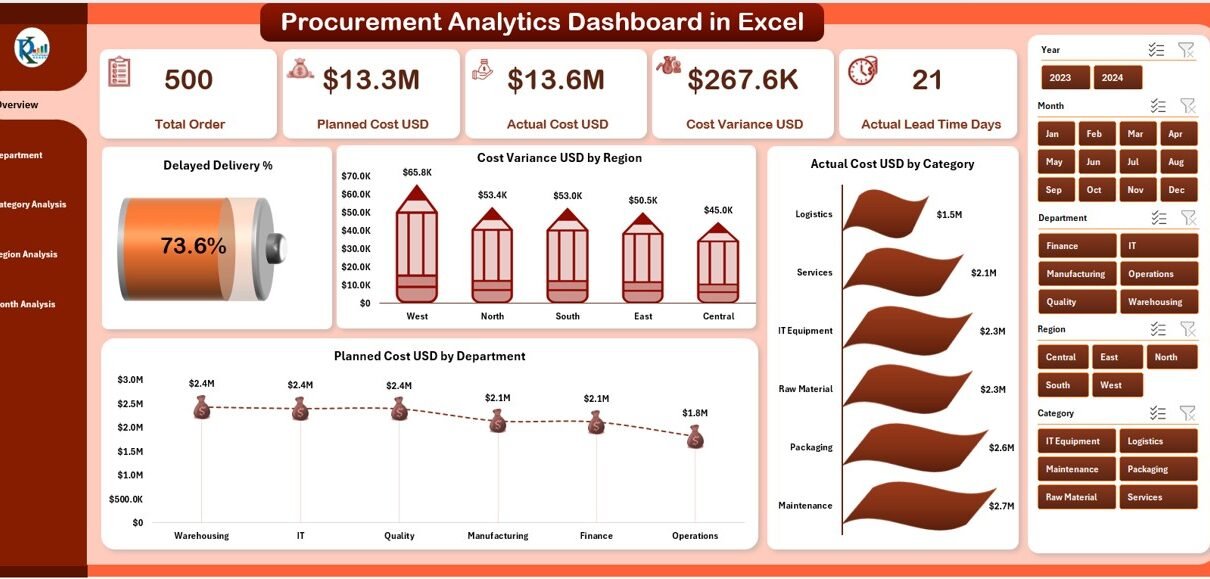
Overview Page – How Is Overall Procurement Performance?

The Overview Page works as the main landing page of the dashboard. It provides a high-level snapshot of procurement performance across the organization.
✅ Key Elements of the Overview Page
-
Right-side slicers for interactive filtering
-
Five KPI cards displaying summary metrics
-
Four analytical charts for quick performance review
✅ Charts on the Overview Page
-
Delayed Delivery % – Highlights overall delivery delays
-
Cost Variance USD by Region – Shows cost differences region-wise
-
Actual Cost USD by Category – Displays actual spending distribution
-
Planned Cost USD by Department – Compares planned procurement budgets
Because this page summarizes critical KPIs, decision-makers can immediately identify red flags and focus on problem areas.
Click to Purchases Procurement Analytics Dashboard in Excel
Department Analysis – Which Departments Perform Better?

The Department Analysis Page helps procurement leaders understand how different departments contribute to cost, delays, and planning efficiency.
✅ Visuals Included
-
Right-side slicers for filtering
-
Four targeted analytical charts
✅ Charts in Department Analysis
-
Delayed Delivery % by Department
-
Cost Variance USD by Department
-
Actual Cost USD by Department
-
Planned Lead Time Days by Department
This page allows teams to identify departments with higher delays, excessive spending, or unrealistic lead-time planning. As a result, procurement managers can implement focused improvement actions.
Category Analysis – Which Procurement Categories Need Attention?

The Category Analysis Page focuses on procurement categories such as raw materials, services, equipment, and supplies.
✅ Charts on the Category Analysis Page
-
Planned Lead Time Days by Category
-
Planned Cost USD by Category
-
Delayed Delivery % by Category
-
Cost Variance USD by Category
By analyzing category-wise performance, organizations can:
-
Improve supplier sourcing strategies
-
Renegotiate category-specific contracts
-
Reduce cost overruns effectively
Region Analysis – How Does Procurement Perform Across Regions?

Procurement performance often varies by geography because of supplier availability, logistics challenges, and regional policies. Therefore, the Region Analysis Page plays a crucial role.
✅ Charts Included in Region Analysis
-
Planned Lead Time Days by Region
-
Planned Cost USD by Region
-
Delayed Delivery % by Region
-
Actual Cost USD by Region
With these visuals, procurement leaders can benchmark regions and identify location-specific challenges.
Month Analysis – How Does Procurement Change Over Time?

The Month Analysis Page focuses on time-based trends. It helps users understand seasonal patterns, cost spikes, and lead-time fluctuations.
✅ Charts on the Month Analysis Page
-
Planned Lead Time Days by Month
-
Actual Cost USD by Month
-
Cost Variance USD by Month
This page supports forecasting and helps teams plan procurement activities more effectively across the year.
What Supporting Sheets Power the Dashboard?
Behind the scenes, the dashboard depends on well-structured support sheets.
✅ Data Sheet
The Data Sheet stores all raw procurement data such as:
-
Supplier details
-
Departments and categories
-
Regions
-
Planned cost and actual cost
-
Planned lead time and delivery delay information
Because the dashboard pulls all insights from this single source, data maintenance becomes simple and consistent.
Advantages of Procurement Analytics Dashboard in Excel
Click to Purchases Procurement Analytics Dashboard in Excel
Using a Procurement Analytics Dashboard in Excel delivers several powerful advantages.
✅ Centralized Procurement Visibility
-
Track all procurement KPIs in one dashboard
-
Eliminate scattered spreadsheets and reports
✅ Faster Decision-Making
-
Analyze data instantly using slicers
-
Identify issues before they escalate
✅ Cost Control and Savings
-
Track cost variance accurately
-
Identify cost leakages early
✅ Improved Supplier Management
-
Monitor delayed deliveries consistently
-
Improve supplier accountability
✅ No Additional Software Required
-
Fully built in Excel
-
Easy adoption for all teams
Who Should Use a Procurement Analytics Dashboard in Excel?
This dashboard suits many roles and industries.
-
Procurement Managers
-
Supply Chain Heads
-
Finance Teams
-
Operations Managers
-
Manufacturing and Service Organizations
-
Retail and Distribution Companies
If your organization manages procurement budgets, suppliers, and delivery timelines, this dashboard becomes a valuable asset.
Best Practices for the Procurement Analytics Dashboard in Excel
To get maximum value from the dashboard, teams should follow these best practices.
✅ Maintain Clean Data
-
Standardize category and department names
-
Validate cost and lead-time data regularly
✅ Update Data Frequently
-
Refresh the data sheet weekly or monthly
-
Avoid outdated insights
✅ Use Slicers Strategically
-
Analyze performance by one dimension at a time
-
Compare periods consistently
✅ Monitor Key KPIs Regularly
-
Focus on delayed delivery %
-
Track cost variance continuously
✅ Share Insights with Stakeholders
-
Use dashboard visuals in review meetings
-
Align procurement goals across teams
How Does This Dashboard Improve Procurement Strategy?
With consistent use, the Procurement Analytics Dashboard in Excel helps organizations shift from reactive procurement to strategic procurement.
-
Teams predict issues instead of reacting late
-
Leaders negotiate better supplier contracts
-
Organizations reduce procurement waste
-
Management gains confidence in data-driven decisions
Conclusion: Why a Procurement Analytics Dashboard in Excel Matters
Procurement complexity continues to grow as organizations expand operations, supplier networks, and product portfolios. Without proper analytics, procurement teams lose control over budgets, timelines, and supplier performance.
A Procurement Analytics Dashboard in Excel solves these challenges by delivering clarity, structure, and actionable insights. Because it works entirely inside Excel, teams enjoy simplicity without sacrificing analytical power.
By implementing this dashboard, organizations improve efficiency, reduce costs, and strengthen procurement governance.
Frequently Asked Questions (FAQs)
❓ What is a Procurement Analytics Dashboard in Excel used for?
A Procurement Analytics Dashboard in Excel helps organizations track procurement KPIs such as cost variance, lead time, and delayed deliveries from a single interactive platform.
❓ Do I need advanced Excel skills to use this dashboard?
No. Basic Excel knowledge is enough because the dashboard includes slicers, charts, and clear navigation.
❓ Can I customize the dashboard for my organization?
Yes. You can easily customize KPIs, charts, and dimensions such as department, category, or region.
❓ How frequently should I update the data?
You should update procurement data weekly or monthly to keep insights accurate and relevant.
❓ Is this dashboard suitable for large organizations?
Yes. The dashboard works for small, medium, and large organizations as long as procurement data stays structured.
Visit our YouTube channel to learn step-by-step video tutorials