Procurement Analytics KPI Dashboard in ExcelEvery organization depends on a strong procurement function to control spending, manage suppliers, reduce risks, and ensure timely purchasing. Procurement Analytics KPI Dashboard in Excel However, many procurement teams still track KPIs manually, use scattered spreadsheets, and prepare reports at the last minute. This causes delays, confusion, and missed opportunities for cost savings.
A Procurement Analytics KPI Dashboard in Excel solves these problems by bringing all procurement insights into one interactive file. It helps teams analyze performance using clear visuals, MTD and YTD numbers, trend charts, and KPI definitions—all in a single place. With this dashboard, procurement heads, analysts, and finance teams make faster and more accurate decisions.
In this guide, you will learn how this dashboard works, what each worksheet includes, and how the entire system helps you transform procurement reporting.
Click to Purchases Procurement Analytics KPI Dashboard in Excel
What Is a Procurement Analytics KPI Dashboard in Excel?
A Procurement Analytics KPI Dashboard in Excel is a ready-to-use performance management tool that tracks all major procurement KPIs. You get a structured view of actual performance, targets, and previous year values for Month-to-Date (MTD) and Year-to-Date (YTD). The dashboard uses dynamic formulas, conditional formatting, drop-downs, and trend charts to simplify analysis.
You can track KPIs such as:
-
Total Spend
-
Cost Savings
-
Supplier Performance
-
On-Time Delivery
-
Purchase Order Efficiency
-
Contract Compliance
-
Procurement Cycle Time
-
Inventory Accuracy
-
Supplier Lead Time
-
Purchase Request Approval Time
Since Excel is customizable, you can add your own KPIs or modify existing ones easily.
Click to Purchases Procurement Analytics KPI Dashboard in Excel
Why Do Businesses Need a Procurement KPI Dashboard?
Procurement impacts company profitability more than any other back-office function. A small mistake in purchasing can lead to huge financial losses. That’s why procurement teams need real-time visibility.
A KPI dashboard helps because:
-
It removes manual calculations.
-
It reduces reporting time.
-
It shows performance gaps clearly.
-
It highlights savings opportunities.
-
It improves supplier negotiations.
-
It supports strategic decision-making.
With this Excel dashboard, procurement becomes more transparent, predictable, and efficient.
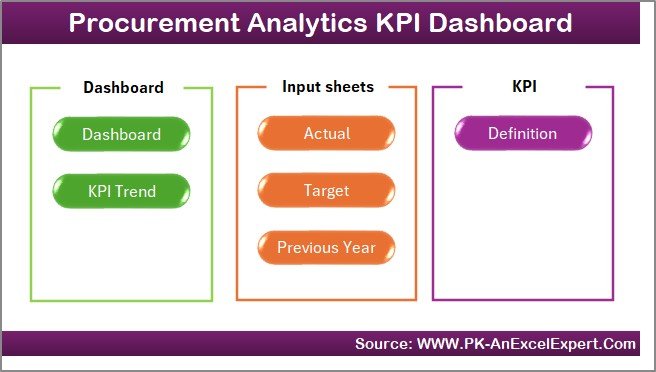
What Are the Key Worksheets in This Dashboard?
The Procurement Analytics KPI Dashboard in Excel contains 7 worksheets:
-
Home Sheet
-
Dashboard Sheet
-
KPI Trend Sheet
-
Actual Numbers Input Sheet
-
Target Sheet
-
Previous Year Sheet
-
KPI Definition Sheet
Let’s look at each worksheet in detail.
1. Home Sheet
The Home Sheet is the entry page of the dashboard. It acts as a clean index page with six buttons. Each button takes you to a specific worksheet.
Buttons include:
-
Dashboard Page
-
KPI Trend Page
-
Actual Numbers Input
-
Target Numbers Input
-
Previous Year Numbers
-
KPI Definition
This makes navigation fast and user-friendly, especially for new users.
2. Dashboard Sheet
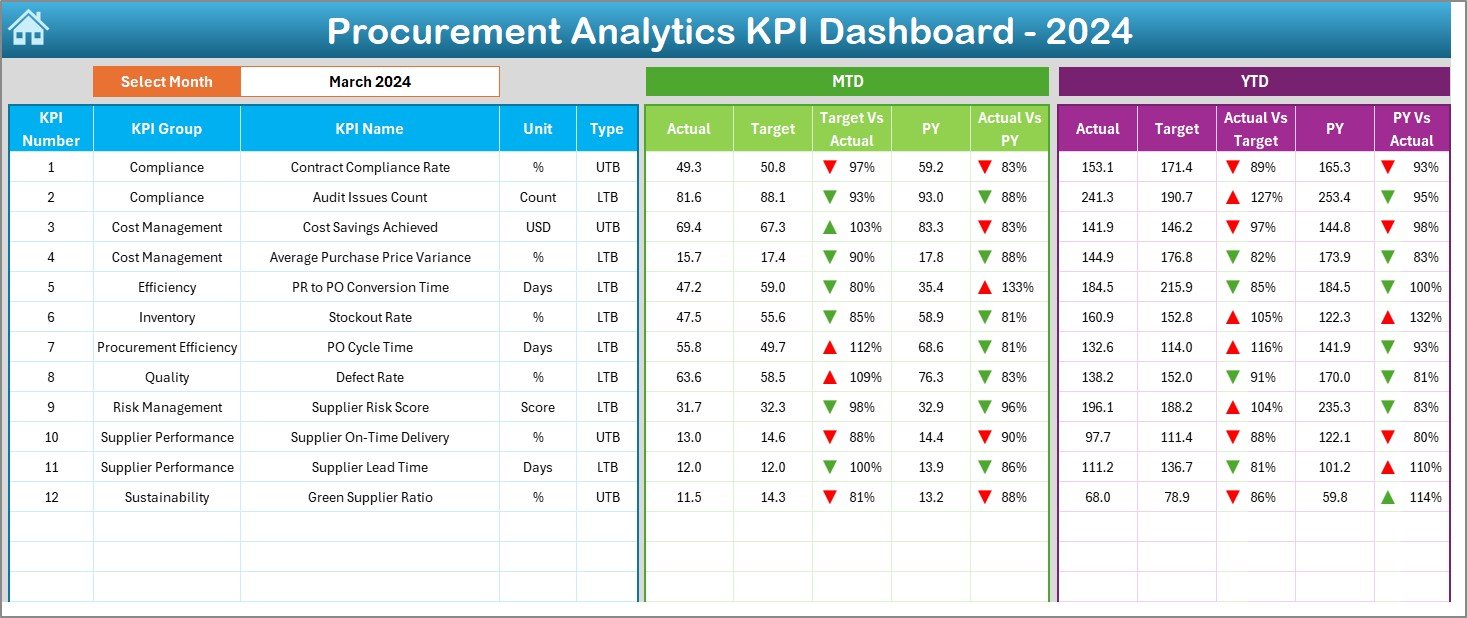
The Dashboard Sheet is the main reporting page where procurement teams spend most of their time. It gives a clear, comprehensive view of all procurement KPIs.
🔹 Month Selection (Cell D3)
On cell D3, you select the month from a drop-down list.
When you choose a month:
-
All KPIs update instantly
-
MTD and YTD numbers refresh
-
Conditional formatting arrows change
-
Previous Year comparisons adjust
This makes the dashboard dynamic and easy to use.
MTD Section – Month-to-Date Performance
The dashboard provides the following MTD insights:
-
Actual MTD Values
-
Target MTD Values
-
Previous Year MTD Values
-
Target vs Actual %
-
Previous Year vs Actual %
Conditional formatting uses:
-
Green Up Arrow (▲) – Performance improved or meets target
-
Red Down Arrow (▼) – Performance declined or missed target
This helps procurement teams identify immediate monthly issues.
YTD Section – Year-to-Date Performance
The YTD section works the same way but gives a bigger picture. It includes:
-
Actual YTD
-
YTD Target
-
Previous Year YTD
-
Target vs Actual %
-
PY vs Actual %
-
KPI Status Indicator (▲ or ▼)
If purchases exceed annual budgets or savings drop compared to last year, this section highlights the issue instantly.
Click to Purchases Procurement Analytics KPI Dashboard in Excel
3. KPI Trend Sheet
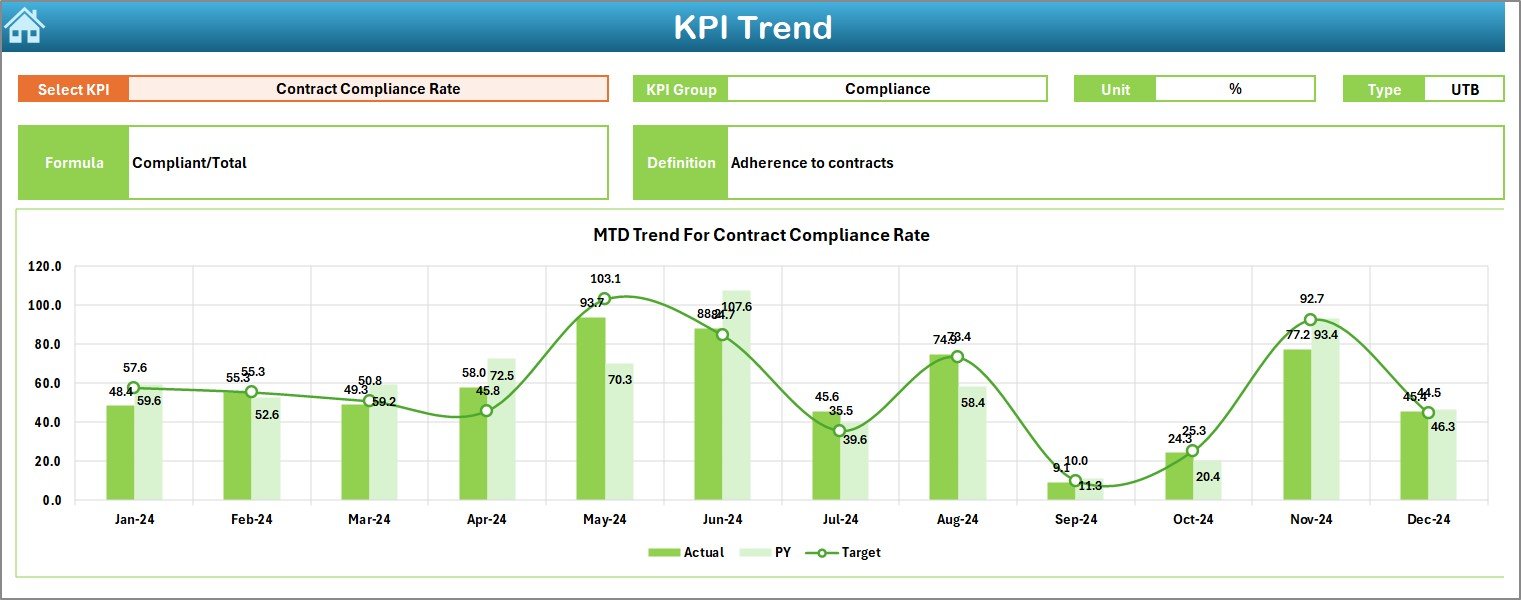
The KPI Trend Sheet lets you analyze each KPI month-wise.
This sheet contains:
✔ KPI Name Drop-Down (Cell C3)
Select a KPI to update the trend charts.
✔ KPI Details Shown Automatically
Once selected, the sheet displays:
-
KPI Group
-
KPI Unit
-
KPI Type (UTB or LTB)
-
KPI Formula
-
KPI Definition
This helps your team understand what each KPI represents.
✔ MTD Trend Charts
Shows Actual, Target, and Previous Year monthly movement.
✔ YTD Trend Charts
Shows cumulative progress for the year.
These charts help you identify patterns such as:
-
Cost increases
-
Supplier performance issues
-
Lead time spikes
-
Delays in procurement
-
Seasonal variations
Trend tracking helps procurement leaders make strategic decisions based on data, not assumptions.
Click to Purchases Procurement Analytics KPI Dashboard in Excel
4. Actual Numbers Input Sheet
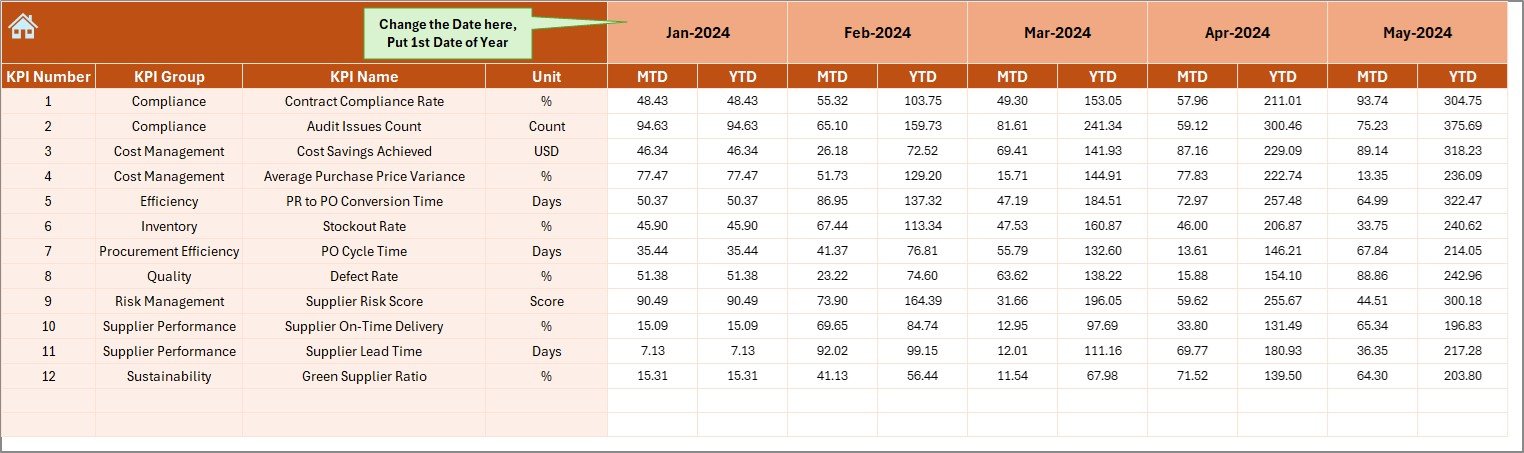
This sheet captures real procurement performance.
You enter:
-
KPI Name
-
Month
-
Actual MTD Value
-
Actual YTD Value
You can adjust the first month of the year from cell E1.
The dashboard then calculates YTD automatically for all KPIs.
This sheet ensures high data accuracy without manual adjustments.
5. Target Sheet
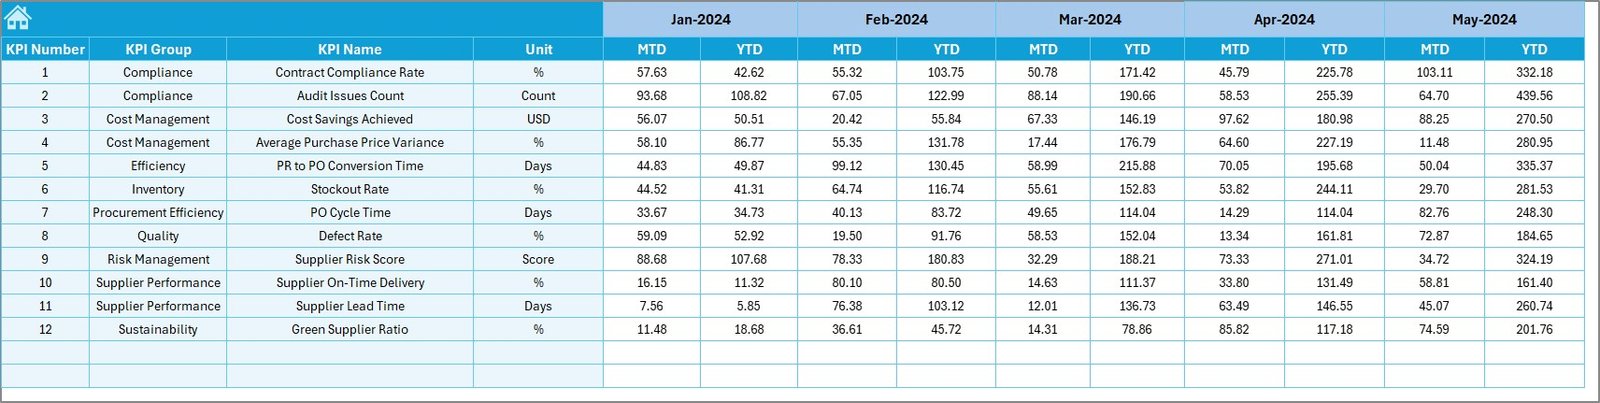
The Target Sheet lets you define the performance expectations for each KPI. It includes:
-
KPI Name
-
Month
-
Target MTD
-
Target YTD
Targets help align procurement goals with organizational objectives.
For example:
-
Reduce supplier lead time
-
Improve contract compliance
-
Increase cost savings
-
Improve on-time delivery
Targets also drive accountability and highlight areas for improvement.
6. Previous Year Sheet
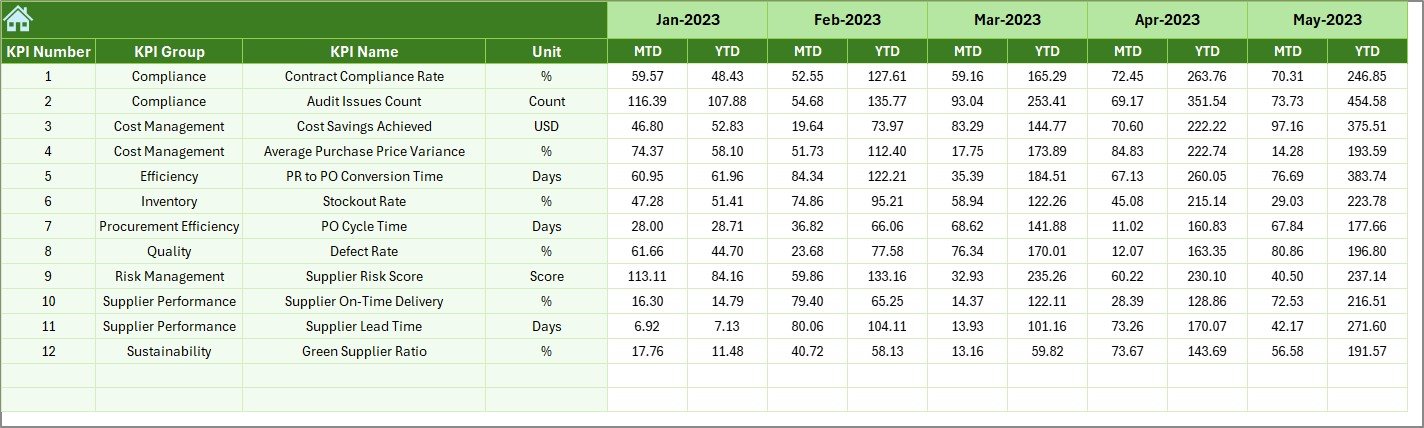
Historical comparison is critical in procurement because many KPIs depend on year-over-year trends.
This sheet includes:
-
Previous Year MTD
-
Previous Year YTD
Comparing past and current values helps answer questions such as:
-
Are suppliers performing better than last year?
-
Are we reducing procurement cycle time?
-
Are cost savings increasing?
-
Is contract compliance improving?
This data also helps procurement leaders negotiate better with suppliers.
Click to Purchases Procurement Analytics KPI Dashboard in Excel
7. KPI Definition Sheet
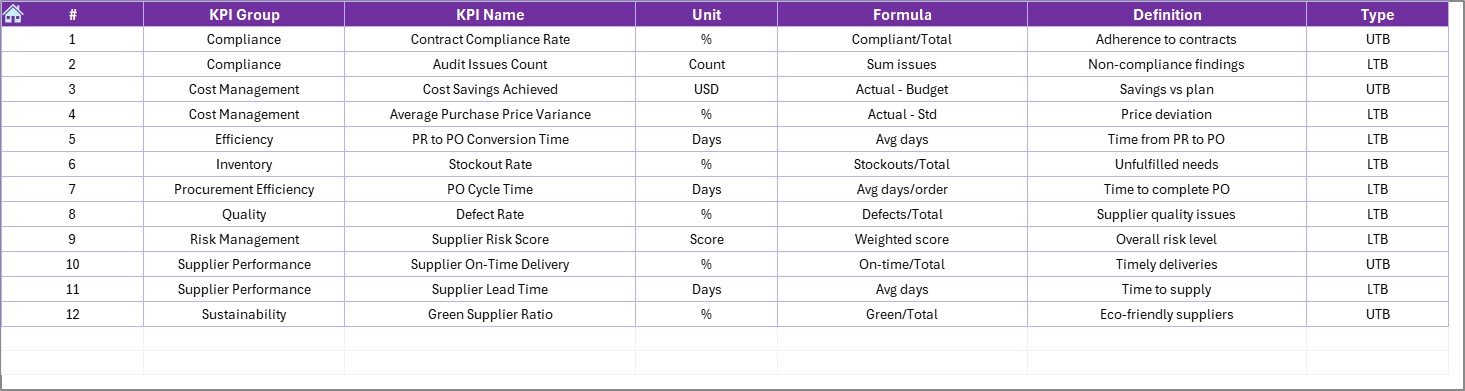
This sheet contains:
-
KPI Name
-
KPI Group
-
Unit
-
KPI Formula
-
KPI Definition
This helps maintain consistency in reporting.
New analysts or auditors can easily understand:
-
How KPIs are calculated
-
What they represent
-
When they are used
-
Expected interpretation
This sheet removes confusion and supports transparent reporting.
Click to Purchases Procurement Analytics KPI Dashboard in Excel
Advantages of Procurement Analytics KPI Dashboard in Excel
Using this dashboard offers several benefits:
✔ Faster and More Accurate Reporting
MTD and YTD numbers refresh instantly when you change the month.
✔ Better Spend Management
Track spend patterns, cost savings, and contract performance.
✔ Improved Supplier Performance
Compare supplier metrics and identify weak performers.
✔ Complete Visibility
Get clear insights across all procurement processes.
✔ Stronger Decision-Making
Use trends, comparisons, and percentages to make confident decisions.
✔ Reduced Manual Work
Avoid repetitive reporting tasks using automated formulas.
✔ Easy Customization
Since it’s in Excel, you can modify KPIs, add new visuals, or redesign the template.
Click to Purchases Procurement Analytics KPI Dashboard in Excel
Best Practices for Using a Procurement KPI Dashboard
To get maximum value, follow these best practices:
1. Update Data Monthly
Enter MTD, YTD, and target values regularly.
2. Keep KPIs Simple and Relevant
Avoid unnecessary KPIs that do not support decision-making.
3. Set Realistic Targets
Use historical data before setting new goals.
4. Monitor Trends Consistently
Use the KPI Trend Sheet to evaluate long-term performance.
5. Validate Data Sources
Ensure actual numbers match ERP or procurement systems.
6. Improve Supplier Communication
Use KPI results for supplier reviews and contract negotiations.
7. Review YTD Numbers Quarterly
This helps avoid year-end surprises and budget overruns.
Conclusion
The Procurement Analytics KPI Dashboard in Excel is a powerful tool for tracking procurement efficiency, supplier performance, cost metrics, and annual savings. With seven structured worksheets, dynamic charts, trend visuals, and automated comparisons, procurement reporting becomes easier, faster, and more insightful.
This dashboard helps reduce spending, improve supplier quality, and support better business decisions. When used consistently, it turns procurement into a strategic, data-driven function.
Click to Purchases Procurement Analytics KPI Dashboard in Excel
Frequently Asked Questions (FAQs)
1. What is a Procurement Analytics KPI Dashboard?
It is an Excel-based tool that tracks procurement KPIs such as spend, savings, supplier performance, and delivery accuracy.
2. Can I customize the KPIs?
Yes, you can add or remove KPIs based on your organization’s needs.
3. Does the dashboard support MTD and YTD values?
Yes, it calculates and displays both Month-to-Date and Year-to-Date performance.
4. How do I update the dashboard?
Just enter values in the Actual, Target, and Previous Year sheets. The dashboard updates automatically.
5. Is Excel enough for procurement analytics?
Yes. Excel is powerful, flexible, and widely used—perfect for KPI reporting.
6. Who should use this dashboard?
Procurement managers, analysts, finance teams, and supply chain leaders.
Click to Purchases Procurement Analytics KPI Dashboard in Excel
Visit our YouTube channel to learn step-by-step video tutorials