Procurement teams handle one of the most critical business functions—managing costs, vendors, contracts, delivery timelines, and compliance. However, procurement data often stays scattered across spreadsheets, emails, and systems. Procurement Analytics KPI Dashboard in Power BI Because of this, leadership teams struggle to track performance, measure efficiency, and control spending.
A Procurement Analytics KPI Dashboard in Power BI solves this challenge. Procurement Analytics KPI Dashboard in Power BI It delivers a clear, structured, and visual way to monitor procurement KPIs in real time. Moreover, it helps procurement managers, sourcing teams, and finance leaders make faster and more confident decisions.
In this detailed guide, you will learn what a Procurement Analytics KPI Dashboard in Power BI is, how it works, what pages it includes, how Excel supports the data model, and why it adds immense value to modern procurement operations.
Click to Purchases Procurement Analytics KPI Dashboard in Power BI
What Is a Procurement Analytics KPI Dashboard in Power BI?
A Procurement Analytics KPI Dashboard in Power BI is a ready-to-use analytical solution that tracks procurement performance metrics in one centralized dashboard. It pulls data from structured Excel files and converts raw numbers into interactive visuals, tables, and trends.
Instead of reviewing static reports, users can slice data by month, KPI group, or KPI name. As a result, procurement teams gain instant insights into targets met, targets missed, year-over-year performance, and long-term trends.
Power BI makes procurement analytics simple, visual, and scalable. At the same time, Excel remains the data input source, which keeps data entry easy for all teams.
Why Do Organizations Need Procurement Analytics?
Procurement directly impacts cost control, supplier quality, delivery timelines, and risk management. However, many organizations still rely on manual tracking methods. This slows down analysis and increases errors.
A Procurement Analytics KPI Dashboard helps organizations:
-
Track procurement performance consistently
-
Compare actual results against targets
-
Identify cost overruns quickly
-
Monitor improvements over time
-
Support strategic sourcing decisions
Because everything updates automatically, teams save time and improve accuracy.
Click to Purchases Procurement Analytics KPI Dashboard in Power BI
What Are the Key Features of the Procurement Analytics KPI Dashboard in Power BI?
This dashboard comes with three structured pages, each designed for a specific analytical purpose. Together, they provide a complete view of procurement performance.
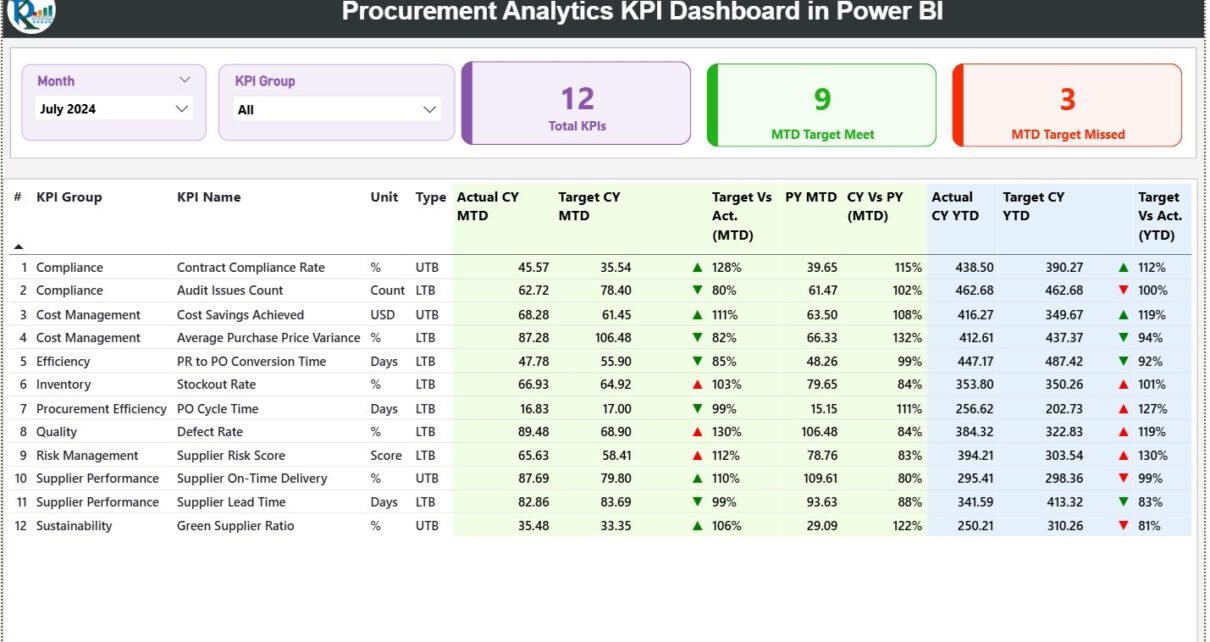
1. Summary Page
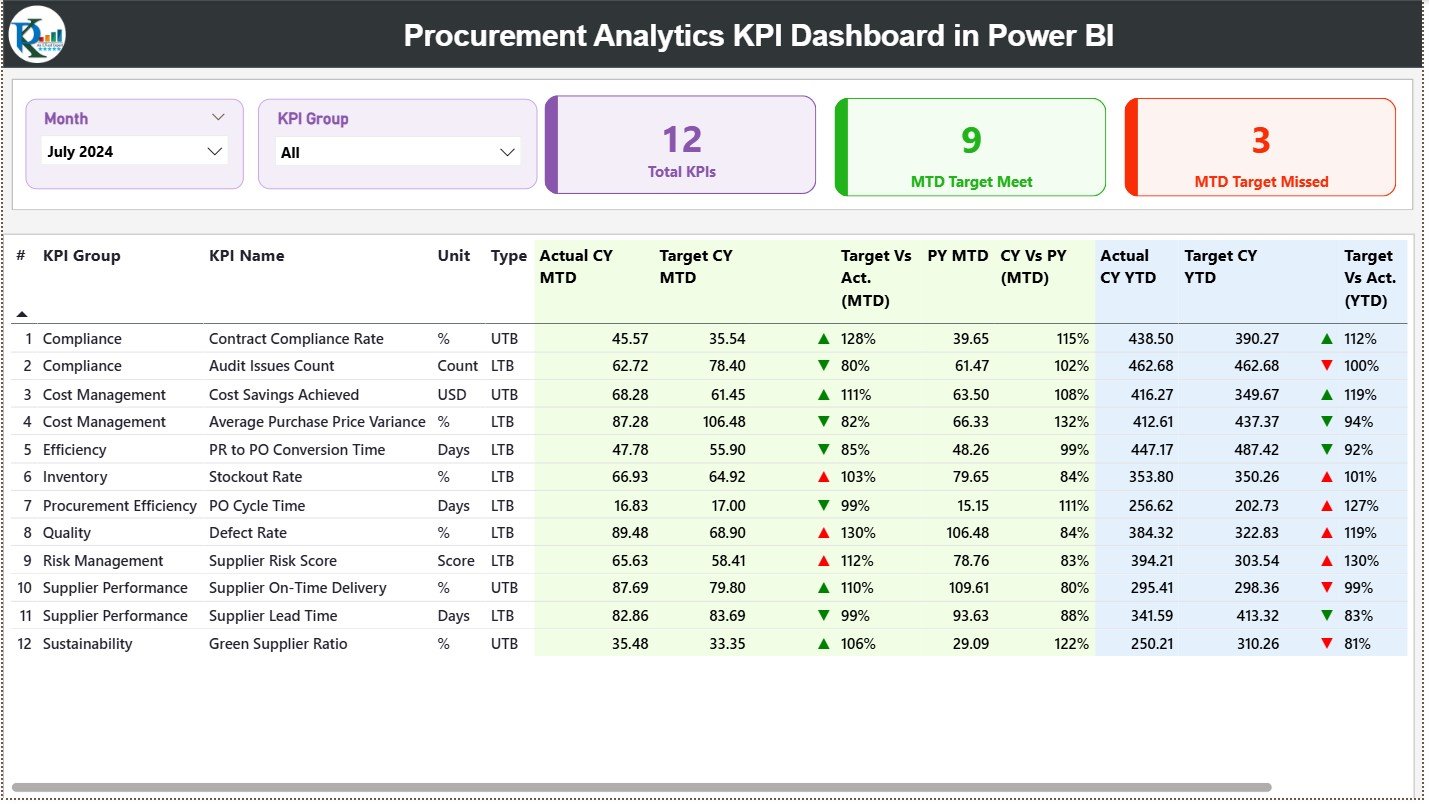
The Summary Page acts as the main control center of the dashboard. This page offers a high-level overview of all procurement KPIs while also allowing users to drill down into details.
Interactive Slicers for Quick Analysis
At the top of the Summary Page, the dashboard includes two powerful slicers:
-
Month slicer to analyze specific reporting periods
-
KPI Group slicer to focus on specific procurement KPI categories
These slicers instantly update all visuals below them.
KPI Performance Cards for Instant Insights
The Summary Page displays three key performance cards:
-
Total KPIs Count – Shows the total number of tracked procurement KPIs
-
MTD Target Met Count – Highlights how many KPIs meet the monthly target
-
MTD Target Missed Count – Shows how many KPIs fall below expectations
Because these cards stand out visually, leaders understand performance at a glance.
Detailed KPI Performance Table Explained
Below the cards, the dashboard displays a detailed KPI table. This table serves as the backbone of procurement performance analysis.
Each column provides specific insights:
-
KPI Number – Displays the sequence number of each KPI
-
KPI Group – Shows the category or domain of the KPI
-
KPI Name – Clearly identifies the metric being tracked
-
Unit – Defines the measurement unit, such as %, days, or currency
-
Type (LTB or UTB) – Identifies whether lower or higher values indicate better performance
How Does MTD Performance Tracking Work?
The dashboard focuses strongly on Month-to-Date (MTD) analysis:
-
Actual CY MTD – Shows the actual current-year MTD value
-
Target CY MTD – Displays the defined target for the same period
-
MTD Icon – Uses green ▲ or red ▼ icons to indicate target achievement
-
Target vs Actual (MTD) – Calculates performance using Actual ÷ Target
-
PY MTD – Shows the previous year’s MTD value
-
CY vs PY (MTD) – Calculates year-over-year MTD change
Because of this structure, users immediately understand current performance and improvement trends.
How Does YTD Performance Tracking Work?
In addition to monthly analysis, the dashboard tracks Year-to-Date (YTD) performance:
-
Actual CY YTD – Current year cumulative actual value
-
Target CY YTD – Current year cumulative target value
-
YTD Icon – Indicates target status using visual arrows
-
Target vs Actual (YTD) – Measures performance ratio
-
PY YTD – Previous year cumulative performance
-
CY vs PY (YTD) – Compares current and previous year results
This YTD view helps leaders assess long-term procurement efficiency.
2. KPI Trend Page
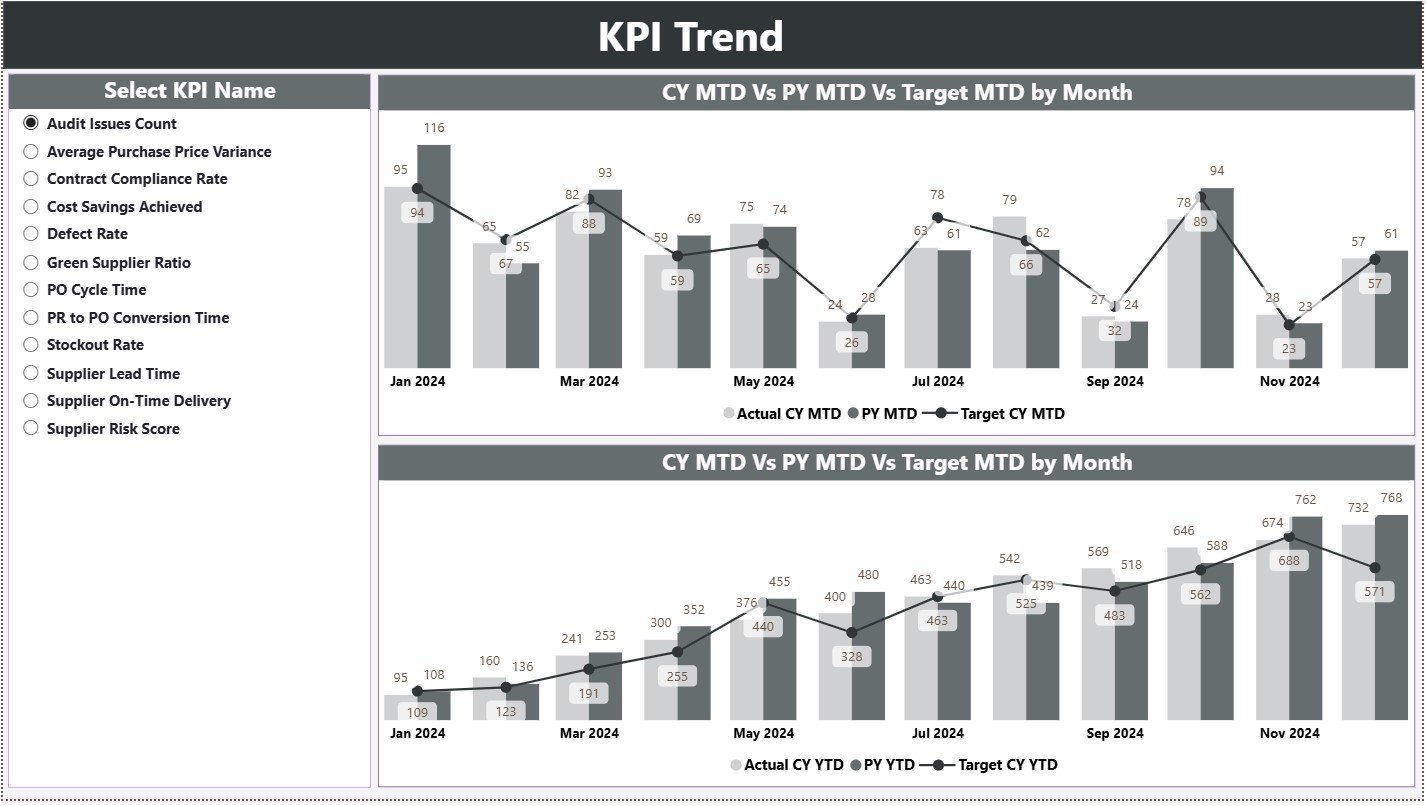
The KPI Trend Page helps users analyze performance patterns over time rather than static numbers.
KPI Selection for Focused Analysis
A slicer on the left allows users to select a specific KPI name. As a result, all trend charts update instantly.
Combo Charts for Clear Trend Comparison
This page includes two combo charts:
-
MTD Trend Chart – Shows current year actuals, previous year actuals, and targets
-
YTD Trend Chart – Displays long-term performance trends
These charts help users:
-
Detect seasonal variations
-
Compare targets against actual values
-
Identify early warning signs
Because visuals tell the story quickly, decision-making becomes easier.
Click to Purchases Procurement Analytics KPI Dashboard in Power BI
3. KPI Definition Page
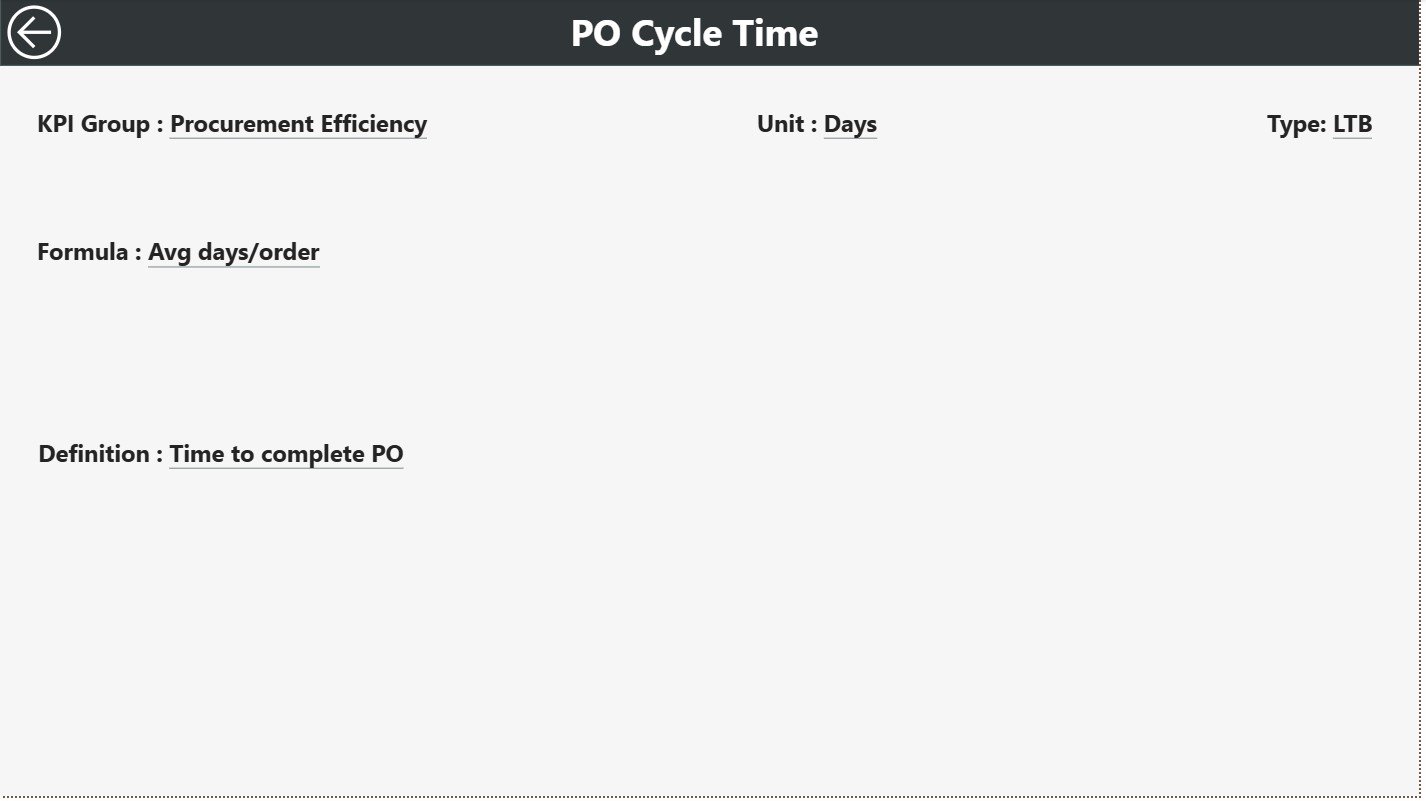
The KPI Definition Page adds depth and clarity to the dashboard.
Drill-Through Capability for KPI Details
This page remains hidden by default. Users access it using drill-through from the Summary Page.
Here, users can view:
-
KPI Formula
-
Detailed KPI Definition
-
Measurement logic
This approach ensures data transparency and avoids confusion among stakeholders.
Easy Navigation with Back Button
A back button on the top-left corner allows quick navigation back to the Summary Page. This smooth user experience keeps dashboards easy to use.
How Does Excel Act as the Data Source?
The dashboard uses Excel as the data source, which keeps data entry simple and flexible.
What Is the Role of the Input_Actual Sheet?
In the Input_Actual sheet, users enter:
-
KPI Name
-
Month (first date of the month)
-
MTD actual values
-
YTD actual values
This structured format ensures accurate reporting.
What Is the Role of the Input_Target Sheet?
In the Input_Target sheet, users fill:
-
KPI Name
-
Month (first date of the month)
-
MTD target values
-
YTD target values
Targets remain separate from actuals, which improves control and clarity.
What Does the KPI Definition Sheet Contain?
The KPI Definition sheet stores all metadata:
-
KPI Number
-
KPI Group
-
KPI Name
-
Unit
-
Formula
-
Definition
-
KPI Type (LTB or UTB)
Because this table drives the entire dashboard logic, it ensures consistency.
Click to Purchases Procurement Analytics KPI Dashboard in Power BI
Advantages of Procurement Analytics KPI Dashboard in Power BI
Using this dashboard offers multiple benefits:
✅ Centralizes all procurement KPIs
✅ Highlights target achievements instantly
✅ Improves decision-making speed
✅ Reduces manual reporting efforts
✅ Supports strategic sourcing initiatives
✅ Enhances transparency across teams
As a result, procurement teams operate with confidence and clarity.
How Does This Dashboard Support Procurement Decision-Making?
This dashboard empowers leaders to:
-
Control costs proactively
-
Track supplier performance trends
-
Identify inefficiencies early
-
Monitor continuous improvement
-
Align procurement goals with business strategy
Because dashboards update automatically, leaders act faster on real data.
Best Practices for the Procurement Analytics KPI Dashboard in Power BI
To get the best results, follow these best practices:
-
Keep KPI definitions clear and measurable
-
Use consistent units across all KPIs
-
Update Excel data regularly
-
Review MTD and YTD metrics together
-
Use drill-through features for detailed analysis
-
Train teams on KPI interpretation
Following these practices ensures accuracy and trust in analytics.
Click to Purchases Procurement Analytics KPI Dashboard in Power BI
Who Can Benefit from This Dashboard?
This dashboard suits:
-
Procurement managers
-
Strategic sourcing teams
-
Finance and cost controllers
-
Operations leaders
-
Supply chain professionals
Because it uses Excel and Power BI, anyone can adopt it quickly.
Conclusion
A Procurement Analytics KPI Dashboard in Power BI transforms raw procurement data into actionable insights. It brings transparency, control, and efficiency into procurement operations. With structured Excel input sheets, interactive visuals, drill-through definitions, and trend analysis, teams gain everything they need to track performance confidently.
When procurement teams rely on data instead of assumptions, they control costs better, improve supplier relationships, and support long-term business growth.
Click to Purchases Procurement Analytics KPI Dashboard in Power BI
Frequently Asked Questions (FAQs)
What is a Procurement Analytics KPI Dashboard in Power BI used for?
It tracks procurement performance, compares targets with actuals, and supports data-driven procurement decisions.
Does this dashboard require advanced Power BI skills?
No. The dashboard uses a ready-to-use model with Excel input sheets, making it accessible for all users.
Can I customize KPIs in this dashboard?
Yes. You can add, remove, or modify KPIs using the KPI Definition Excel sheet.
How often should procurement data be updated?
You should update data monthly or more frequently based on reporting requirements.
Does this dashboard support year-over-year analysis?
Yes. It compares current year and previous year performance using MTD and YTD metrics.
Click to Purchases Procurement Analytics KPI Dashboard in Power BI
Visit our YouTube channel to learn step-by-step video tutorials