In today’s competitive business world, successful product development depends on data-driven decisions. Companies need to track budgets, timelines, departmental performance, and completion status to ensure that every project delivers results on time. To manage all of this, many organizations now rely on a Product Development Dashboard in Excel.
This dashboard acts as a central reporting system where managers can view key insights, compare performance, and make better decisions. In this article, we will explain everything you need to know about the Product Development Dashboard in Excel, including its features, advantages, best practices, and frequently asked questions.
Click to Purchases Product Development Dashboard in Excel
What is a Product Development Dashboard in Excel?
A Product Development Dashboard in Excel is a visual reporting tool that helps businesses monitor product progress from start to finish. It consolidates data into easy-to-read charts, percentages, and reports so that managers can track budget usage, timelines, delays, and departmental efficiency.
Instead of switching between multiple reports and spreadsheets, this dashboard brings everything together in one structured format. With built-in slicers and interactive charts, managers can drill down into department, stage, or status analysis quickly.
Key Features of the Product Development Dashboard
The Product Development Dashboard in Excel template includes powerful features that make it a practical tool for teams of any size. Let’s explore its main highlights:
Page Navigator
On the left-hand side, the dashboard includes a page navigator that makes switching between sections effortless. Users don’t need to scroll endlessly or search for tabs; they can simply click and move to the desired analysis page.
Five Analytical Pages
The dashboard contains five interactive pages that focus on different areas of product development:
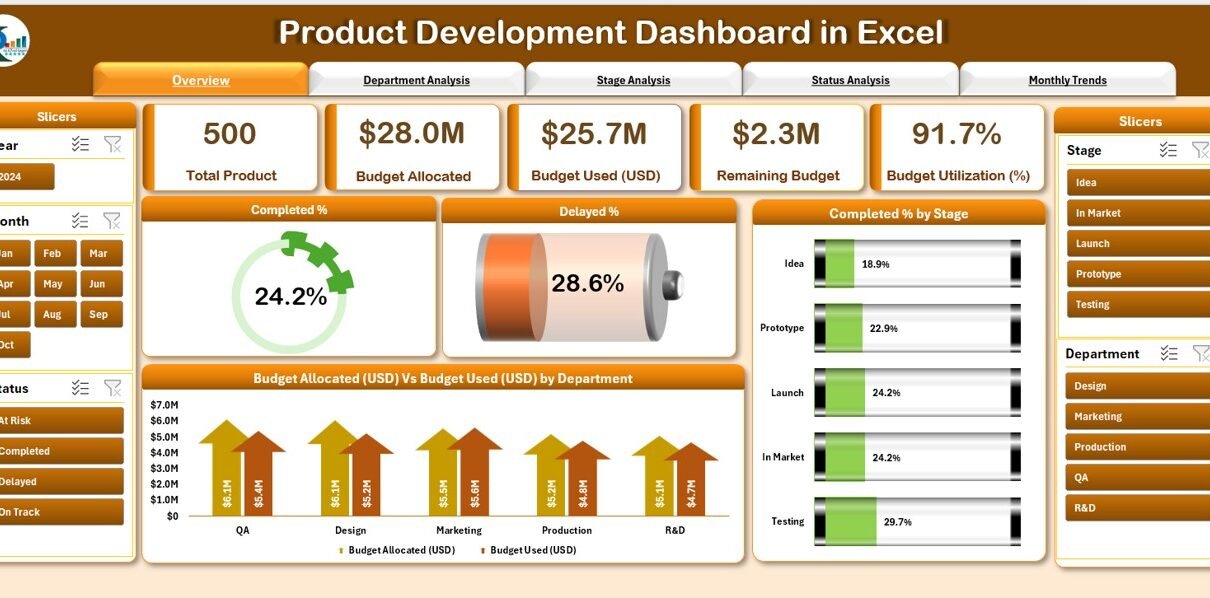
Overview Page
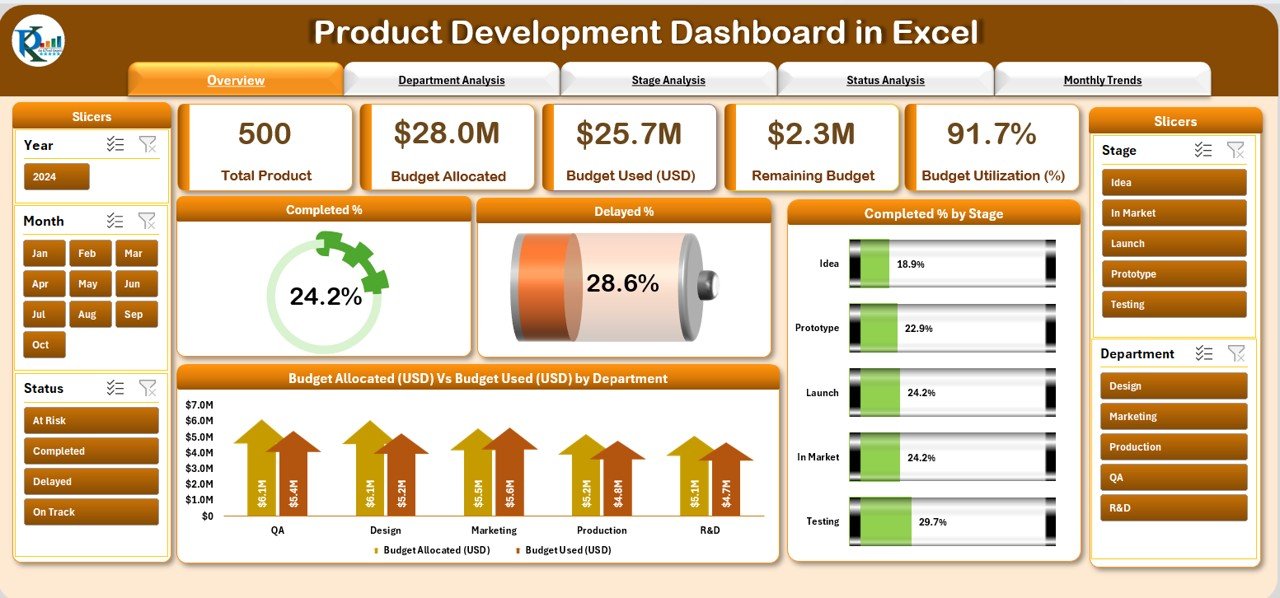
The Overview Page is the central summary of the entire dashboard.
Here, you can find:
-
Completion % – Tracks the percentage of projects successfully completed.
-
Delayed % – Shows the ratio of delayed tasks compared to planned timelines.
-
Completed % by Stage – Gives clarity on how much progress each stage of product development has achieved.
-
Budget Allocation vs Budget Used by Department – Displays how much of the allocated budget each department has consumed.
Department Analysis
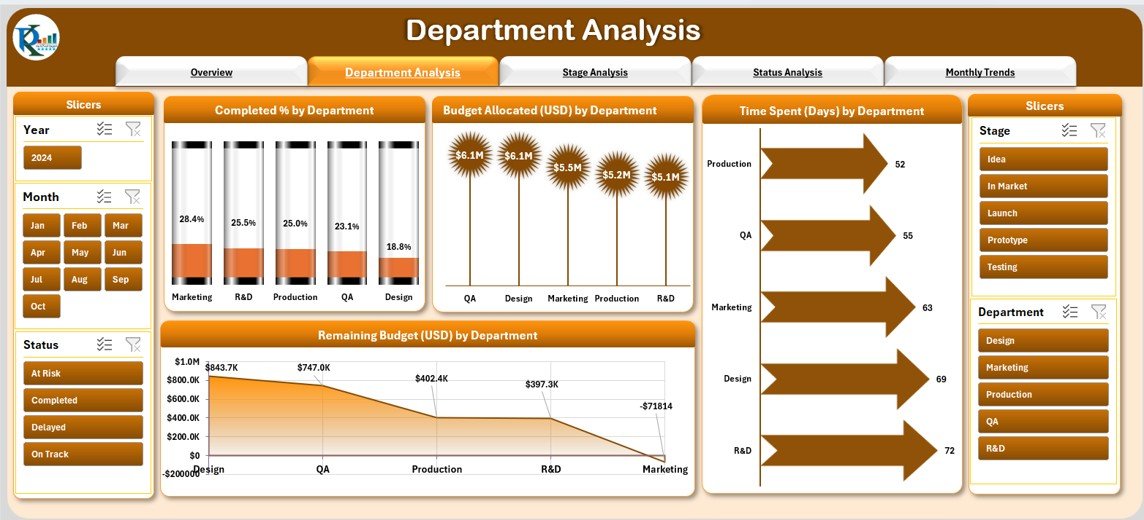
This page focuses on department-level insights. You can analyze:
-
Completed % by Department – Understand which department is most efficient.
-
Budget Allocation (USD) by Department – Compare allocated budgets for different teams.
-
Time Spent (Days) by Department – Spot which teams take more time than others.
-
Remaining Budget (USD) by Department – Keep an eye on budget savings or overspending.
Stage Analysis
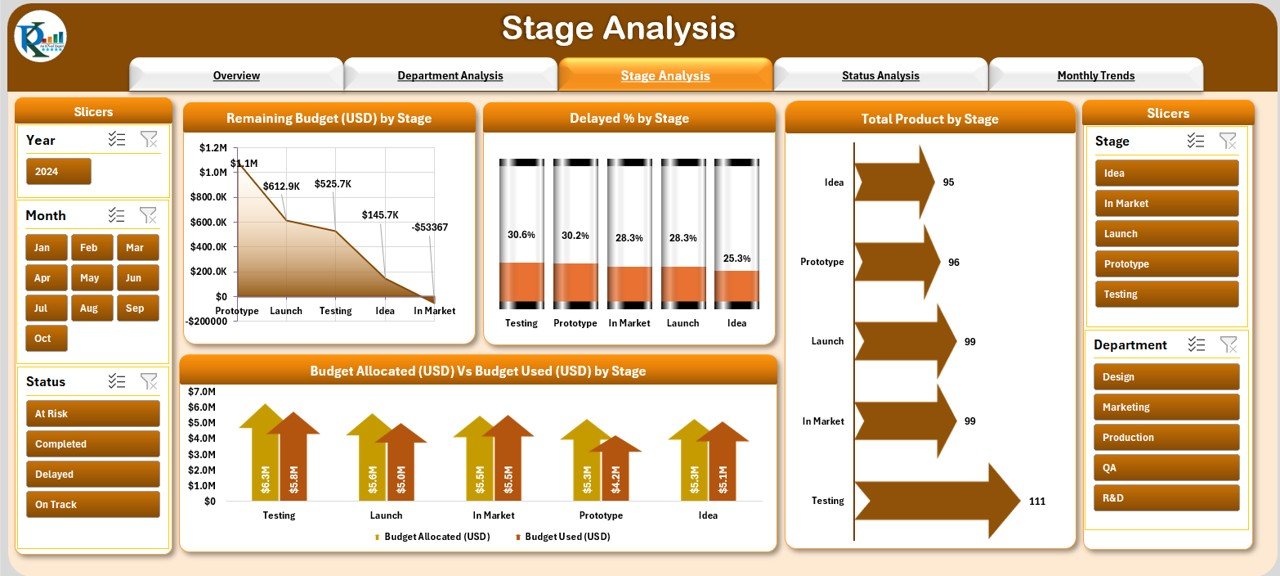
Here, the focus is on product development stages. The page highlights:
-
Remaining Budget (USD) by Stage – Understand which stage consumes the most money.
-
Delayed % by Stage – Spot delays at specific stages.
-
Total Products by Stage – Track how many products are currently at each stage.
-
Budget Allocation vs Budget Used by Stage – Review cost management per stage.
Status Analysis
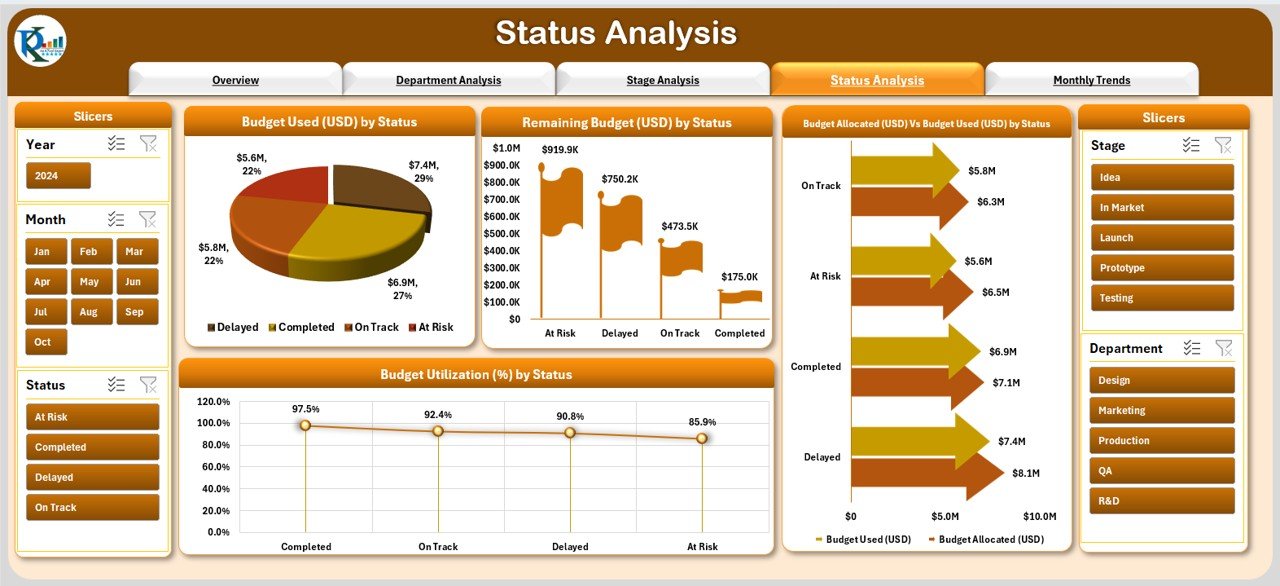
The Status Analysis page provides insight into the overall status of product development. It includes:
-
Budget Used (USD) by Status – Analyze cost utilization by project status.
-
Remaining Budget (USD) by Status – Track how much budget is still left for active projects.
-
Budget Allocation vs Budget Used by Status – Ensure that spending aligns with planning.
-
Budget Utilization (%) by Status – Measure cost efficiency at different stages.
-
Click to Purchases Product Development Dashboard in Excel
Monthly Trends
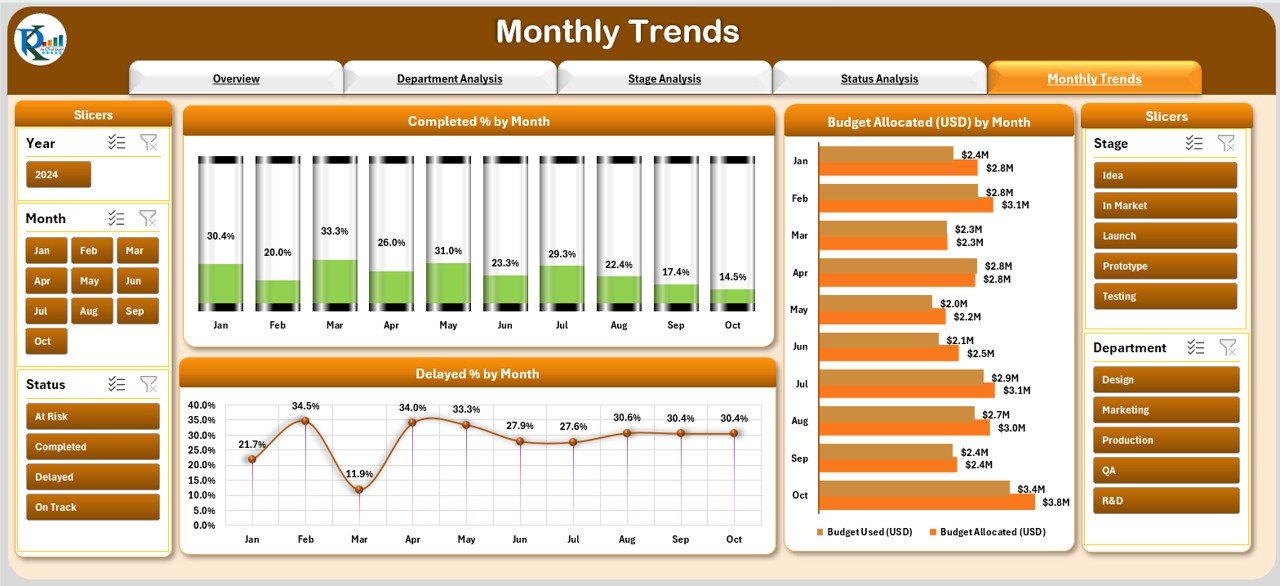
The final page focuses on trends over time. This helps managers track overall performance month by month. It includes:
-
Completed % by Month – See how completion rates improve or decline.
-
Budget Allocation vs Budget Used by Month – Monitor monthly spending.
-
Delayed % by Month – Spot months with high delays.
Why Do You Need a Product Development Dashboard in Excel?
Many businesses struggle with managing product lifecycles because their data is scattered across multiple sheets. A Product Development Dashboard solves this by:
-
Centralizing all data into one view.
-
Highlighting potential risks early.
-
Improving budget planning and tracking.
-
Saving time by automating performance reports.
-
Helping leaders make quick and informed decisions.
With Excel’s flexibility, businesses can also customize this dashboard according to their needs without expensive software.
Advantages of Using a Product Development Dashboard
The benefits of a Product Development Dashboard in Excel are significant. Some of the main advantages include:
✅ Improved Transparency – Everyone in the organization can view progress clearly.
✅ Better Budget Control – Track allocated vs. used budgets instantly.
✅ Time Management – Identify delays quickly and take corrective actions.
✅ Department Accountability – Spot which departments are overperforming or underperforming.
✅ Data-Driven Decisions – Base decisions on numbers, not assumptions.
✅ Easy Customization – Excel allows adding new KPIs and adjusting visuals as per business needs.
Opportunities for Improvement in Product Development Dashboards
Even though this dashboard is powerful, businesses can improve it further by:
-
🔄 Integrating Automation – Linking Excel with tools like Power BI or Google Sheets for real-time updates.
-
🔄 Adding Forecasting Models – Using trend analysis to predict future delays or budget overuse.
-
🔄 Enhancing Visualization – Including heatmaps, progress bars, or traffic-light indicators for better clarity.
-
🔄 Mobile Accessibility – Making the dashboard mobile-friendly so managers can check updates on the go.
-
🔄 Team Collaboration Features – Embedding comments and task assignments directly into Excel files.
Best Practices for the Product Development Dashboard
To get maximum value from the dashboard, businesses should follow these best practices:
-
Update Data Regularly – Ensure that project data, timelines, and budgets are updated consistently.
-
Use Simple Charts – Avoid clutter and focus on charts that highlight insights clearly.
-
Define KPIs Clearly – Every department should know which KPIs are being tracked.
-
Focus on Actionable Insights – Always use the dashboard to make decisions, not just for reporting.
-
Train Your Team – Ensure that managers and staff know how to read and interpret dashboard insights.
-
Customize When Needed – Modify the dashboard according to the organization’s size and industry.
How to Build a Product Development Dashboard in Excel?
Building such a dashboard involves several steps:
-
Identify Key Metrics – Decide which KPIs you want to track (e.g., Completion %, Budget Used, Delays).
-
Collect Data – Use input sheets for all project data like tasks, departments, and budgets.
-
Design Layout – Create separate pages for Overview, Department Analysis, Stage Analysis, Status Analysis, and Trends.
-
Use Pivot Tables – Summarize data quickly with pivot tables and pivot charts.
-
Add Slicers – Use slicers for easy navigation and filtering.
-
Apply Conditional Formatting – Highlight trends, delays, or overspending with arrows and colors.
-
Test and Improve – Always test the dashboard with real data and refine visuals as needed.
Conclusion
The Product Development Dashboard in Excel is more than just a reporting tool. It is a complete management solution that helps businesses stay on top of projects, budgets, and timelines. With its five analytical pages and easy navigation, companies can identify problems early, manage resources better, and improve efficiency.
When used with best practices, this dashboard can transform product development from a complex process into a smooth, well-managed system.
Frequently Asked Questions (FAQs)
1. What is the purpose of a Product Development Dashboard?
The main purpose is to track budgets, timelines, and project progress in one place. It provides clarity to managers and helps them take faster decisions.
2. Can I customize the Product Development Dashboard in Excel?
Yes, the dashboard is fully customizable. You can add more KPIs, adjust chart types, or include new departments and stages as per your needs.
3. How often should I update the dashboard?
Ideally, you should update it daily or weekly, depending on the project size. Frequent updates ensure that the dashboard always reflects accurate information.
4. Do I need advanced Excel skills to use this dashboard?
Not at all. The dashboard is designed with pivot tables and slicers, which are simple to use. Basic Excel knowledge is enough to manage it.
5. Can this dashboard be used for multiple projects?
Yes. You can add multiple projects and track them side by side by using filters and slicers.
6. What makes this dashboard better than a normal report?
Unlike static reports, this dashboard is interactive. It allows filtering by department, stage, status, or month, making analysis much faster and more detailed.
Visit our YouTube channel to learn step-by-step video tutorials