In today’s competitive market, companies must track campaigns, leads, revenue, and conversion rates in real time. However, many marketing teams still rely on scattered Excel sheets. As a result, managers struggle to compare target vs actual sales. Moreover, they fail to identify which product, channel, or region drives maximum revenue.
So, how can you monitor product performance, campaign efficiency, sales targets, and lead conversion in one powerful system?
The answer is simple.
Click to Purchases Product Marketing Dashboard in Excel
You need a Product Marketing Dashboard in Excel.
In this detailed guide, you will learn:
-
What a Product Marketing Dashboard in Excel is
-
Why businesses need it
-
Complete explanation of all 5 dashboard pages
-
Key KPIs included
-
Advantages of the Product Marketing Dashboard in Excel
-
Best Practices for the Product Marketing Dashboard in Excel
-
Frequently Asked Questions with Answers
Let us explore everything step by step.
What Is a Product Marketing Dashboard in Excel?
A Product Marketing Dashboard in Excel is a ready-to-use performance tracking system designed to monitor marketing campaigns, product performance, sales targets, leads, and revenue — all in one place.
Instead of using multiple reports, you can track:
-
Target Sales vs Actual Sales
-
Target Leads vs Actual Leads
-
Conversion Rate %
-
Revenue by Product
-
Revenue by Region
-
Revenue by Channel
-
Ongoing Campaign %
Because Excel offers flexibility, you can customize this dashboard based on your business needs. Moreover, you can filter data by month, product, region, campaign type, or marketing manager using slicers.
As a result, you gain complete visibility into marketing performance.
Why Do Businesses Need a Product Marketing Dashboard in Excel?
Marketing teams generate huge amounts of data every month. However, without proper visualization, that data creates confusion instead of clarity.
A structured dashboard solves this problem.
Here is why businesses need it:
-
It provides real-time performance tracking
-
It compares target vs actual performance instantly
-
It highlights underperforming campaigns
-
It identifies top-performing products
-
It improves decision-making speed
-
It reduces manual reporting time
Moreover, when managers review conversion rate by product or by sales channel, they can quickly adjust strategy.
Therefore, this dashboard turns raw marketing data into actionable insights.
Key Features of the Product Marketing Dashboard in Excel
This dashboard is designed as a ready-to-use Excel solution. It contains structured sheets and interactive charts.
Major Features Include:
-
✅ Page Navigator on the left side for easy movement between pages
-
✅ Right-side slicers for dynamic filtering
-
✅ KPI Cards for quick performance overview
-
✅ 5 Analytical Pages
-
✅ Separate Data Sheet
-
✅ Support Sheet for backend calculations
Because of this structured design, users can navigate easily and analyze quickly.
Dashboard Structure: 5 Powerful Analytical Pages
Let us now explore each page in detail.
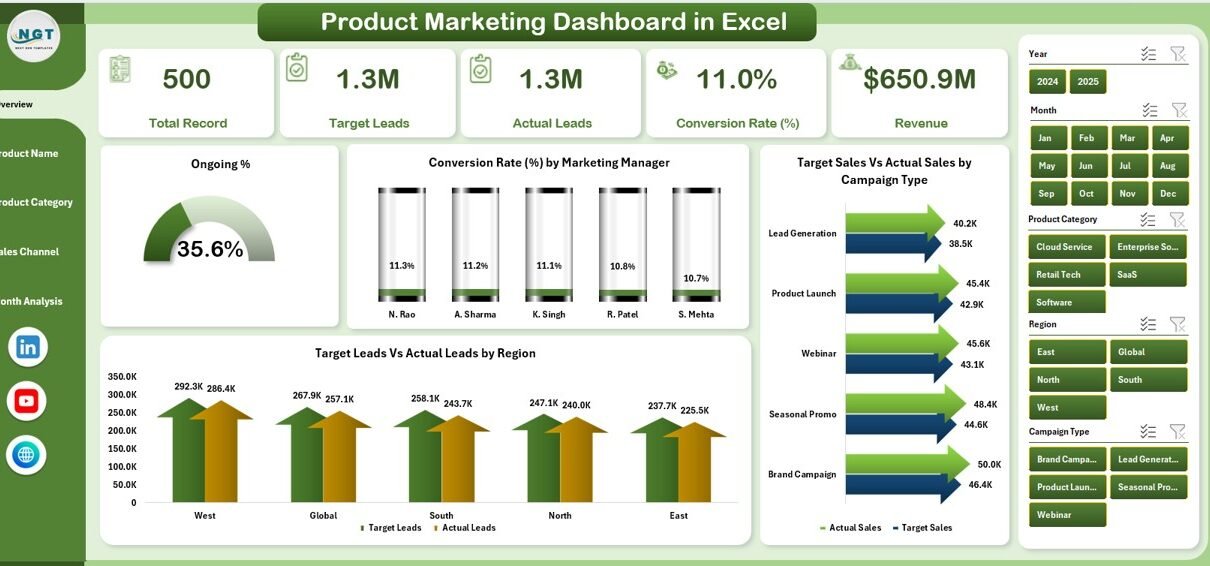
1️⃣ Overview Page – What Does It Show?
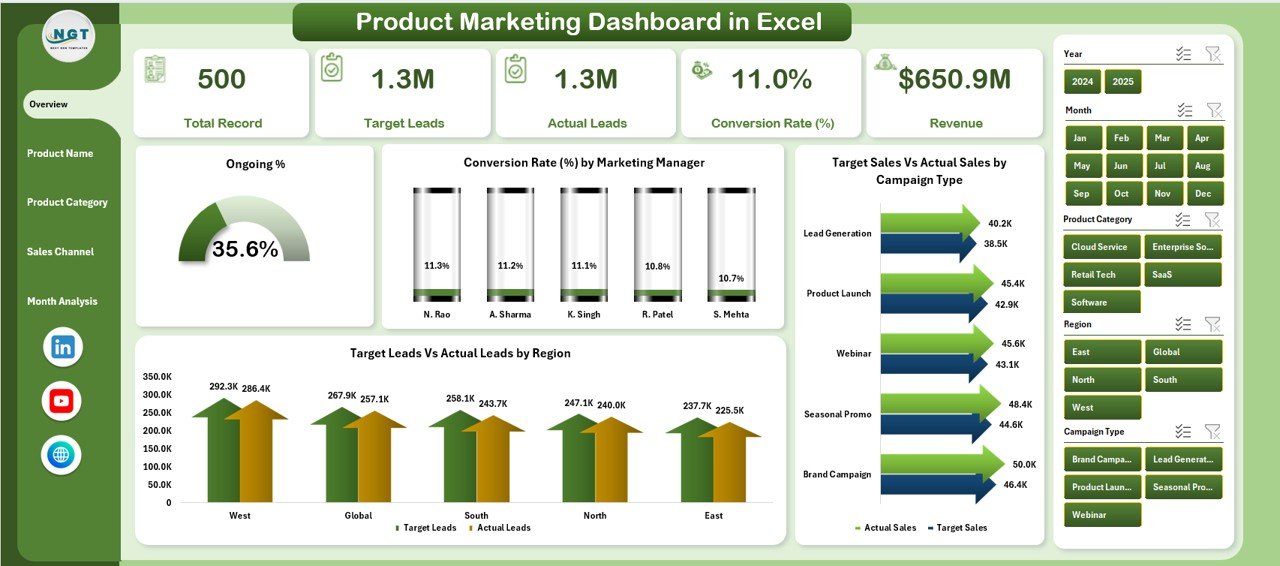
The Overview Page acts as the command center of the dashboard.
It provides high-level insights so that managers can quickly understand performance.
Key Elements on Overview Page:
🔹 4 KPI Cards
-
Ongoing %
-
Conversion Rate
-
Total Target Sales vs Actual Sales
-
Total Target Leads vs Actual Leads
These cards give an instant snapshot of performance.
🔹 4 Analytical Charts
-
Ongoing %
-
Conversion Rate by Marketing Manager
-
Target Sales vs Actual Sales by Campaign Type
-
Target Leads vs Actual Leads by Region
Because this page summarizes the overall picture, decision-makers can instantly identify performance gaps.
Moreover, the slicer on the right side allows filtering by month, campaign, region, or product.
2️⃣ Product Name Analysis – Which Product Performs Best?
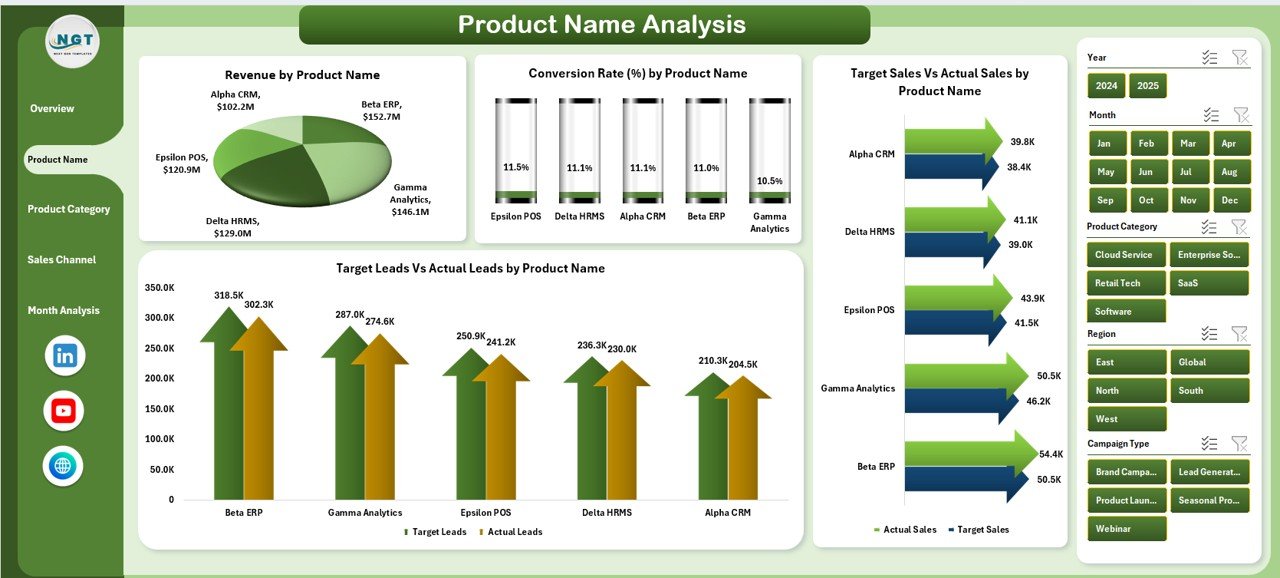
This page focuses on product-level insights.
Many businesses struggle to understand which product generates maximum revenue or highest conversion rate. However, this page solves that issue.
Charts Included:
Click to Purchases Product Marketing Dashboard in Excel
-
Conversion Rate by Product Name
-
Target Sales vs Actual Sales by Product Name
-
Target Leads vs Actual Leads by Product Name
-
Revenue by Product Name
Therefore, marketing teams can compare performance across multiple products.
If one product shows low conversion rate but high leads, then the team can improve sales strategy.
On the other hand, if revenue remains strong, managers can increase campaign budget for that product.
3️⃣ Product Category Analysis – How Does Each Category Perform?
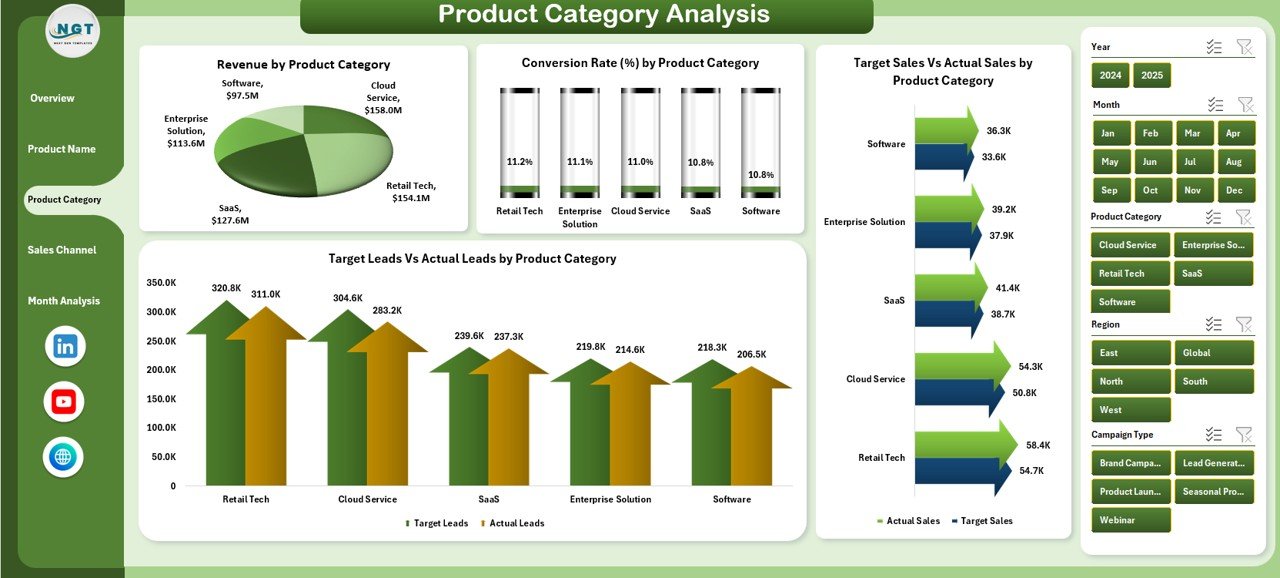
Sometimes individual product analysis is not enough. Therefore, this page analyzes performance at category level.
Charts Included:
-
Conversion Rate % by Product Category
-
Target Sales vs Actual Sales by Product Category
-
Target Leads vs Actual Leads by Product Category
-
Revenue by Product Category
Because category-level insights show broader trends, managers can adjust pricing or promotion strategy accordingly.
For example:
-
If Electronics shows higher conversion but lower revenue, you can increase pricing.
-
If Apparel generates high leads but low conversion, you can refine targeting.
Thus, category analysis strengthens strategic planning.
4️⃣ Sales Channel Analysis – Which Channel Drives Revenue?
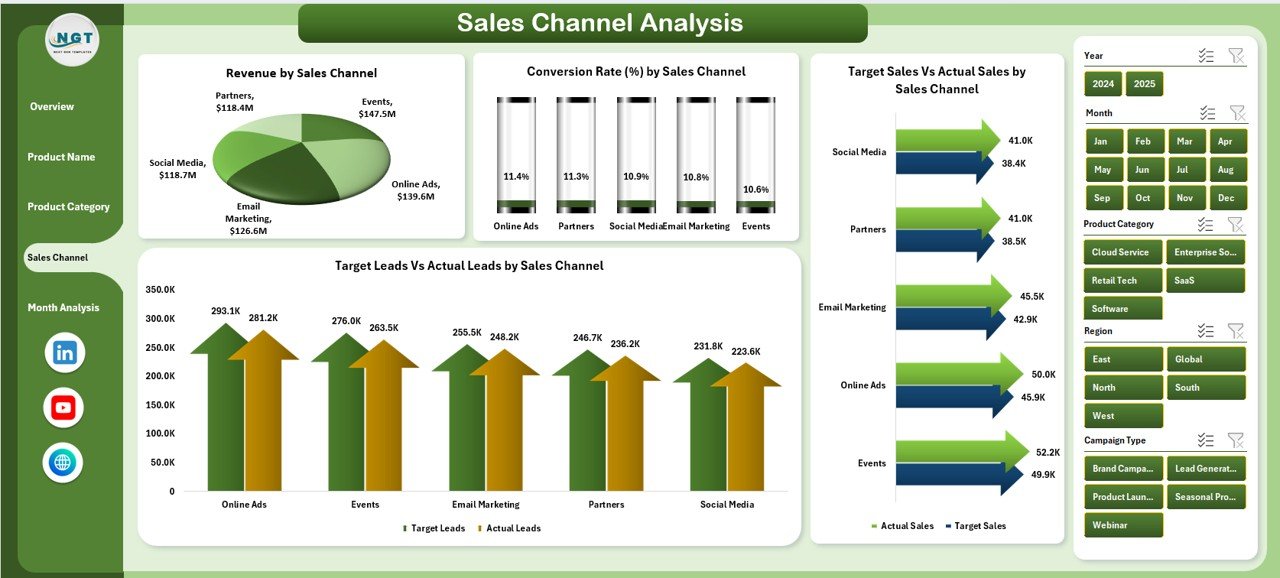
Marketing campaigns run across multiple channels such as:
-
Social Media
-
Email Marketing
-
Paid Ads
-
Website
-
Referral Programs
However, without proper tracking, teams cannot measure channel efficiency.
Click to Purchases Product Marketing Dashboard in Excel
This page solves that challenge.
Charts Included:
-
Conversion Rate % by Sales Channel
-
Target Sales vs Actual Sales by Sales Channel
-
Target Leads vs Actual Leads by Sales Channel
-
Revenue by Sales Channel
Because this analysis highlights channel performance, managers can:
-
Increase budget for high-performing channels
-
Stop spending on low-converting channels
-
Optimize ad campaigns
As a result, ROI improves significantly.
5️⃣ Month Analysis – How Does Performance Change Over Time?
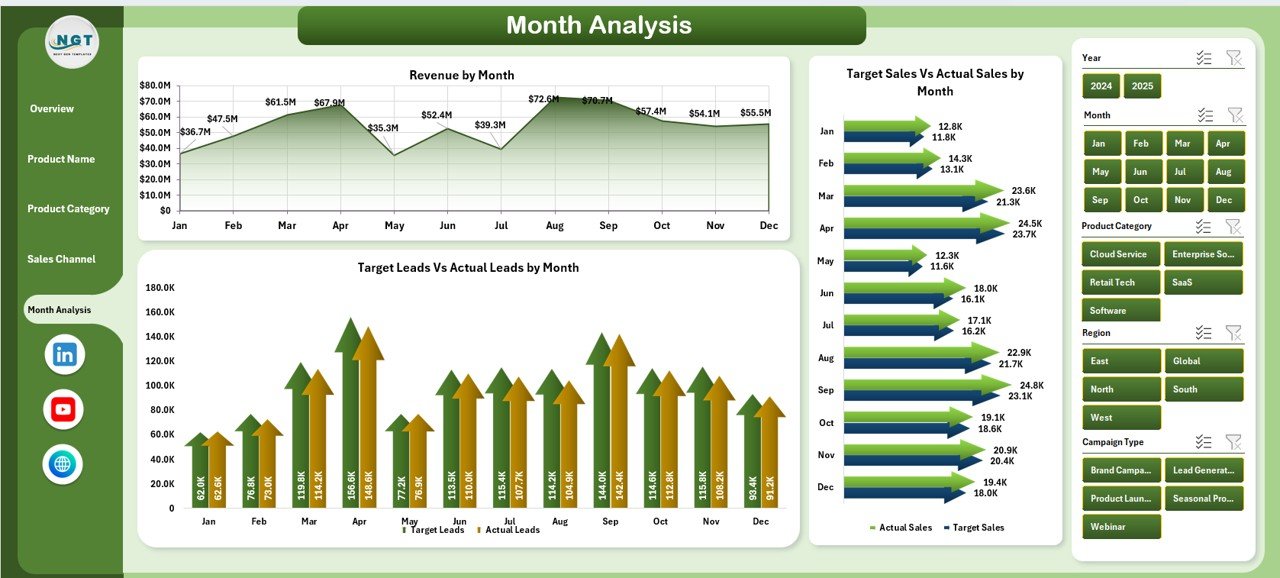
Performance tracking without time comparison makes no sense.
Therefore, this page analyzes monthly trends.
Charts Included:
-
Target Sales vs Actual Sales by Month
-
Target Leads vs Actual Leads by Month
-
Revenue by Month
This monthly comparison helps managers:
-
Identify seasonal trends
-
Compare growth month-over-month
-
Forecast future performance
Moreover, it highlights performance spikes and drops instantly.
Data Sheet – The Engine of the Dashboard
The Data Sheet stores all marketing data.
It includes:
-
Product Name
-
Product Category
-
Sales Channel
-
Campaign Type
-
Region
-
Marketing Manager
-
Target Sales
-
Actual Sales
-
Target Leads
-
Actual Leads
-
Revenue
-
Month
Because the dashboard connects directly to this sheet, users only need to update data regularly.
After updating, all charts refresh automatically.
Support Sheet – Backend Calculations
Click to Purchases Product Marketing Dashboard in Excel
The Support Sheet handles formulas and helper columns.
It calculates:
-
Conversion Rate %
-
Ongoing %
-
Target Achievement %
-
Revenue Growth %
This structure ensures accuracy and performance stability.
Important KPIs Included in Product Marketing Dashboard
Here are the major KPIs tracked:
-
Conversion Rate %
-
Target Sales Achievement %
-
Target Leads Achievement %
-
Revenue
-
Ongoing Campaign %
-
Revenue by Channel
-
Revenue by Product
-
Revenue by Region
Because these KPIs cover sales and marketing performance, managers gain complete clarity.
Advantages of Product Marketing Dashboard in Excel
Let us now understand the benefits.
1️⃣ Easy to Use
Excel is familiar to most professionals. Therefore, teams can start using it immediately.
2️⃣ Fully Customizable
You can add new KPIs, products, or regions easily.
3️⃣ Real-Time Analysis
Once you update data, charts reflect changes instantly.
4️⃣ Better Decision Making
Visual insights reduce guesswork.
5️⃣ Improved ROI
Channel analysis improves budget allocation.
6️⃣ Performance Accountability
Manager-level conversion tracking increases responsibility.
7️⃣ Centralized Reporting
Instead of multiple reports, everything stays in one file.
Because of these advantages, businesses improve marketing efficiency significantly.
Best Practices for the Product Marketing Dashboard in Excel
To maximize benefits, follow these best practices.
✅ Update Data Regularly
Always enter accurate monthly data.
✅ Keep Data Clean
Avoid blank cells and incorrect values.
✅ Use Structured Tables
Convert raw data into Excel tables.
✅ Review KPIs Monthly
Do not wait until year-end to analyze performance.
✅ Track Both Leads and Sales
Leads show interest, sales show revenue impact.
✅ Focus on Conversion Rate
High leads with low conversion indicate a problem.
✅ Compare Target vs Actual
Always track performance against targets.
When you follow these practices, your dashboard becomes a powerful decision tool.
How Does This Dashboard Improve Marketing Strategy?
This dashboard improves strategy in multiple ways.
-
It identifies high-performing products
-
It highlights weak campaigns
-
It shows profitable sales channels
-
It tracks manager performance
-
It supports budget reallocation
Therefore, marketing becomes data-driven instead of assumption-based.
Who Should Use This Product Marketing Dashboard?
This dashboard suits:
-
Marketing Managers
-
Product Managers
-
Sales Directors
-
Business Owners
-
Campaign Analysts
-
Digital Marketing Teams
Because it simplifies complex data, both small and large businesses benefit.
How to Use the Product Marketing Dashboard in Excel?
Follow these steps:
-
Enter data in the Data Sheet
-
Verify calculations in Support Sheet
-
Use slicers to filter by month or category
-
Analyze Overview page first
-
Drill down into product or channel analysis
-
Take action based on insights
Within minutes, you can identify performance gaps.
Conclusion
Marketing success depends on measurement. However, without proper tracking tools, teams waste time and miss opportunities.
The Product Marketing Dashboard in Excel provides a structured, interactive, and ready-to-use solution.
It tracks sales, leads, revenue, conversion rate, product performance, and channel efficiency — all in one file.
Moreover, it simplifies complex data and turns it into clear insights.
Therefore, if you want better decisions, stronger campaigns, and improved ROI, this dashboard becomes an essential tool.
Frequently Asked Questions with Answers
1️⃣ What is a Product Marketing Dashboard in Excel?
It is an Excel-based tool that tracks marketing performance, sales targets, leads, and revenue in one interactive dashboard.
2️⃣ Can I customize this dashboard?
Yes. You can add new products, regions, KPIs, or sales channels easily.
3️⃣ Does the dashboard update automatically?
Yes. When you update the Data Sheet, charts refresh automatically.
4️⃣ Who should use this dashboard?
Marketing managers, product managers, sales teams, and business owners can use it.
5️⃣ Does it track conversion rate?
Yes. It calculates and displays conversion rate by product, category, and sales channel.
6️⃣ Can I track monthly performance?
Yes. The Month Analysis page shows monthly comparison of sales, leads, and revenue.
Visit our YouTube channel to learn step-by-step video tutorials