Managing professional training and coaching programs requires more than planning sessions and assigning trainers. Organizations need to track participation, measure satisfaction, monitor costs, and evaluate outcomes. Without a structured system, training often becomes expensive and less effective.
A Professional Training & Coaching Dashboard in Excel solves this challenge by turning raw training data into meaningful insights. Built with Excel, this dashboard allows HR teams, learning managers, and training providers to monitor activities in one central file.
In this article, you will discover:
Click to Purchases Professional Training & Coaching Dashboard in Excel
-
What the Professional Training & Coaching Dashboard in Excel is.
-
Why organizations need it.
-
Detailed explanation of the dashboard pages.
-
Key benefits of using Excel for training management.
-
Best practices for using the dashboard effectively.
-
Frequently asked questions with clear answers.
What Is a Professional Training & Coaching Dashboard in Excel?
A Professional Training & Coaching Dashboard in Excel is an interactive tool that helps organizations track, measure, and optimize training and coaching initiatives. It consolidates data from different programs into a visual and easy-to-navigate report.
The dashboard goes beyond basic reporting. It includes KPIs (Key Performance Indicators), charts, filters, and summaries that allow stakeholders to analyze:
-
Trainer performance.
-
Regional variations.
-
Training type efficiency.
-
Monthly participation and cost trends.
By using Excel, the dashboard remains simple to update, cost-effective, and highly customizable for different business needs.
Why Do You Need a Training & Coaching Dashboard?
Organizations invest heavily in professional development. However, without measurement, training effectiveness often remains unclear. A dashboard ensures every dollar spent contributes to growth and measurable results.
Here are a few reasons why businesses need this dashboard:
✅ Centralized View – All training and coaching data in one structured file.
✅ Real-Time Monitoring – Track progress, costs, and outcomes instantly.
✅ Performance Evaluation – Compare trainers, regions, and training types.
✅ Cost Control – Identify high-cost programs and evaluate their ROI.
✅ Better Decision Making – Allocate resources based on evidence, not assumptions.
Key Features of the Professional Training & Coaching Dashboard in Excel
The template comes with 5 interactive pages plus support sheets for smooth functioning. Let’s explore them in detail.
Click to Purchases Professional Training & Coaching Dashboard in Excel
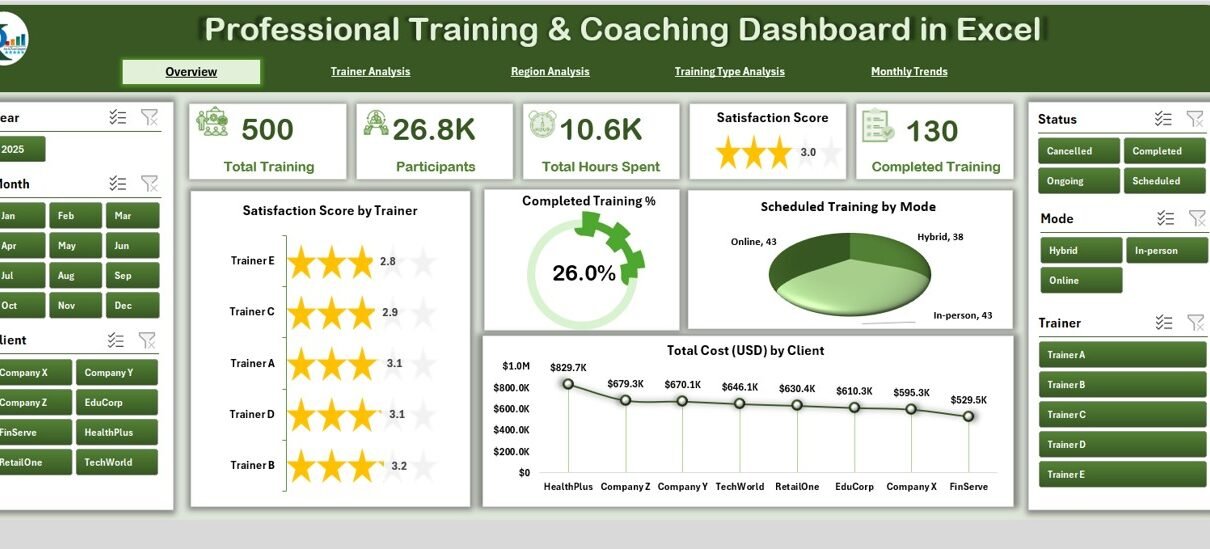
1. Overview Page
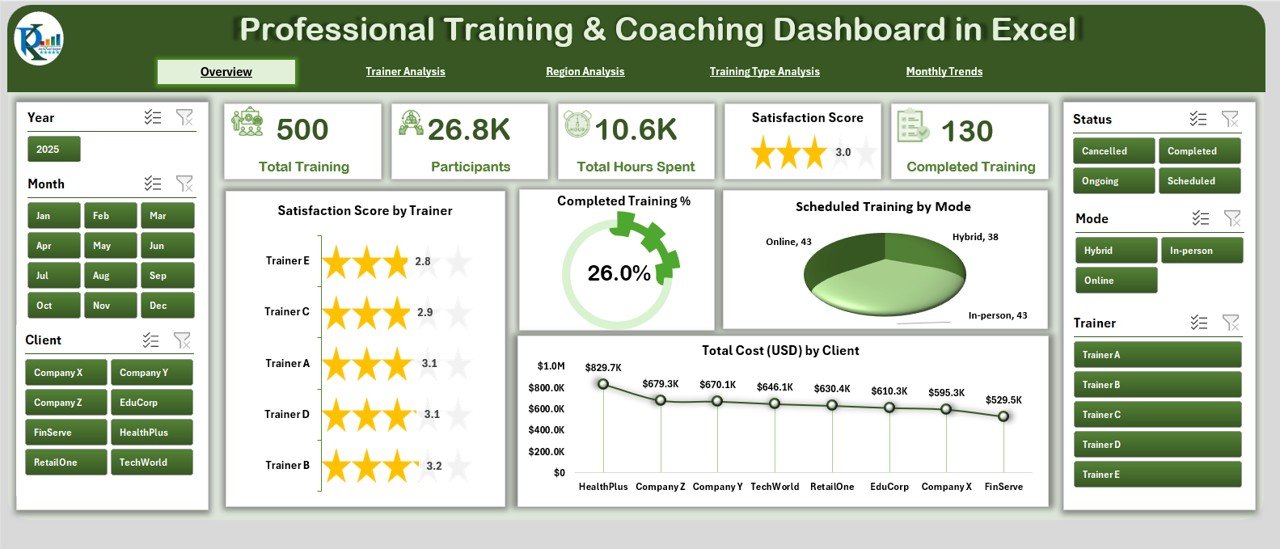
The Overview Page gives a quick summary of the training landscape.
-
It includes 5 KPI cards showing critical numbers like completed training percentage, scheduled sessions, and total cost.
-
The right-side slicer enables filtering by region, trainer, or training type.
Charts on this page include:
📊 Satisfaction Score by Trainer
📊 Completed Training %
📊 Scheduled Training by Mode (online, classroom, hybrid)
📊 Total Cost (USD) by Client
This page acts as a snapshot for executives and managers to see overall training performance.
2. Trainer Analysis
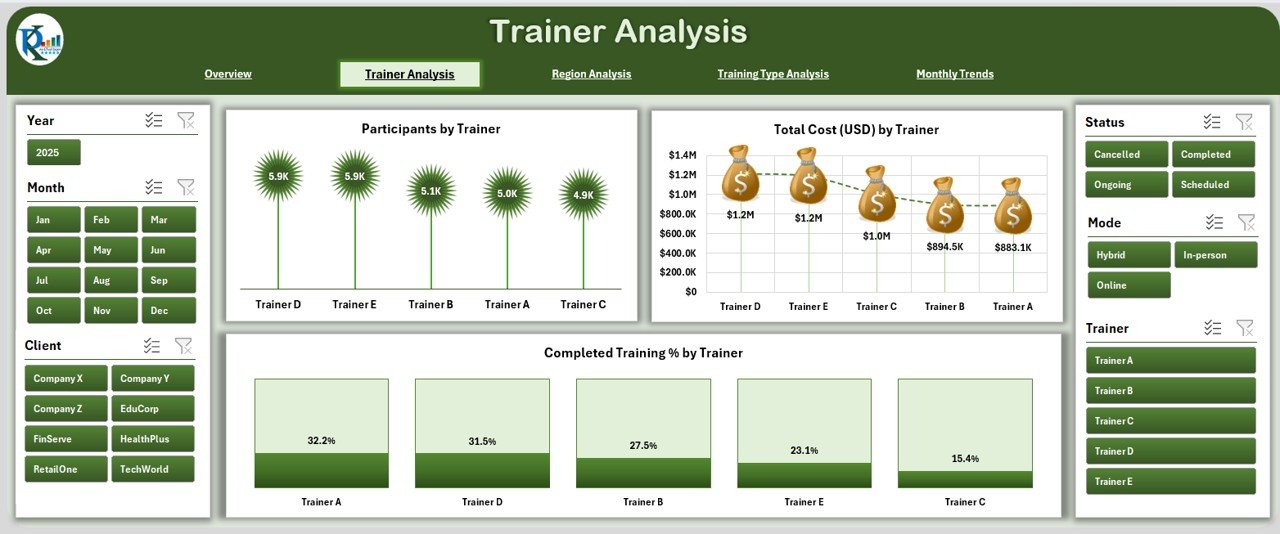
Trainer quality plays a major role in participant satisfaction and learning outcomes. The Trainer Analysis Page focuses on individual trainer performance.
Charts on this page include:
📊 Participants by Trainer
📊 Total Cost (USD) by Trainer
📊 Completed Training % by Trainer
This view allows managers to compare trainers, identify strong performers, and address gaps where satisfaction or completion rates are low.
3. Region Analysis
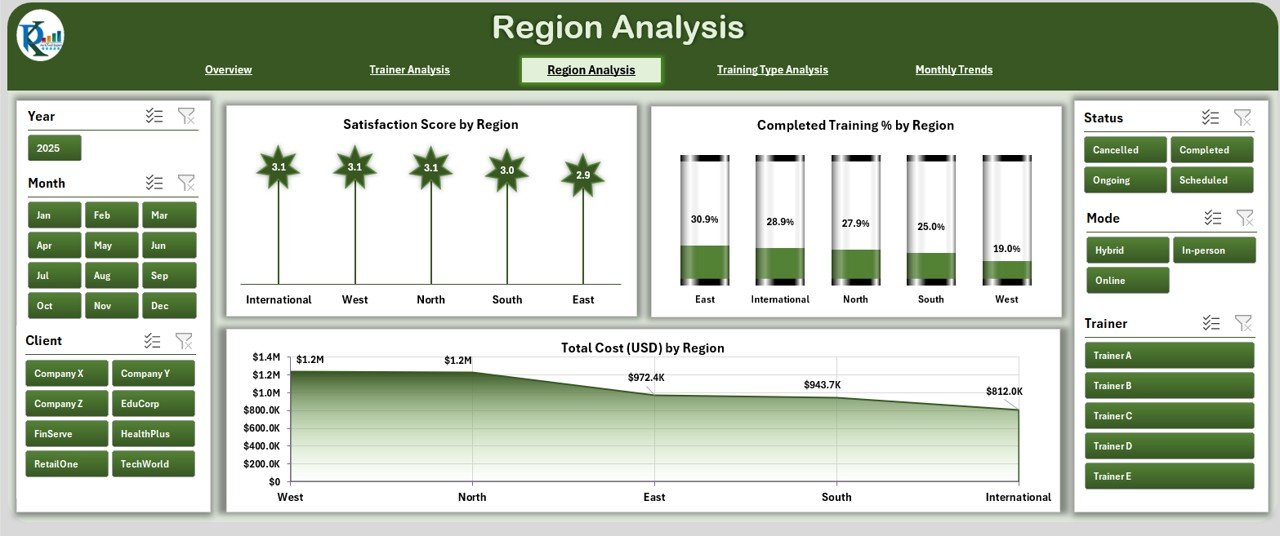
Training results often vary by geography. The Region Analysis Page helps organizations identify regional strengths and weaknesses.
Charts on this page include:
📊 Satisfaction Score by Region
📊 Completed Training % by Region
📊 Total Cost (USD) by Region
This analysis supports region-specific strategies and helps in balancing training investments across locations.
4. Training Type Analysis
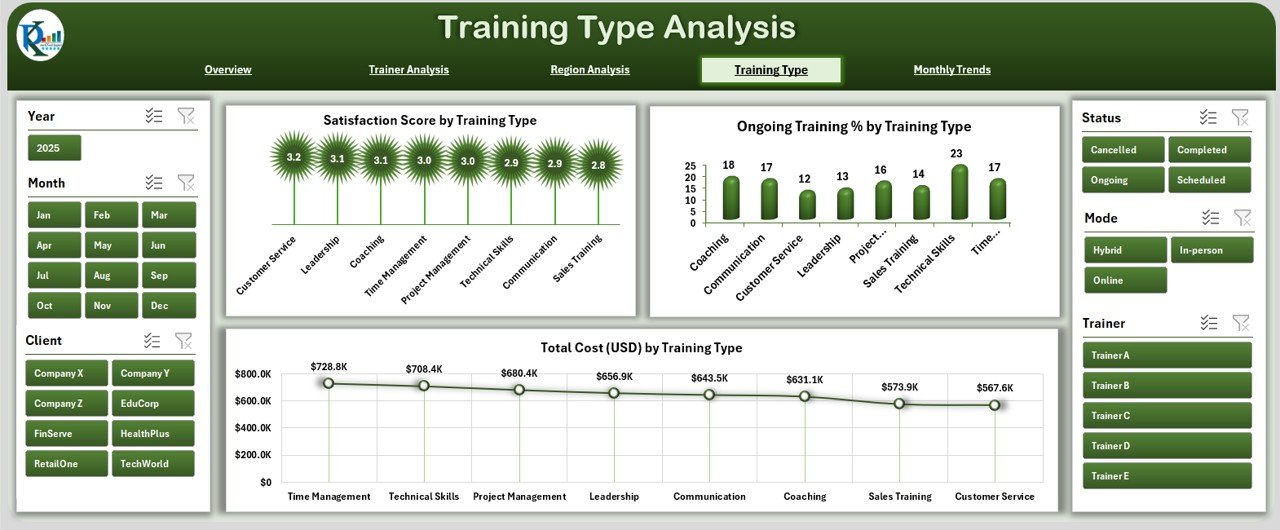
Different training types—technical, leadership, soft skills, or compliance—deliver different levels of effectiveness and cost. The Training Type Analysis Page provides insights into each category.
Charts on this page include:
📊 Satisfaction Score by Training Type
📊 Ongoing Training % by Training Type
📊 Total Cost (USD) by Training Type
This view allows organizations to see which training categories deliver the best ROI and where adjustments are needed.
5. Monthly Trends
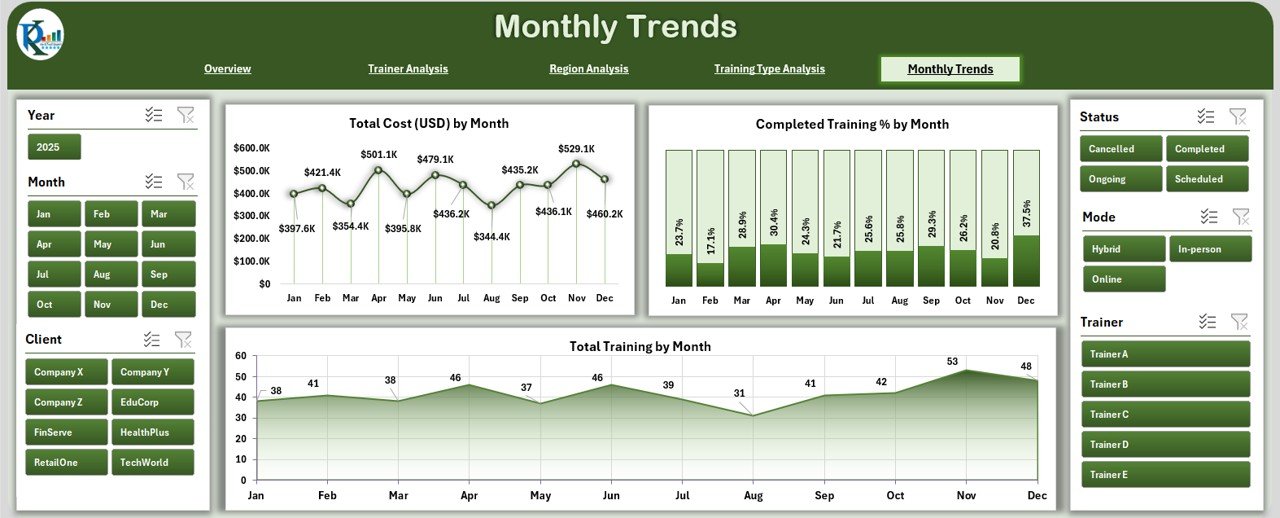
Understanding trends over time helps with planning and forecasting. The Monthly Trends Page displays progress throughout the year.
-
Charts on this page include:
📊 Total Cost (USD) by Month
📊 Completed Training % by Month
📊 Total Training by Month
This helps managers identify peak training months, track seasonal variations, and evaluate budget pacing.
Support Sheet
The Support Sheet ensures consistency. It manages drop-down lists, reference categories, and controlled values. This avoids data entry errors and keeps reports clean and reliable.
Click to Purchases Professional Training & Coaching Dashboard in Excel
Advantages of the Professional Training & Coaching Dashboard in Excel
Implementing this dashboard brings multiple benefits:
📈 Enhanced Visibility – Leaders gain instant clarity on training performance.
💰 Cost Tracking – Real-time monitoring of training budgets prevents overspending.
👨🏫 Trainer Insights – Easily compare trainer effectiveness across programs.
🌍 Regional Understanding – Spot differences across locations to adjust strategy.
📊 Data-Driven Culture – Encourages evidence-based decisions instead of assumptions.
🔄 Scalable Design – Add new programs, trainers, or regions without redesigning.
How to Use the Professional Training & Coaching Dashboard in Excel
Using the dashboard is simple:
-
Update Data Sheets – Enter program details, trainer names, regions, costs, and satisfaction scores.
-
Refresh Pivot Tables – Ensure the latest data flows into charts and KPIs.
-
Navigate Pages – Use the page navigator to switch between Overview, Trainer Analysis, Region Analysis, Training Type, and Monthly Trends.
-
Filter Data – Apply slicers to view specific regions, trainers, or training types.
-
Review KPIs – Track progress, completion rates, and budget metrics.
-
Share Reports – Export the dashboard to PDF or PowerPoint for management.
Best Practices for Using the Dashboard
To maximize value, follow these best practices:
✅ Maintain Data Consistency – Use the support sheet for controlled inputs.
✅ Update Regularly – Refresh data after every training cycle.
✅ Set Clear KPIs – Define success metrics such as satisfaction score, cost per participant, and completion %.
✅ Leverage Slicers – Use filters to focus on specific insights instead of all data at once.
✅ Monitor Trends – Review monthly performance to predict future needs.
✅ Encourage Feedback – Combine dashboard data with participant surveys for deeper insights.
Opportunities for Improvement
Although Excel provides powerful dashboards, organizations may expand further:
🔄 Integrate with HR Software – Automate data entry from HR systems.
📊 Adopt Power BI – For larger datasets and advanced visualization.
🔐 Role-Based Access – Control who can view or edit sensitive data.
📱 Mobile Access – Use cloud versions for on-the-go reporting.
Conclusion
A Professional Training & Coaching Dashboard in Excel empowers organizations to manage training more effectively. It provides clarity on costs, trainer performance, regional variations, and monthly progress. By using this tool, businesses can make smarter decisions, ensure ROI, and continuously improve employee development programs.
With proper use and adherence to best practices, this dashboard becomes a reliable foundation for building a skilled and future-ready workforce.
Frequently Asked Questions (FAQs)
1. What is a Professional Training & Coaching Dashboard in Excel?
It is an Excel-based tool that consolidates training and coaching data into one file, using KPIs and charts for analysis.
2. Who should use this dashboard?
HR managers, training coordinators, L&D teams, coaching providers, and business leaders who want better visibility into training investments.
3. What metrics can be tracked?
Metrics include satisfaction scores, training completion %, cost by trainer, cost by region, and monthly training volume.
4. Can I customize the dashboard?
Yes, you can add new charts, KPIs, or filters to match your organization’s needs.
5. How does it improve decision-making?
It transforms raw data into insights, allowing leaders to allocate resources effectively and maximize ROI.
6. Is Excel enough for large organizations?
Excel works well for small and medium-sized organizations. For enterprise-scale data, integration with Power BI or HR systems is recommended.
Visit our YouTube channel to learn step-by-step video tutorials
Youtube.com/@NeotechNavigators