In today’s digital landscape, cybersecurity is not just an IT concern; it has become a strategic project management priority. As businesses handle more data and face increasing cyber threats, project managers must track and improve cybersecurity performance to ensure successful project delivery. That’s where a Project Management Cybersecurity KPI Dashboard in Excel becomes essential.
In this comprehensive article, we will walk you through everything you need to know about using a Cybersecurity KPI Dashboard for project management, why it matters, how to use it effectively, and best practices for optimizing your results.
Click to Purchases Project Management Cybersecurity KPI Dashboard in Excel
What is a Project Management Cybersecurity KPI Dashboard?
A Cybersecurity KPI (Key Performance Indicator) Dashboard in Excel is a smartly designed tool that allows project managers to monitor cybersecurity-related performance indicators. These KPIs provide measurable insights into how well cybersecurity strategies and controls are performing within the project environment.
By consolidating data into visual dashboards, project managers can track threats, response times, system vulnerabilities, and security policy compliance with ease.
Why Do You Need a Cybersecurity KPI Dashboard in Project Management?
Managing cybersecurity manually is time-consuming and prone to oversight. When integrated into project management, a KPI dashboard helps to:
- Detect threats early
- Track compliance and security goals
- Identify security vulnerabilities in project workflows
- Ensure regulatory and client requirements are met
- Foster data-driven decision-making
In short, this dashboard turns scattered data into actionable intelligence.
Key Features of the Project Management Cybersecurity KPI Dashboard in Excel
Let’s take a closer look at the main components of this powerful dashboard. It is designed with 7 dynamic worksheet tabs:
Home Sheet
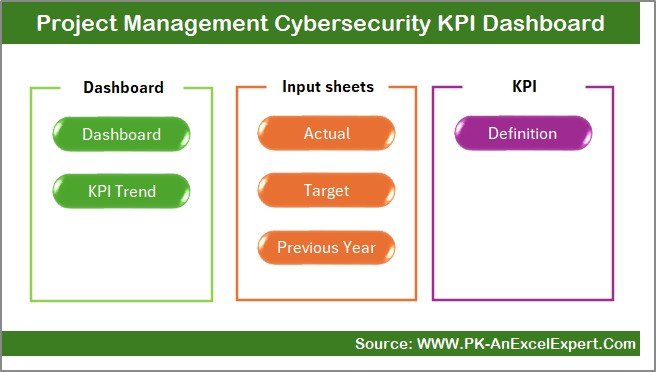
This is the navigation hub of the dashboard. You will find 6 buttons that link to the respective sheet tabs. It simplifies movement between different sections of the workbook.
Dashboard Sheet Tab
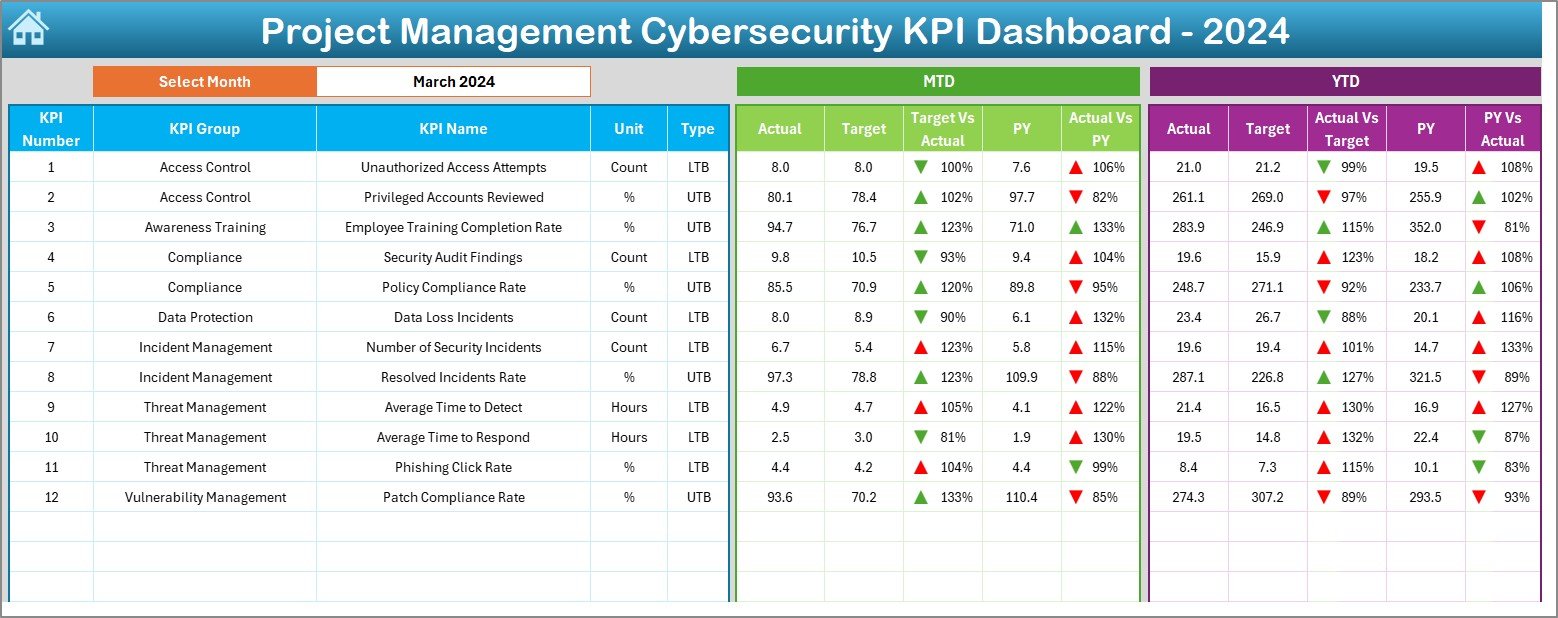
This is the heart of the dashboard. Here’s what you can expect:
- Dropdown filter at cell D3 to select a specific month.
- Automatically updates all KPI values for the selected month.
- Displays MTD (Month-to-Date) and YTD (Year-to-Date) values for:
- Actual performance
- Target values
- Previous year’s performance
- Uses conditional formatting with up/down arrows for visual comparison.
Click to Purchases Project Management Cybersecurity KPI Dashboard in Excel
KPI Trend Sheet Tab
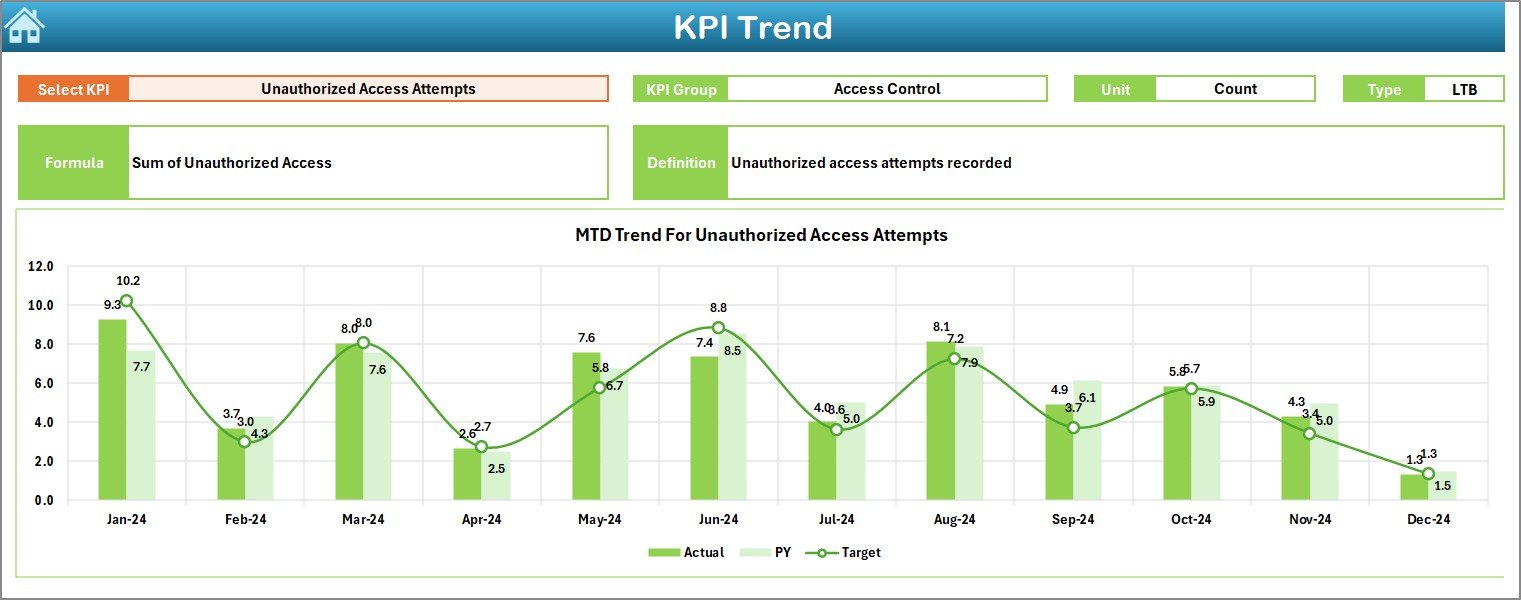
This tab allows in-depth trend analysis:
- Select any KPI from cell C3 to view details.
Displays:
- KPI Group
- Unit of Measure
- KPI Type (UTB or LTB)
- KPI Formula
- Short KPI Definition
- Trend charts for MTD and YTD to show Actual vs Target vs Previous Year.
Actual Numbers Input Sheet
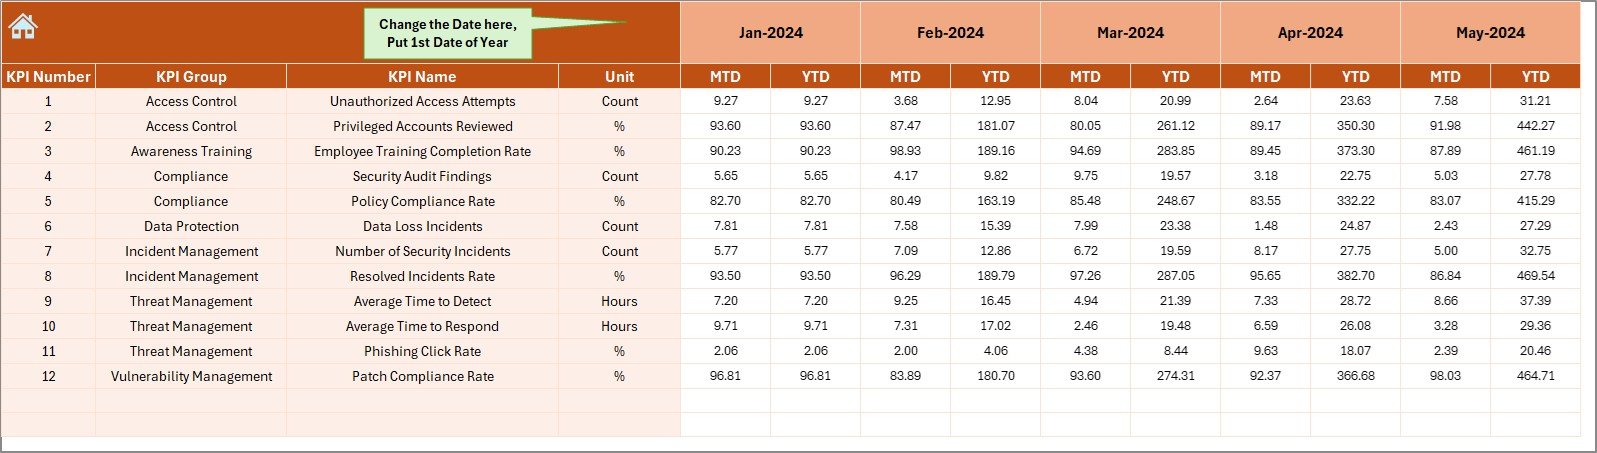
Input the actual performance numbers here:
- MTD and YTD for each KPI
- Change the reporting year’s starting month from cell E1
Target Sheet Tab
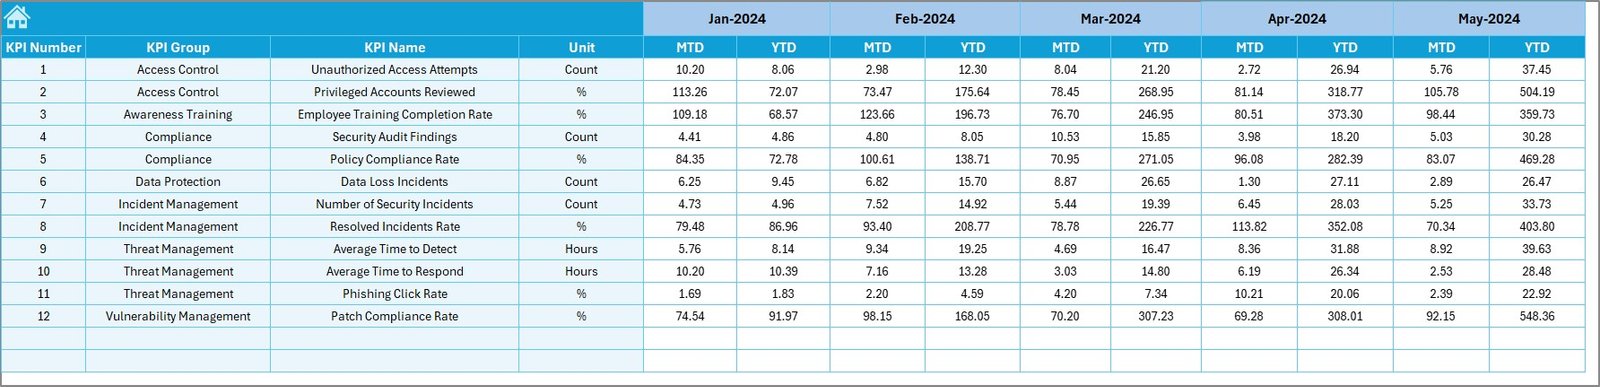
Set your monthly security goals:
- Enter target values for MTD and YTD per KPI
- Helps benchmark actual performance
Previous Year Number Sheet
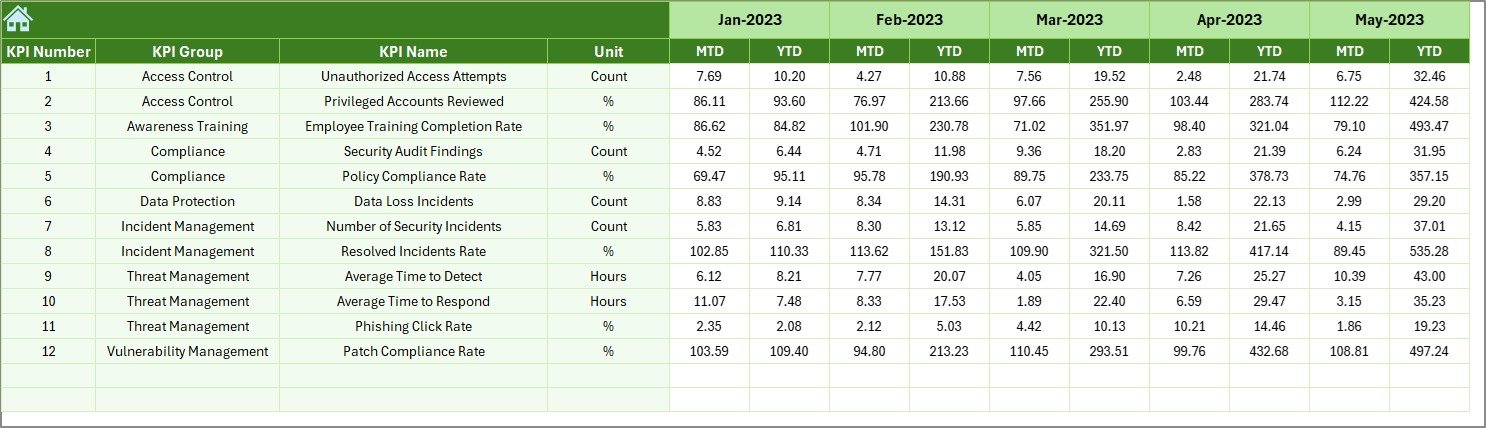
Use this for historical comparisons:
- Add MTD and YTD values from last year
- Helps track improvements or declines
KPI Definition Sheet Tab
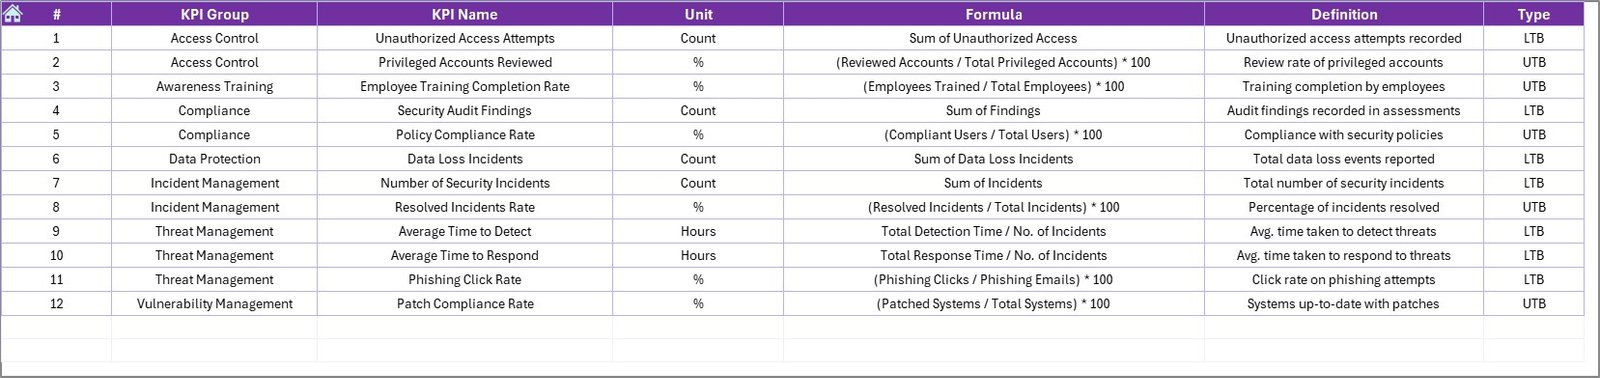
A structured repository for KPI metadata:
- KPI Name
- KPI Group
- Unit
- Formula
- Definition
This is helpful for documentation and team understanding.
Advantages of Using a Cybersecurity KPI Dashboard in Project Management
Let’s look at the top benefits:
📊 Real-Time Monitoring
You get up-to-date insights into cybersecurity risks, vulnerabilities, and response times.
📈 Performance Tracking
Easily track whether your team meets security goals across projects.
🔐 Increased Compliance
Track adherence to internal and external cybersecurity standards.
🤝 Improved Communication
Visual dashboards help communicate cyber health to stakeholders and executives.
⌛ Time-Saving Automation
No more creating manual reports. One click shows all key metrics.
How to Use the Excel Dashboard Effectively
Follow these tips to make the most out of your Cybersecurity KPI Dashboard:
- Set Clear Monthly Goals: Fill in the target sheet based on your project security objectives.
- Update Actuals Consistently: Enter real values each month in the Actual Numbers sheet.
- Analyze Trends Monthly: Use the KPI Trend tab to spot patterns early.
- Compare Year-Over-Year: Use previous year data to assess long-term progress.
- Review KPIs as a Team: Bring the team together monthly to review performance and address gaps.
Best Practices for Project Management Cybersecurity KPI Dashboard
Following best practices ensures you maximize the effectiveness of your dashboard.
1. Choose the Right KPIs
Select KPIs that align with your security goals, not just industry standards.
2. Keep It Simple
Avoid overloading your dashboard with too many metrics. Focus on what matters.
3. Use Conditional Formatting
Visual elements like arrows, colors, and charts help stakeholders quickly grasp the data.
4. Automate Where Possible
Use formulas and drop-downs to reduce manual errors and save time.
5. Regularly Review and Adjust
If a KPI becomes irrelevant, update or replace it. Your dashboard should evolve with your project.
How Does This Dashboard Support Cybersecurity Compliance?
Many projects require compliance with standards such as ISO 27001, NIST, or GDPR. This dashboard helps:
- Document cybersecurity processes
- Track policy adherence and audit results
- Show proof of ongoing monitoring and improvement
Can Non-Technical Managers Use This Dashboard?
Yes! That’s the beauty of using Excel. With dropdowns, charts, and simple tables, anyone can:
- Navigate the dashboard
- Understand performance metrics
- Participate in cybersecurity decision-making
Conclusion
Cybersecurity is no longer optional in project management—it’s a necessity. With the Project Management Cybersecurity KPI Dashboard in Excel, you can track, measure, and improve your cybersecurity posture with confidence.
From monitoring threats to ensuring compliance and driving team accountability, this dashboard empowers project managers to protect both project outcomes and sensitive data.
Frequently Asked Questions (FAQs)
1. What are the most important cybersecurity KPIs to track?
Some of the most critical KPIs include threat detection, incident response time, patch compliance rate, and audit findings.
2. How often should I update the dashboard?
Update it monthly for MTD and YTD values. Consistent updates ensure accurate reporting and better decision-making.
3. Is this dashboard suitable for all industries?
Yes, any industry that deals with sensitive data or digital systems can benefit from this dashboard.
4. Can I customize the dashboard for my organization?
Absolutely! You can add or remove KPIs, modify formulas, and change layouts to fit your project goals.
5. Do I need advanced Excel skills to use it?
No. Basic Excel knowledge is enough to use this dashboard. All formulas and dropdowns are already built in.
Click to Purchases Project Management Cybersecurity KPI Dashboard in Excel
Visit our YouTube channel to learn step-by-step video tutorials
Watch the step-by-step video Demo: