Public Relations (PR) has become one of the most crucial parts of modern business. Every organization wants to maintain a positive brand image, engage stakeholders effectively, and measure the results of their communication campaigns. However, without tracking the right metrics, PR efforts can easily become vague and difficult to evaluate.
This is where a Public Relations (PR) KPI Dashboard in Excel comes in. By centralizing all key metrics in one place, businesses can measure, analyze, and improve their PR strategies with clarity. In this article, we will explore what a PR KPI dashboard is, why it matters, how it works in Excel, its benefits, best practices, and frequently asked questions.
Click to Purchases Public Relations (PR) KPI Dashboard in Excel
What Is a PR KPI Dashboard?
A PR KPI Dashboard is a data visualization tool that tracks and displays the most important Key Performance Indicators (KPIs) for public relations. It helps communication teams measure campaign effectiveness, media coverage, engagement levels, sentiment, and overall impact on brand reputation.
When designed in Excel, the dashboard becomes highly accessible, user-friendly, and customizable. Businesses of all sizes can implement it without needing expensive software.
Why Do Businesses Need a PR KPI Dashboard?
Public relations is more than sending press releases or managing media contacts. Today, PR professionals must demonstrate measurable outcomes to justify budgets and efforts. A PR KPI dashboard helps organizations:
-
Track communication effectiveness.
-
Monitor media visibility and coverage.
-
Measure brand reputation and sentiment.
-
Align PR campaigns with business goals.
-
Provide clear reports to stakeholders.
With a dashboard, companies move from guesswork to data-driven decision-making.
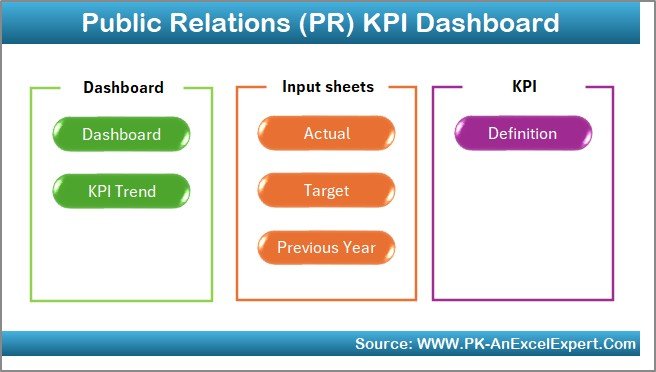
Key Features of the PR KPI Dashboard in Excel
We have created a ready-to-use PR KPI Dashboard in Excel with powerful features. It contains seven worksheets that cover every aspect of PR measurement. Let’s explore them in detail:
Home Sheet
-
Functions as the index page.
-
Contains six quick navigation buttons to jump to other sheets.
-
Makes the dashboard easy to use for both beginners and advanced users.
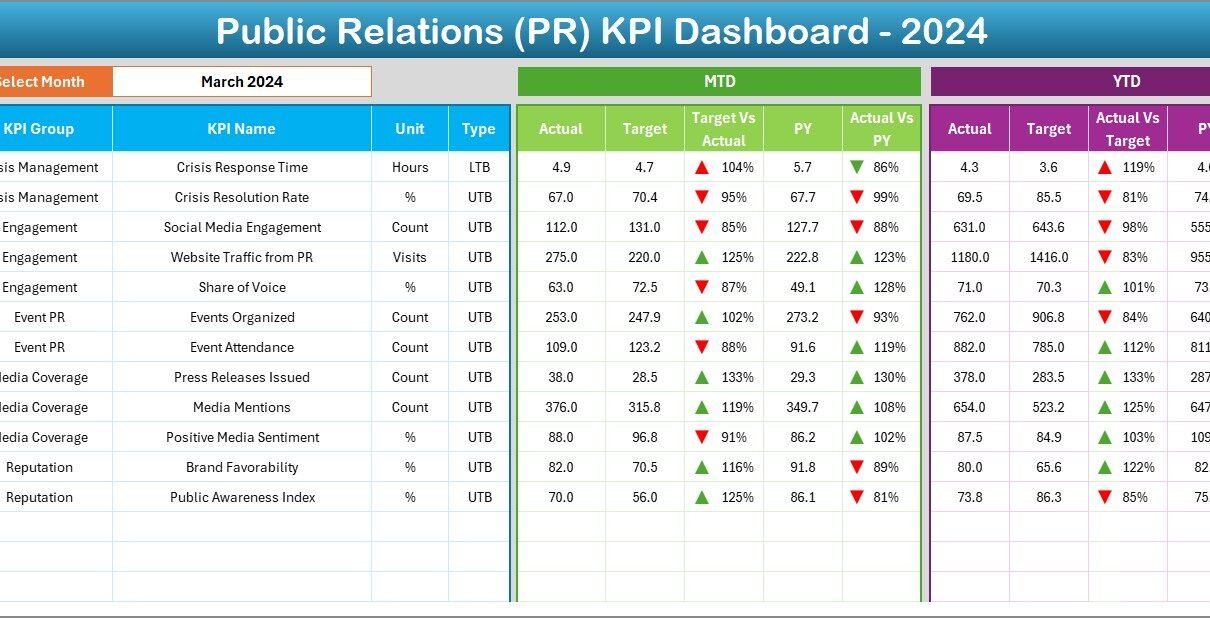
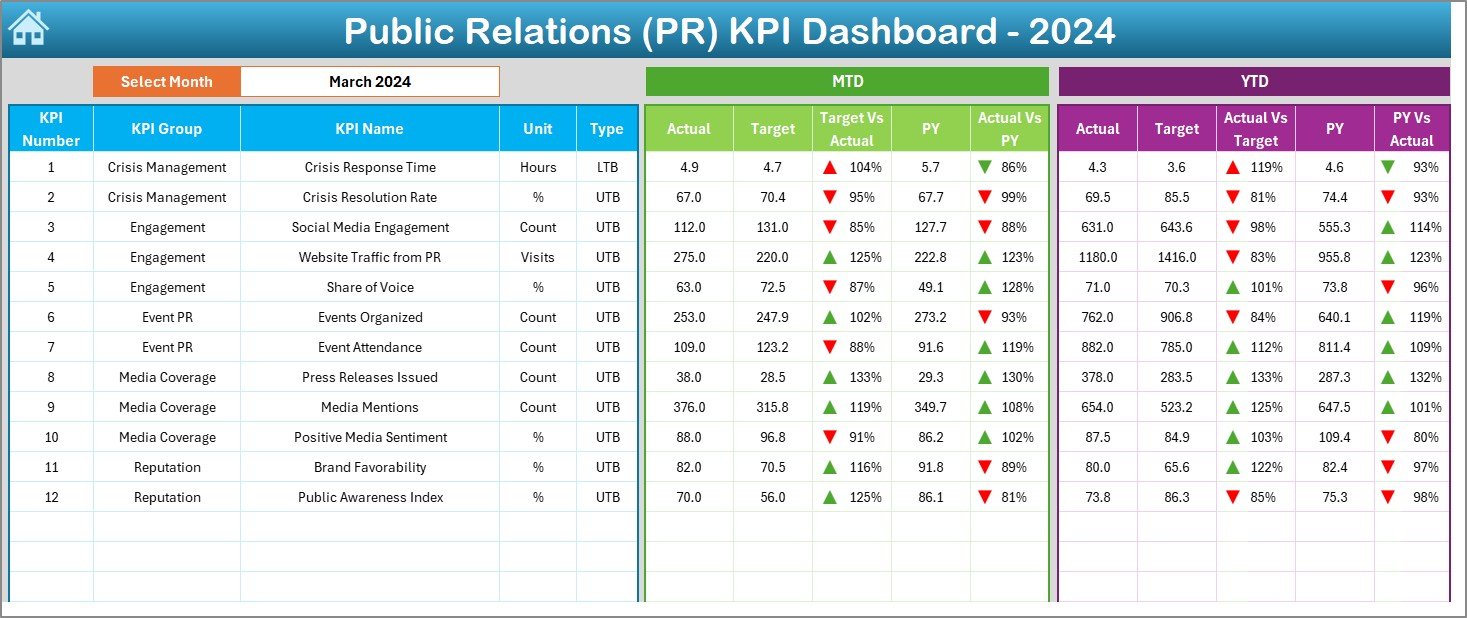
Dashboard Sheet
-
The main analytical page.
-
Users can select the month from a drop-down (Range D3).
-
Displays MTD (Month-to-Date) and YTD (Year-to-Date) data.
-
Shows Actual vs Target vs Previous Year comparisons.
-
Includes conditional formatting with arrows for quick insights (green up for positive, red down for negative).
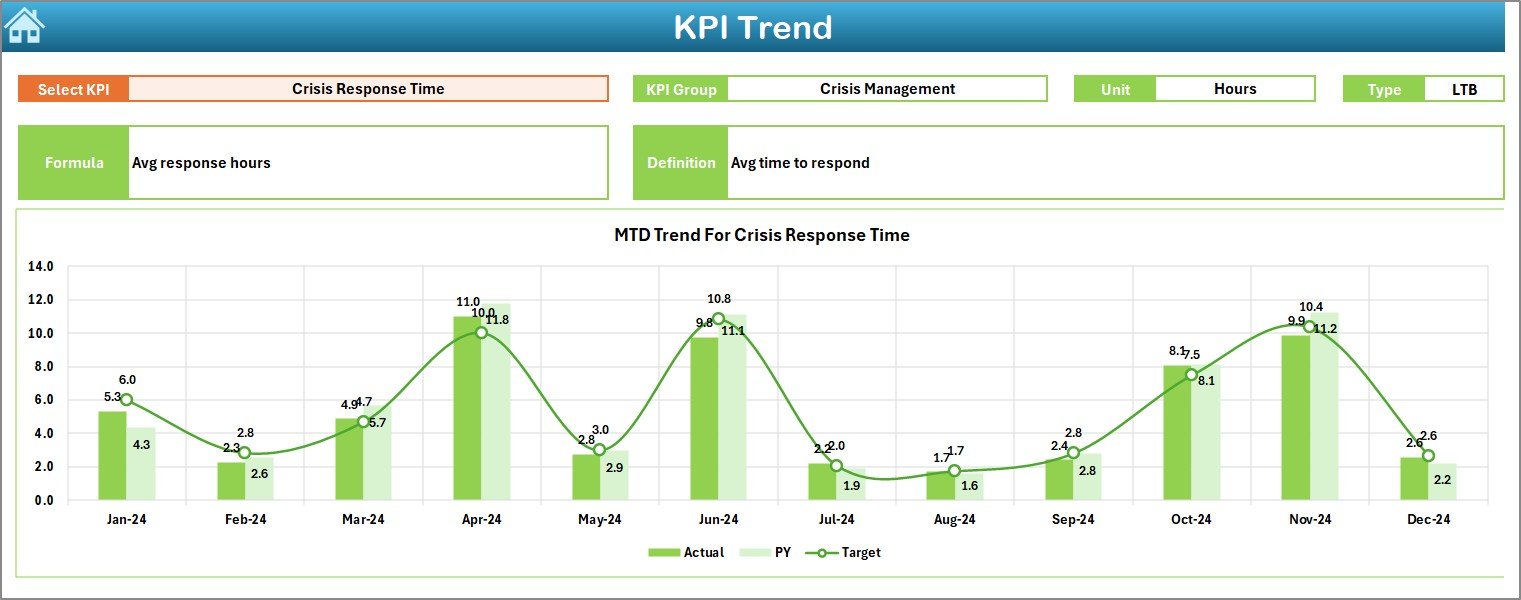
KPI Trend Sheet
-
Allows users to select a KPI from a drop-down (Range C3).
Displays details such as:
- KPI Group
- Unit of Measurement
- Type (Lower the Better / Upper the Better)
- Formula
- KPI Definition
-
Provides trend charts for Actual, Target, and Previous Year (both MTD and YTD).
Click to Purchases Public Relations (PR) KPI Dashboard in Excel
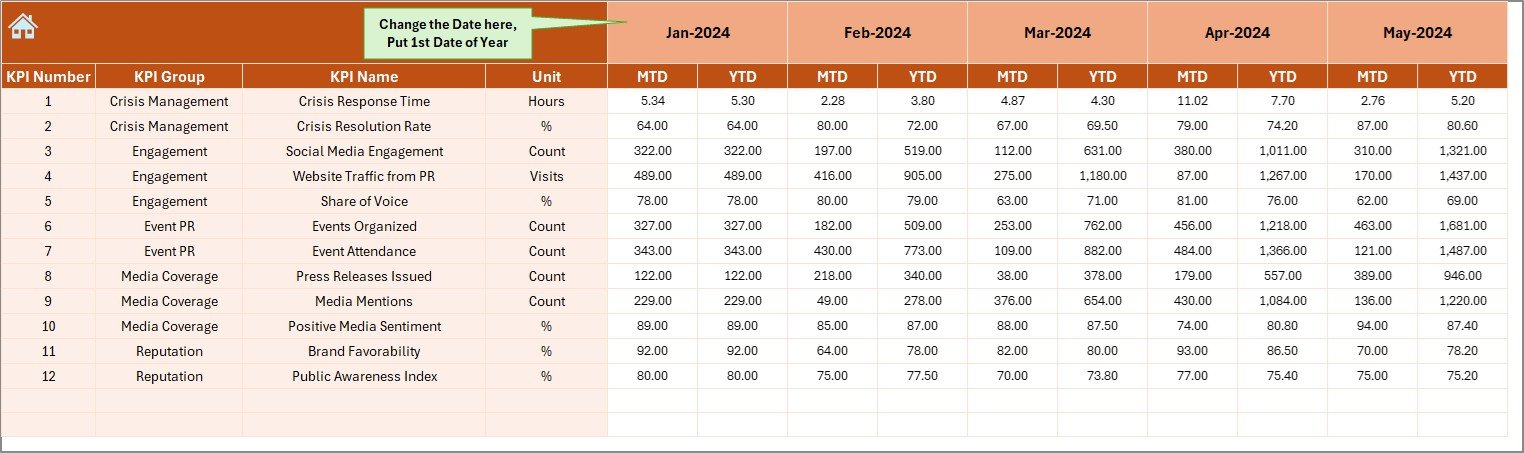
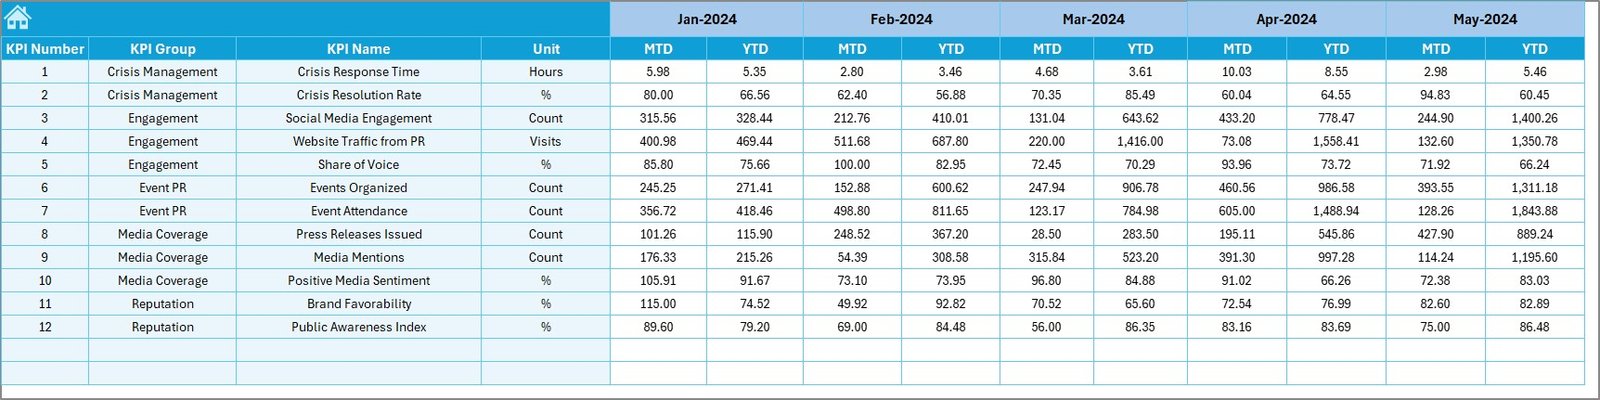
Actual Numbers Input Sheet
-
Where users enter real PR data.
-
Captures monthly actuals for MTD and YTD.
-
Includes flexibility to start the year from any month (Range E1).
Target Sheet
-
Stores monthly PR targets.
-
Captures both MTD and YTD values.
-
Helps in tracking performance against set goals.
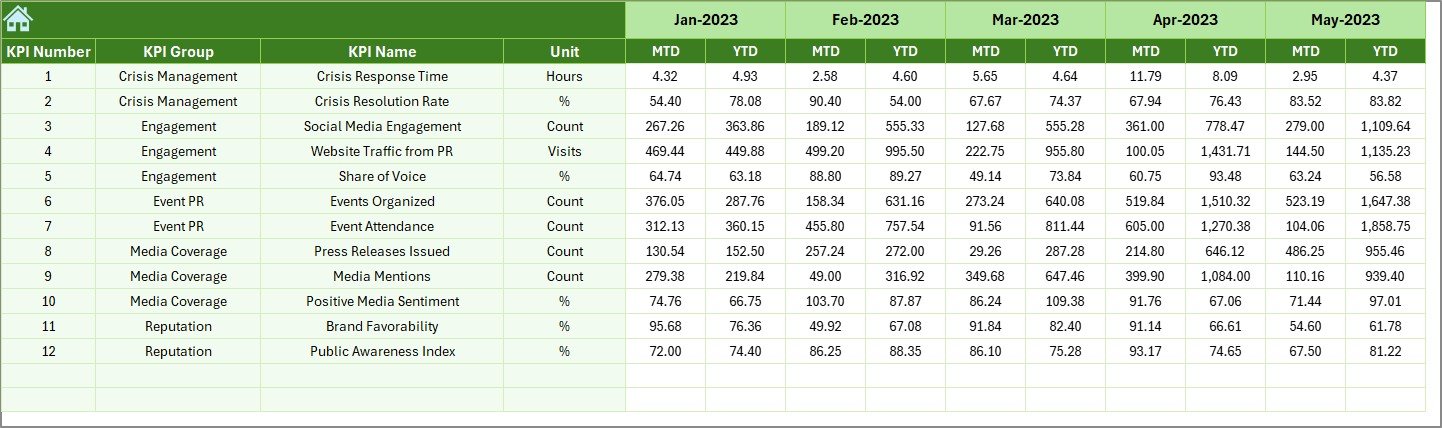
Previous Year Numbers Sheet
-
Stores historical data for comparison.
-
Ensures clear year-over-year performance tracking.
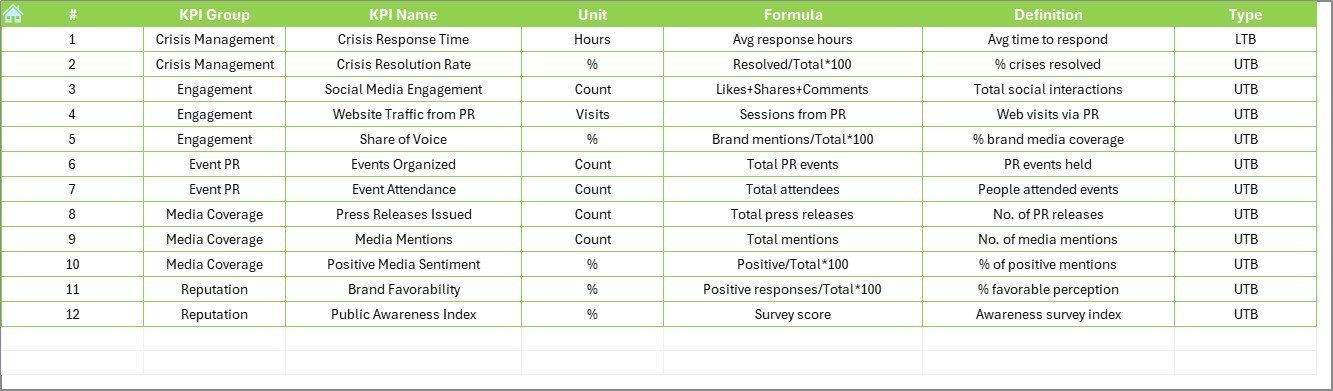
KPI Definition Sheet
-
Provides a detailed list of KPIs.
-
Includes KPI Name, Group, Unit, Formula, and Definition.
-
Serves as a reference guide for the dashboard.
Click to Purchases Public Relations (PR) KPI Dashboard in Excel
Examples of Public Relations KPIs to Track
Here are some essential KPIs that can be measured using the dashboard:
-
Media Mentions – Number of times the brand appears in media.
-
Press Release Reach – Audience exposed to PR announcements.
-
Share of Voice (SOV) – Percentage of industry coverage vs competitors.
-
Sentiment Analysis – Ratio of positive to negative mentions.
-
Engagement Rate – Interactions (likes, comments, shares) on PR campaigns.
-
Website Traffic from PR – Visitors generated by PR activities.
-
Influencer Coverage – Mentions by key opinion leaders.
-
Event Participation – Attendance at PR events or webinars.
Advantages of a PR KPI Dashboard in Excel
Using Excel for PR analytics brings multiple benefits:
✅ Cost-Effective – No expensive software needed.
✅ Customizable – Easily modify formulas, KPIs, and visuals.
✅ User-Friendly – Suitable for PR teams with basic Excel knowledge.
✅ Comprehensive View – Tracks all KPIs in one place.
✅ Performance Insights – Identifies what’s working and what’s not.
✅ Time-Saving – Automates repetitive reporting tasks.
Opportunities for Improvement in PR KPI Tracking
Even with a dashboard, PR analytics can improve further:
🔹 Data Accuracy – Ensure consistent and verified data inputs.
🔹 Automation – Use Excel macros or Power Query for faster updates.
🔹 Integration – Connect with digital analytics tools like Google Analytics.
🔹 Visualization – Add more charts for better storytelling.
🔹 Benchmarking – Compare with industry averages for deeper insights.
Best Practices for Using the PR KPI Dashboard
To maximize the value of your dashboard:
📌 Define Clear KPIs – Choose KPIs that align with business goals.
📌 Update Regularly – Enter actuals on time for accurate insights.
📌 Use Conditional Formatting – Highlight areas needing improvement.
📌 Simplify Visualization – Avoid clutter; focus on key metrics.
📌 Involve Stakeholders – Share dashboard insights with management.
📌 Review Trends – Look beyond monthly data; track year-over-year changes.
How to Implement the PR KPI Dashboard in Your Organization
-
Identify KPIs – List metrics that matter for your PR strategy.
-
Customize the Dashboard – Adjust sheets based on your reporting needs.
-
Input Targets and Previous Data – Establish baselines for measurement.
-
Update Actuals Monthly – Keep the data current.
-
Analyze Trends – Use charts to spot growth or decline.
-
Present Reports – Share insights with stakeholders for decision-making.
Conclusion
A Public Relations KPI Dashboard in Excel is a powerful yet affordable way to measure PR effectiveness. It transforms raw data into meaningful insights, ensures accountability, and helps businesses align PR efforts with organizational goals.
By using this dashboard, PR professionals can demonstrate their impact clearly, optimize strategies, and build stronger brand reputations.
Frequently Asked Questions (FAQs)
1. What is a PR KPI Dashboard in Excel?
It is a tool that tracks and visualizes PR metrics such as media mentions, sentiment, and engagement using Excel spreadsheets.
2. Why should PR teams use a dashboard?
A dashboard provides clarity, saves time, and helps PR teams measure effectiveness instead of relying on guesswork.
3. What KPIs can be tracked in PR?
Common KPIs include media mentions, share of voice, engagement rate, press release reach, and website traffic from PR.
4. Can small businesses use this dashboard?
Yes, Excel makes it cost-effective and easy to use for small organizations as well as large enterprises.
5. How often should I update the dashboard?
Update the dashboard monthly to ensure MTD and YTD insights remain accurate.
6. Can the dashboard integrate with other tools?
Yes, with some customization, you can connect it to Google Analytics, CRM systems, or social media reporting tools.
7. Is Excel enough for PR analytics?
For most small to medium businesses, Excel is sufficient. Larger organizations may integrate Excel dashboards with BI tools for advanced analytics.
Visit our YouTube channel to learn step-by-step video tutorials