Quality assurance (QA) plays a vital role in every organization. It ensures that products and services meet defined standards, customer expectations, and regulatory requirements. However, managing QA processes can be a real challenge when data is scattered across multiple files or systems.
This is where a Quality Assurance Report in Excel becomes extremely useful. With a well-structured Excel report, organizations can track defects, monitor inspection times, calculate rework hours, and identify performance trends across departments, shifts, or product lines.
In this article, we will explore everything about creating and using a Quality Assurance Report in Excel, its features, benefits, best practices, and frequently asked questions.
Click to Purchases Quality Assurance Report in Excel
What Is a Quality Assurance Report in Excel?
A Quality Assurance Report in Excel is a structured file designed to capture, monitor, and analyze quality-related data in an organization. It works as a centralized hub where managers, quality teams, and supervisors can:
-
Record inspection data.
-
Track defects by type, shift, or product line.
-
Measure inspection and rework durations.
-
Monitor trends over time.
-
Generate summaries and insights for decision-making.
Unlike static spreadsheets, a QA report in Excel can include:
-
Interactive slicers for filtering data.
-
Dynamic charts for visual analysis.
-
Automated calculations for defect percentages, averages, and variances.
This makes it a powerful yet user-friendly solution for organizations of all sizes.
Key Features of the Quality Assurance Report in Excel
Our ready-to-use Quality Assurance Report template in Excel comes with multiple pages, slicers, and charts to provide a complete view of quality performance.
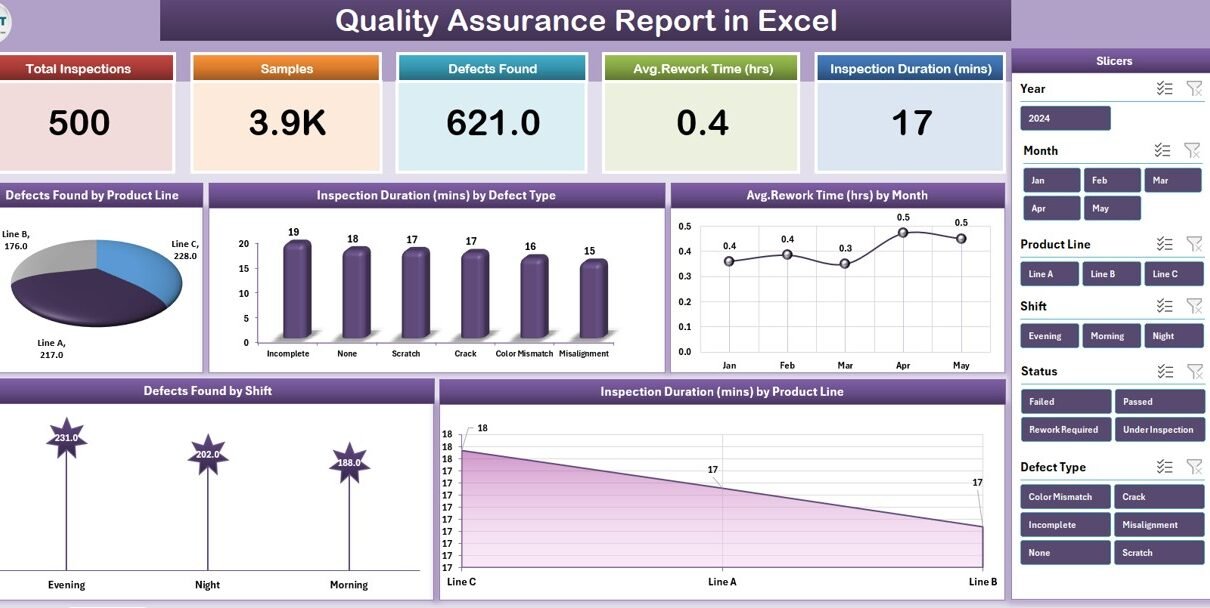
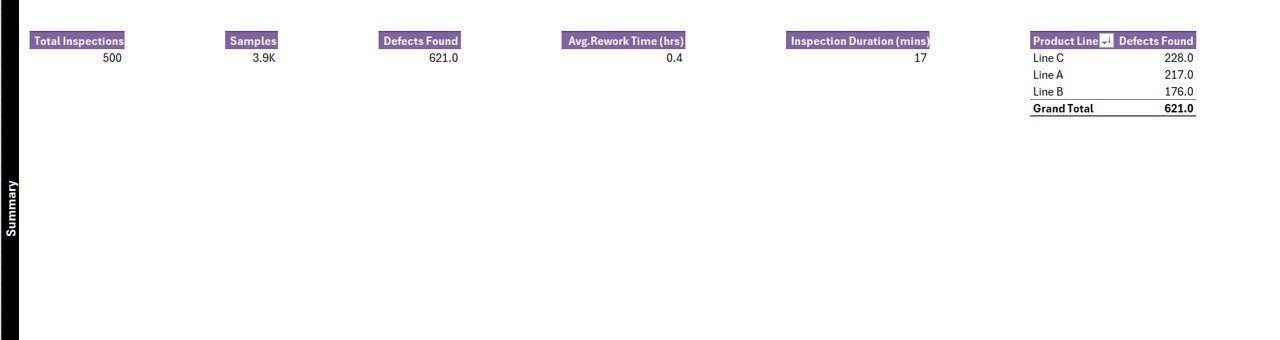
Summary Page
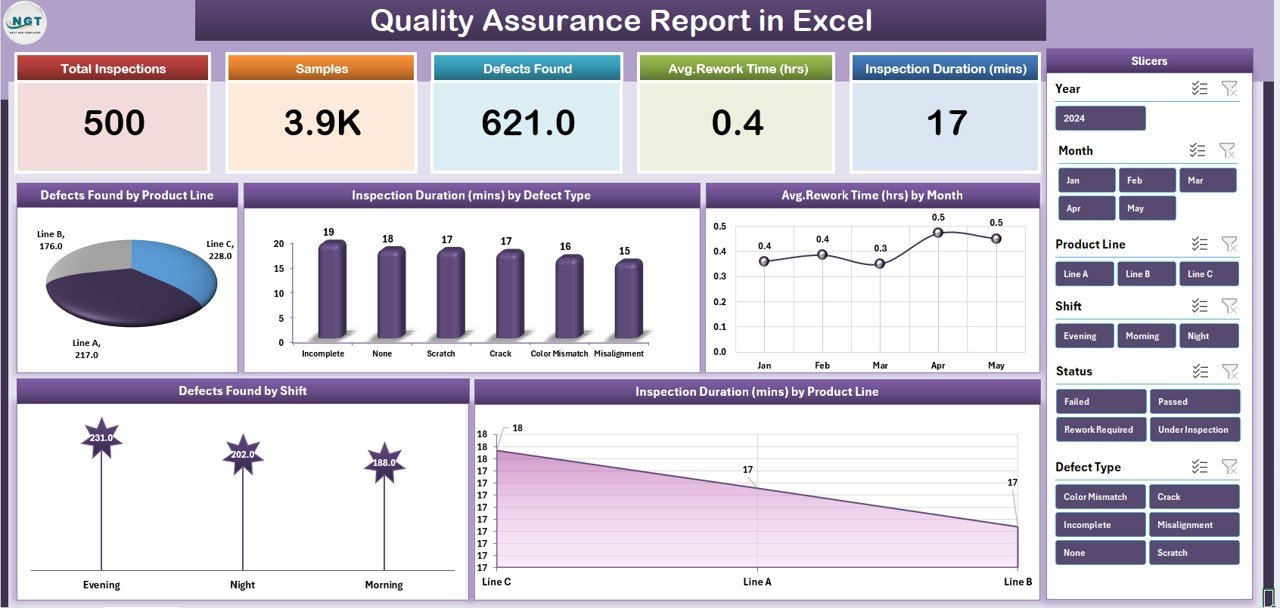
The Summary Page is the central dashboard of the report. It includes:
-
Five KPI Cards at the top to highlight critical metrics.
-
Right-side Slicer for filtering by product, shift, or date.
Five dynamic charts, including:
- Defects Found by Product Line.
- Inspection Duration (minutes) by Defect Type.
- Average Rework Time (hours) by Month.
- Defects Found by Shift.
- Inspection Duration (minutes) by Product Line.
This page gives a quick snapshot of overall performance.
Report Page
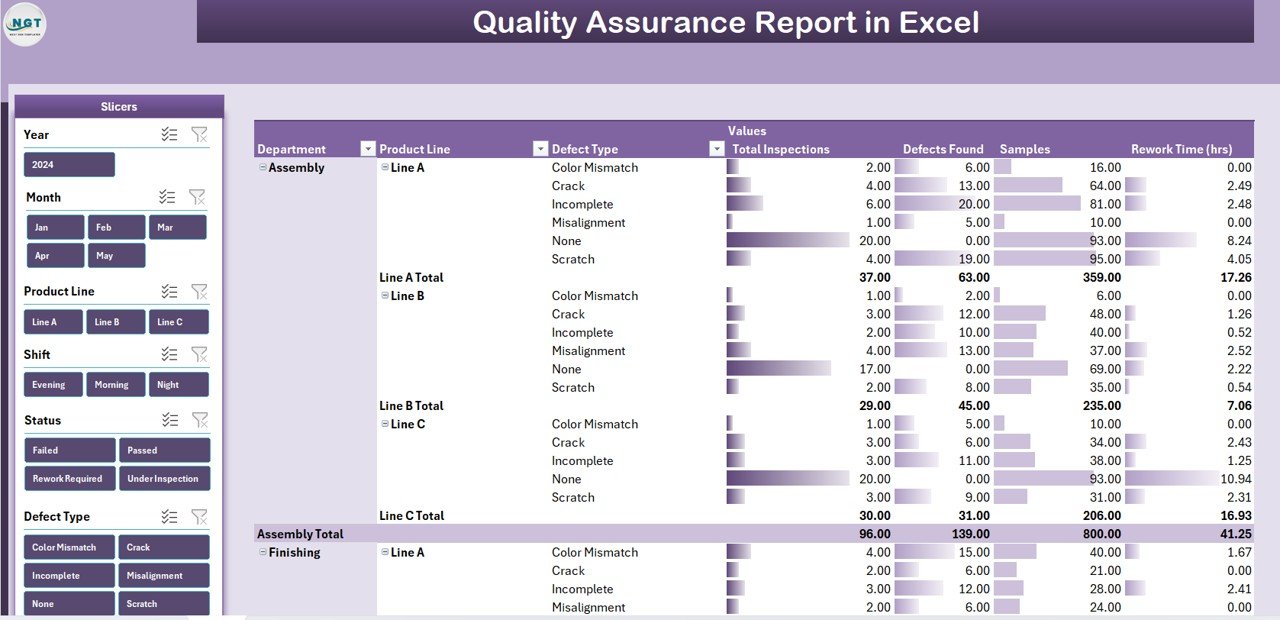
The Report Page provides a more detailed view.
-
Left-side Slicer allows filtering data based on custom criteria.
-
Information Table displays detailed inspection and defect data.
-
Useful for managers who need granular data for reporting and audits.
Data Sheet
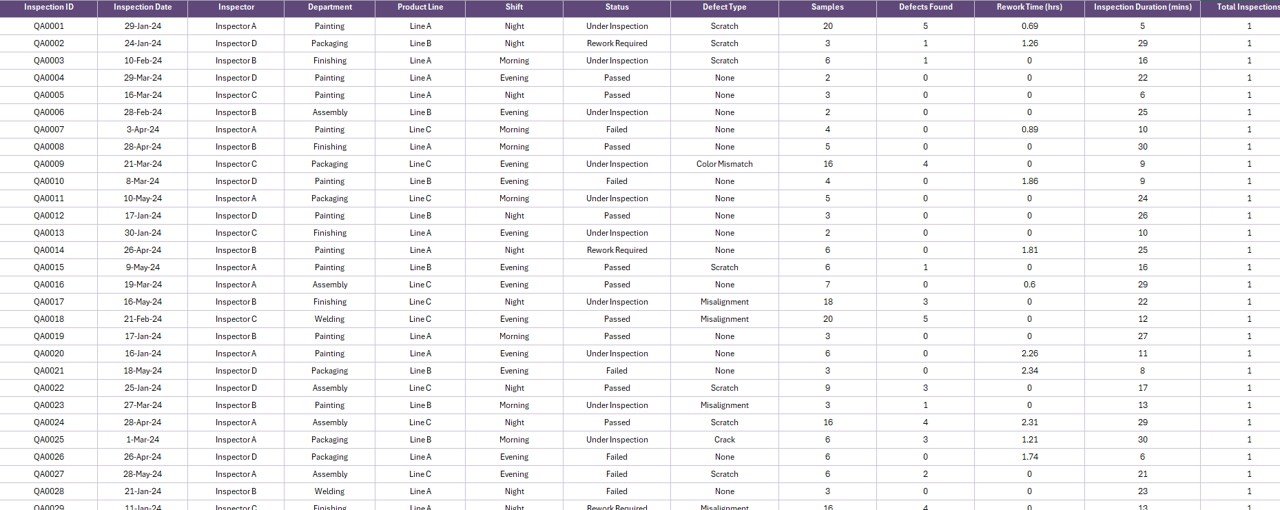
This sheet is the foundation of the report.
Click to Purchases Quality Assurance Report in Excel
-
Stores raw inspection and quality-related data.
-
Includes fields like Date, Product Line, Defect Type, Shift, Inspection Duration, and Rework Time.
-
Designed in a structured format to support pivot tables and charts.
Support Sheet
The Support Sheet contains reference lists used for drop-downs and slicers.
-
Helps standardize data entry.
-
Avoids errors from inconsistent naming.
-
Keeps the data entry process smooth and reliable.
Why Use Excel for Quality Assurance Reporting?
Many organizations use ERP systems or specialized QA software. However, Excel remains one of the most versatile tools for reporting. Here’s why:
-
Cost-effective: No need for expensive software.
-
Easy to customize: Add or remove fields, charts, or slicers as per your needs.
-
Familiar interface: Teams already know how to use Excel.
-
Flexible reporting: Pivot tables, charts, and formulas make it easy to generate insights.
-
Scalable: Works for small teams as well as large organizations with structured data.
Advantages of Quality Assurance Report in Excel
Using a QA report in Excel comes with several benefits:
📊 Real-time Analysis: Dynamic charts and slicers give instant insights.
⏱ Time-Saving: Automated calculations reduce manual effort.
✅ Improved Accuracy: Standardized fields minimize data entry errors.
🔍 Better Visibility: Managers can quickly identify problem areas.
📈 Performance Tracking: Monitor inspection trends, defect rates, and rework hours.
📂 Audit-Ready: Keeps data organized and easy to share during quality audits.
Opportunities for Improvement in QA Reports
Even though Excel is powerful, organizations should consider continuous improvement in their QA reporting:
-
Automation: Use macros or Power Query to reduce manual data entry.
-
Integration: Connect Excel with ERP systems or databases.
-
Visualization: Enhance charts with conditional formatting and KPIs.
-
Data Quality: Ensure clean and consistent data input.
-
Collaboration: Use Excel Online or SharePoint for team access.
Best Practices for Creating a Quality Assurance Report in Excel
To get the most value from your QA report, follow these best practices:
-
Use structured data tables: Always store data in a tabular format for easy analysis.
-
Add slicers and filters: Make reports interactive.
-
Apply conditional formatting: Highlight defect rates above thresholds.
Track KPIs: Include metrics such as:
- Defect Rate (%)
- First Pass Yield (%)
- Inspection Time (minutes)
- Rework Time (hours)
- Defects per Product Line
-
Update data regularly: Keep the report current for decision-making.
-
Protect sensitive data: Use Excel’s password protection for QA reports.
Step-by-Step Guide to Using the Report
Here’s how quality teams can use the ready-made report template:
-
Enter Raw Data in the Data Sheet.
-
Use Support Sheet lists to standardize defect types, product lines, and shifts.
-
Refresh Pivot Tables to update charts and tables.
-
Navigate to the Summary Page to view high-level KPIs.
-
Use Slicers to drill down by product, defect type, or shift.
-
Review Detailed Report Page for in-depth analysis.
-
Share or export charts and tables for team meetings or audits.
Conclusion
A Quality Assurance Report in Excel is a practical, cost-effective, and efficient solution for monitoring product quality, inspection activities, and defect trends. With features like KPI cards, slicers, and dynamic charts, it empowers organizations to make data-driven decisions, reduce rework, and improve overall quality.
When combined with best practices such as structured data, automation, and KPI tracking, it becomes a powerful tool for continuous improvement.
Frequently Asked Questions (FAQs)
1. How do I create a Quality Assurance Report in Excel?
You can create it using structured data tables, pivot tables, slicers, and charts. Start with raw data (defect type, inspection duration, shift, etc.) and then build summary charts and KPI cards.
2. What KPIs should I include in a QA report?
Some common QA KPIs include: Defect Rate, First Pass Yield, Inspection Duration, Rework Time, and Defects by Product Line.
3. Can I automate QA reports in Excel?
Yes, you can use macros, Power Query, or VBA scripts to automate data entry, calculations, and updates.
4. What is the difference between QA and QC reports?
-
QA (Quality Assurance): Focuses on preventing defects through processes and standards.
-
QC (Quality Control): Focuses on detecting and correcting defects in products.
5. Is Excel enough for large-scale quality reporting?
Excel works well for small to medium-sized organizations. For large-scale operations, integration with ERP systems or specialized QA software may be required.
Visit our YouTube channel to learn step-by-step video tutorials