Healthcare organizations must move fast. Radiology centers handle hundreds of scans every day. Moreover, they manage technicians, departments, referring doctors, and city-level operations. However, many imaging centers still rely on scattered spreadsheets. As a result, leaders struggle to track completed scans, revenue targets, turnaround time, and profitability in one place.
So, how can radiology centers gain full operational control without investing in complex software?
The answer is simple.
You need a Radiology and Imaging Dashboard in Excel.
Click to Purchases Radiology and Imaging Dashboard in Excel
In this detailed guide, you will learn:
-
What a Radiology and Imaging Dashboard in Excel is
-
Why imaging centers need structured KPI tracking
-
Detailed explanation of all 5 dashboard pages
-
Important KPIs included in the dashboard
-
Advantages of Radiology and Imaging Dashboard in Excel
-
Best Practices for the Radiology and Imaging Dashboard in Excel
-
Frequently Asked Questions with Answers
Let us explore everything step by step.
What Is a Radiology and Imaging Dashboard in Excel?
A Radiology and Imaging Dashboard in Excel is a ready-to-use and fully interactive reporting tool that helps radiology centers monitor operational, financial, and performance metrics in one structured file.
Instead of opening multiple Excel sheets, you can:
-
Track Completed Scan %
-
Monitor Target Revenue vs Actual Revenue
-
Analyze Cost vs Revenue
-
Evaluate performance by Department, Technician, and Referring Doctor
-
Review monthly trends
-
Compare city-wise profitability
Because the dashboard runs in Excel, you do not need additional software. Moreover, you can customize it easily according to your hospital or diagnostic center requirements.
Why Do Radiology Centers Need a Dashboard?
Radiology departments generate high-value data every day. However, without proper structure, that data becomes difficult to analyze.
For example:
Click to Purchases Radiology and Imaging Dashboard in Excel
-
You may know total revenue, but you may not know which modality drives the highest profit.
-
You may see scan volume, but you may not identify underperforming technicians.
-
You may track monthly revenue, but you may not see cost leakage by department.
Therefore, a centralized dashboard becomes essential.
With a Radiology and Imaging Dashboard in Excel, you gain:
-
Real-time visibility
-
Faster decision-making
-
Clear performance tracking
-
Improved profitability control
What Are the Key Features of the Radiology and Imaging Dashboard in Excel?
This ready-to-use Excel dashboard includes structured navigation and five powerful analytical pages.
Page Navigator
You will find the Page Navigator on the left side. It allows smooth navigation across all analytical pages. Therefore, users can switch between Overview, Department Analysis, Technician Analysis, Referring Doctor Analysis, and Month Analysis without confusion.
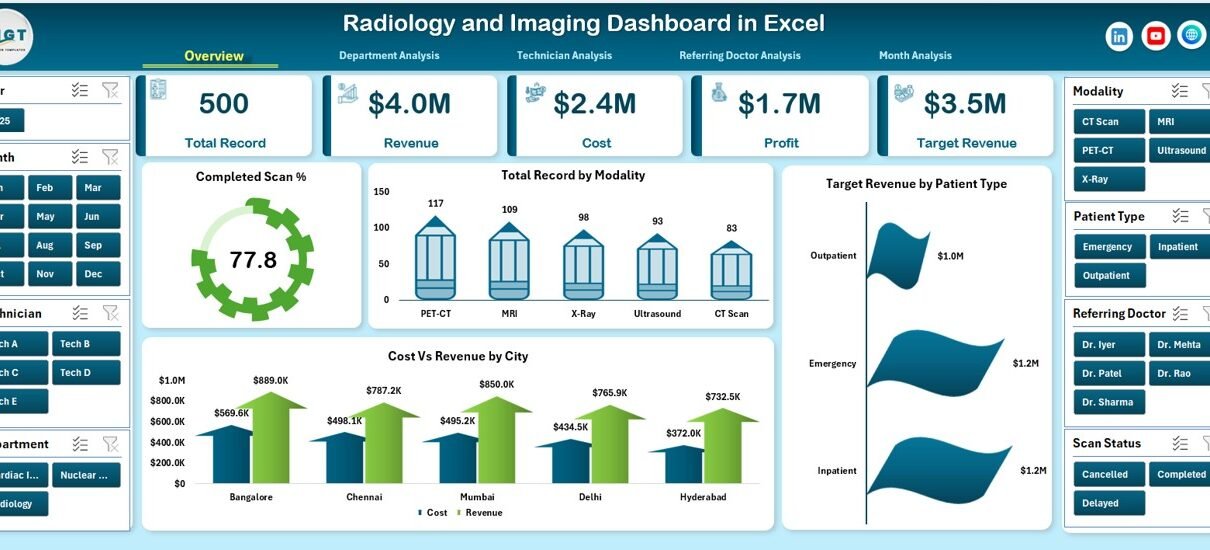
What Does the Overview Page Show?
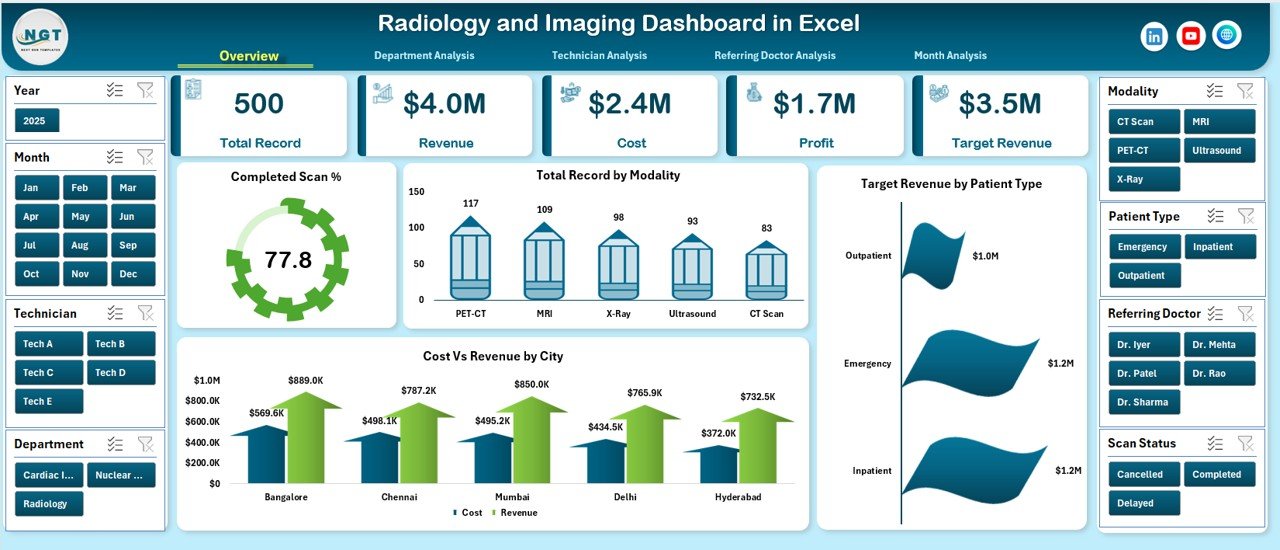
The Overview Page acts as the command center of the dashboard.
On the right side, you will find slicers. These slicers allow filtering by key dimensions such as Month, City, Department, or Modality.
Additionally, this page includes four KPI cards and four charts.
KPI Cards on the Overview Page
-
Total Revenue
-
Total Cost
-
Total Profit
-
Completed Scan %
These cards instantly show performance at a glance.
Charts on the Overview Page
-
Completed Scan %
-
Shows performance efficiency
-
Helps identify operational effectiveness
-
-
Total Record by Modality
-
Displays scan distribution across MRI, CT, X-Ray, Ultrasound, etc.
-
Click to Purchases Radiology and Imaging Dashboard in Excel
-
Helps identify high-demand modalities
-
-
Target Revenue by Patient Type
-
Compares revenue expectations by inpatient vs outpatient
-
Supports revenue strategy
-
-
Cost vs Revenue by City
-
Highlights city-level profitability
-
Helps allocate resources effectively
-
Therefore, the Overview page gives a complete snapshot of the imaging center’s health.
How Does the Department Analysis Page Help?
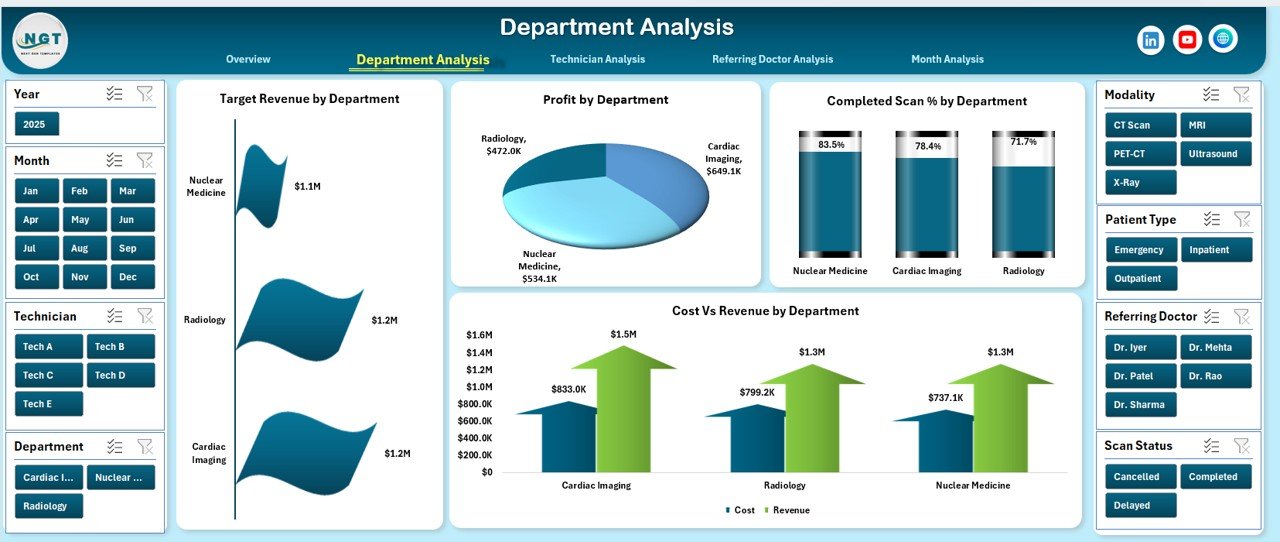
The Department Analysis Page focuses on departmental performance.
Again, slicers on the right side allow filtering for better clarity.
Charts in Department Analysis
-
Target Revenue by Department
-
Profit by Department
-
Completed Scan % by Department
-
Cost vs Revenue by Department
This page helps management answer critical questions:
-
Which department generates the highest profit?
-
Which department struggles with scan completion rate?
-
Where does cost exceed revenue?
As a result, department heads can take corrective action quickly.
What Insights Does the Technician Analysis Page Provide?
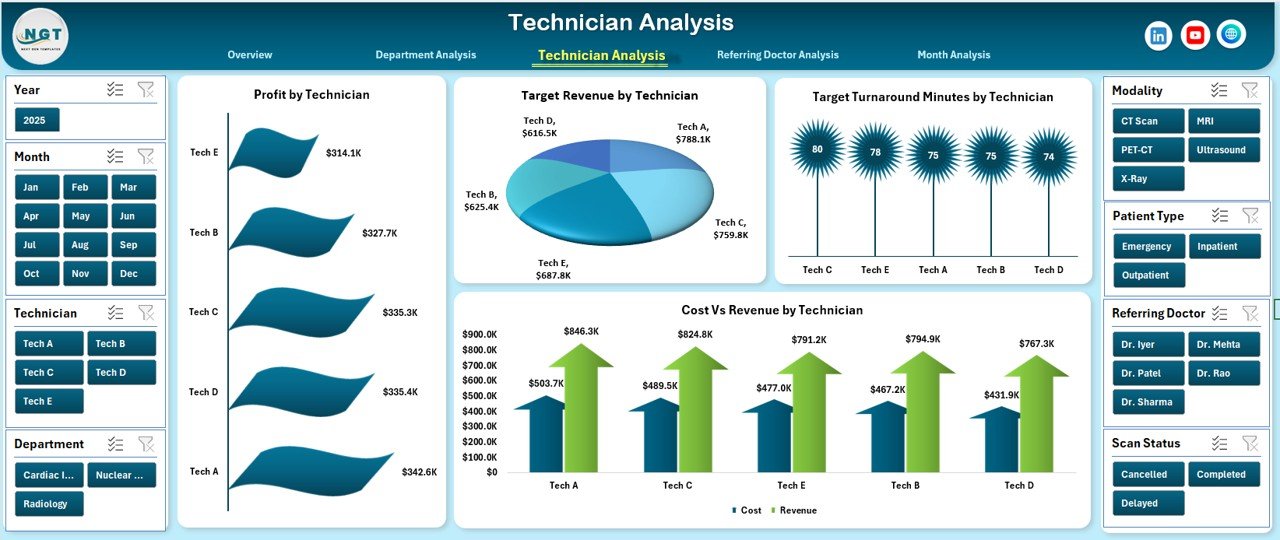
Technicians directly impact service quality and turnaround time. Therefore, monitoring technician performance becomes essential.
The Technician Analysis Page includes:
-
Target Revenue by Technician
-
Profit by Technician
-
Target Turnaround Minutes by Technician
-
Cost vs Revenue by Technician
With this analysis, you can:
-
Identify top-performing technicians
-
Detect slow turnaround times
-
Align incentives with productivity
-
Improve training programs
Moreover, you can reward high-performing staff based on real data.
Why Is Referring Doctor Analysis Important?
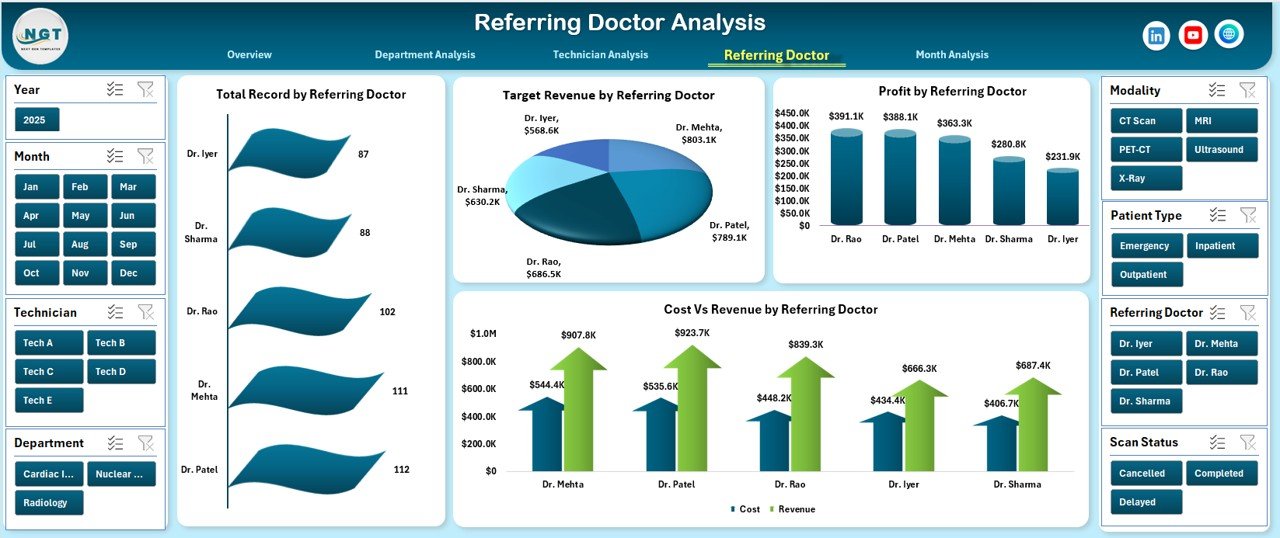
Referring doctors drive patient inflow. Therefore, understanding their contribution supports growth strategy.
The Referring Doctor Analysis Page includes:
-
Consultation Target Revenue by Referring Doctor
-
Profit by Referring Doctor
-
Target Revenue by Referring Doctor
-
Cost vs Revenue by Referring Doctor
This page helps you:
-
Identify high-value referral partners
-
Track revenue contribution
-
Improve doctor engagement
-
Develop referral programs
As a result, your center can strengthen relationships with key medical professionals.
Click to Purchases Radiology and Imaging Dashboard in Excel
What Does the Month Analysis Page Show?
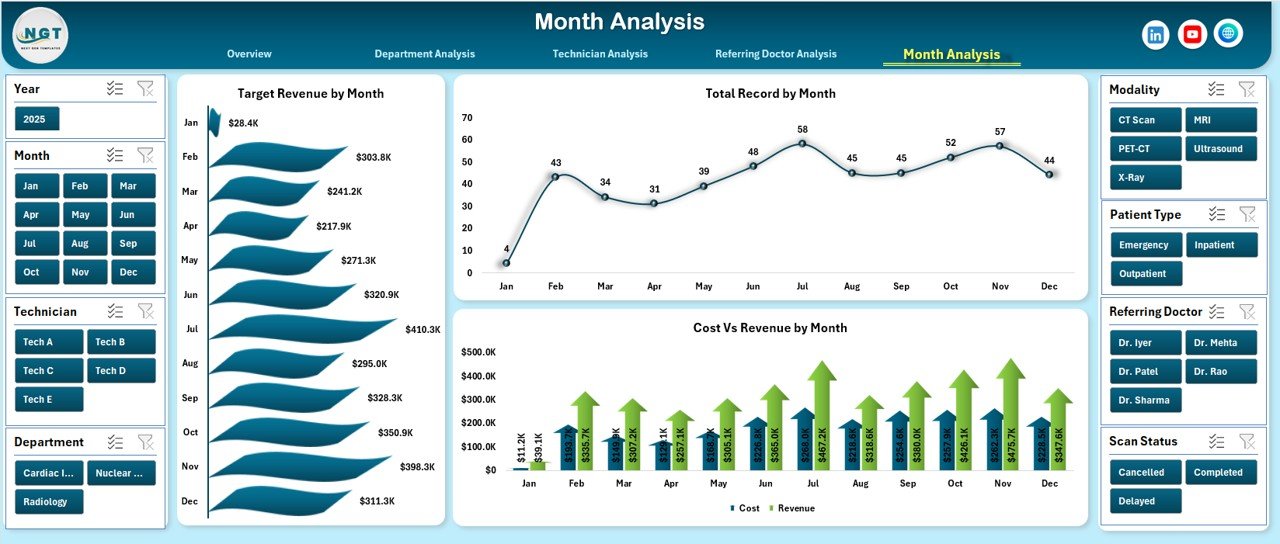
Trend analysis helps leaders see patterns over time.
The Month Analysis Page includes:
-
Target Revenue by Month
-
Total Record by Month
-
Cost vs Revenue by Month
This page supports:
-
Seasonal performance tracking
-
Revenue forecasting
-
Budget planning
-
Trend comparison
Therefore, management can plan investments based on real trends instead of guesswork.
What Is Included in the Support Sheet?
The Support Sheet stores:
-
Lookup values
-
Modality list
-
Department list
-
Technician list
-
Referring doctor list
-
City list
This sheet ensures structured data validation. Moreover, it keeps dropdowns dynamic and accurate.
What Does the Data Sheet Contain?
The Data Sheet acts as the backbone of the dashboard.
It typically includes:
-
Date
-
Month
-
Patient Type
-
Modality
-
Department
-
Technician Name
-
Referring Doctor
-
City
-
Target Revenue
-
Actual Revenue
-
Cost
-
Profit
-
Turnaround Minutes
-
Completed Scan Flag
Because the dashboard uses Pivot Tables and Pivot Charts, structured data becomes essential.
What KPIs Should a Radiology and Imaging Dashboard Track?
Below are important KPIs:
-
Completed Scan %
-
Revenue Achievement %
-
Profit Margin %
-
Cost Per Scan
-
Average Turnaround Time
-
Revenue by Modality
-
Revenue by Department
-
Technician Productivity
-
Referral Revenue Contribution
-
Monthly Growth Rate
These KPIs help measure efficiency, profitability, and growth.
Advantages of Radiology and Imaging Dashboard in Excel
Now let us explore the major benefits.
1. Centralized Data Management
You store all operational and financial data in one structured file. Therefore, reporting becomes faster and easier.
2. Real-Time Performance Monitoring
You can instantly filter data using slicers. As a result, management gains immediate clarity.
3. Better Revenue Control
Because you compare Target Revenue vs Actual Revenue, you identify gaps quickly.
4. Cost Optimization
Cost vs Revenue charts highlight profit leakage areas. Therefore, you can take corrective action.
5. Improved Staff Accountability
Technician and Department Analysis promotes accountability. Moreover, it supports performance-based incentives.
6. Strong Referral Strategy
Referring Doctor Analysis helps strengthen relationships with top contributors.
7. Easy Customization
Since the dashboard runs in Excel, you can modify KPIs, charts, and layouts easily.
Best Practices for the Radiology and Imaging Dashboard in Excel
To maximize benefits, follow these best practices.
1. Maintain Clean Data
Always use structured tables. Moreover, avoid blank rows and inconsistent formats.
2. Update Data Regularly
Update the Data Sheet weekly or monthly. Therefore, insights remain accurate.
3. Use Consistent Naming
Keep department, modality, and technician names consistent. This practice prevents reporting errors.
4. Review KPIs Monthly
Conduct monthly performance meetings. Discuss Completed Scan %, Revenue, and Profit trends.
5. Align Targets with Strategy
Set realistic Target Revenue values. Additionally, adjust them based on seasonal demand.
6. Train Staff
Teach department heads how to read charts and filters. As a result, decision-making improves across levels.
7. Protect Critical Sheets
Lock Support and Data Sheets to prevent accidental changes.
How Can This Dashboard Improve Profitability?
Click to Purchases Radiology and Imaging Dashboard in Excel
When you monitor revenue and cost side by side, you identify inefficiencies. Moreover, technician analysis helps reduce turnaround time. Faster turnaround increases patient satisfaction. Consequently, referral rates improve.
Additionally, department-level analysis reveals low-performing units. Therefore, you can reallocate resources strategically.
Over time, structured analysis leads to higher profit margins and operational stability.
Who Can Benefit from This Dashboard?
This dashboard suits:
-
Diagnostic Centers
-
Radiology Clinics
-
Multi-Specialty Hospitals
-
Imaging Chains
-
Healthcare Administrators
-
Financial Controllers
-
Operations Managers
Because the structure remains flexible, both small clinics and large hospital chains can use it.
How Does Excel Make This Dashboard Powerful?
Excel offers:
-
Pivot Tables
-
Pivot Charts
-
Slicers
-
Conditional Formatting
-
Structured Tables
Therefore, you gain enterprise-level insights without expensive software.
Moreover, Excel allows quick customization and sharing.
Conclusion
Radiology centers operate in a competitive and fast-moving environment. Therefore, leaders must track operational efficiency and financial performance carefully.
A Radiology and Imaging Dashboard in Excel gives you:
-
Clear performance visibility
-
Revenue tracking
-
Cost control
-
Technician evaluation
-
Department comparison
-
Monthly trend analysis
Instead of relying on scattered spreadsheets, you gain one centralized reporting system.
If you want structured growth and improved profitability, this dashboard provides the right foundation.
Frequently Asked Questions with Answers
1. What is a Radiology and Imaging Dashboard in Excel?
It is a ready-to-use Excel reporting tool that tracks scan performance, revenue, cost, and profitability in one file.
2. Can small diagnostic centers use this dashboard?
Yes. Small clinics can use it easily. Moreover, they can customize it based on their needs.
3. Do I need advanced Excel knowledge?
No. Basic Excel knowledge works. However, understanding Pivot Tables improves usage.
4. Can I modify KPIs?
Yes. You can edit KPIs, charts, and formulas according to your business goals.
5. How often should I update the data?
You should update it weekly or monthly for accurate reporting.
6. Does this dashboard support multiple cities?
Yes. It includes City-level analysis and Cost vs Revenue comparison.
7. Can I track technician performance?
Yes. The Technician Analysis page provides detailed productivity tracking.
Visit our YouTube channel to learn step-by-step video tutorials