Innovation is the heartbeat of every organization that wants to stay ahead in the competitive market. Research and Development (R&D) teams constantly strive to create new products, improve existing ones, and ensure that innovation aligns with business goals. However, tracking progress, measuring performance, and identifying areas for improvement can be challenging.
That’s where a R&D KPI Scorecard in Excel comes in — a powerful, easy-to-use tool designed to help teams monitor performance indicators, visualize trends, and make data-driven decisions.
In this article, you’ll discover everything about this scorecard — its structure, benefits, best practices, and how you can use it to transform your R&D management process.
Click to Purchases R&D KPI Scorecard in Excel
What Is an R&D KPI Scorecard in Excel?
An R&D KPI Scorecard in Excel is a ready-to-use performance management template that enables organizations to measure key research and innovation metrics. It consolidates data into one structured dashboard, providing a clear overview of how your R&D projects are performing compared to targets.
Unlike generic spreadsheets, this scorecard offers automated visual analysis, trend charts, and color-coded indicators that simplify complex data into actionable insights.
Whether you’re managing multiple R&D projects, tracking innovation cycles, or analyzing resource utilization, this Excel-based scorecard helps you evaluate progress efficiently — without needing complex software.
Structure of the R&D KPI Scorecard
This R&D KPI Scorecard template includes four main worksheet tabs, each designed to simplify a specific aspect of performance management.
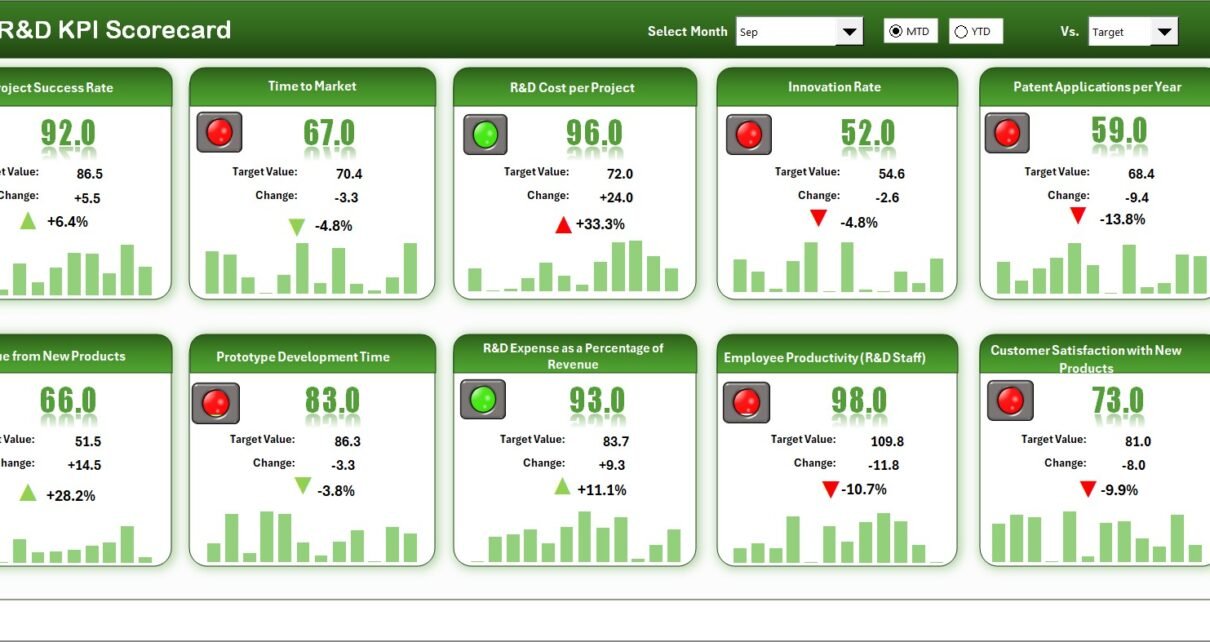
Scorecard Sheet — The Main Dashboard

The Scorecard Sheet is the heart of this workbook. It provides a complete overview of your R&D performance at a glance.
Key Features:
-
Dropdown Menus: Select a specific month or view cumulative data as Month-to-Date (MTD) or Year-to-Date (YTD).
-
Actual vs Target Comparison: Instantly see where your KPIs stand in relation to targets.
-
Conditional Formatting Indicators: Use color-coded visuals (green, yellow, red) to quickly identify performance status.
-
Comprehensive KPI Overview: Track all essential R&D KPIs — from innovation output to project efficiency.
This tab gives managers and decision-makers a snapshot of overall performance without navigating multiple reports.
KPI Trend Sheet — Visualize Performance Over Time

The KPI Trend Sheet allows you to analyze historical performance trends for each KPI.
Click to Purchases R&D KPI Scorecard in Excel
Features include:
-
Dynamic Dropdowns: Select any KPI name (cell C3) to view its details.
-
Detailed KPI Metadata: Displays KPI Group, Unit, Formula, and Definition for easy understanding.
-
Trend Charts: Visual representation of MTD and YTD data for Actual, Target, and Previous Year (PY) metrics.
-
Comparison Insights: Helps identify long-term performance patterns and deviations.
This sheet is ideal for identifying seasonal variations, recurring bottlenecks, or steady improvements in R&D activities.
Input Data Sheet — Centralized Data Management

The Input Data Sheet acts as your database. All KPI data — including Actuals, Targets, and Prior Year values — are recorded here.
Highlights:
-
Simple Data Entry: Enter monthly figures with ease.
-
Dynamic Updates: The data automatically reflects across dashboard visuals and charts.
-
Flexibility: Add or modify KPIs anytime to ensure the scorecard evolves with your R&D goals.
This makes it simple for analysts or managers to update new data without breaking formulas or visuals.
KPI Definition Sheet — Your Reference Guide

The KPI Definition Sheet provides clarity and standardization for all KPIs used in the scorecard.
It includes the following columns:
-
KPI Name
-
KPI Group
-
Unit of Measurement
-
Formula
-
Definition
This ensures that every team member understands what each KPI measures and how it is calculated. Consistency in definitions prevents misinterpretation and strengthens data reliability.
Why You Need an R&D KPI Scorecard in Excel
R&D departments often deal with diverse data sources — budgets, experiments, test results, and innovation outputs. Without an organized tracking system, it becomes difficult to measure progress accurately.
An Excel-based R&D KPI Scorecard solves this by providing:
-
Centralized visibility of all R&D performance metrics.
-
Automated reporting that saves hours of manual data compilation.
-
Visual clarity through charts and conditional formatting.
-
Actionable insights to guide management decisions.
This scorecard helps teams focus on what matters most — improving innovation efficiency and delivering measurable outcomes.
How to Use the R&D KPI Scorecard
Implementing the scorecard is simple and user-friendly. Here’s how to get started:
Step 1: Input the Data
Enter your monthly Actual, Target, and Previous Year numbers in the Input Data Sheet.
Step 2: Define the KPIs
Use the KPI Definition Sheet to describe formulas and parameters clearly.
Step 3: Analyze in the Scorecard Sheet
Open the Scorecard Sheet, choose the desired month or YTD view, and instantly visualize performance.
Step 4: Review Trends
Switch to the KPI Trend Sheet to explore performance patterns and identify improvement opportunities.
Step 5: Take Action
Use insights from the visuals to make informed strategic decisions for your R&D department.
Advantages of Using the R&D KPI Scorecard in Excel
Here are some of the major benefits of using this tool:
1. Simplifies Complex Data
You can transform complex research data into easy-to-read visuals and indicators.
2. Saves Time
Automated calculations and charts save significant reporting time.
3. Enhances Decision-Making
Managers can easily identify underperforming areas and take corrective action.
4. Improves Accountability
Clear KPIs ensure that everyone in the team knows their performance metrics.
5. Promotes Transparency
All performance data stays in one centralized, easily accessible Excel file.
6. Reduces Errors
Since the calculations are formula-based, human error in manual reporting is minimized.
Opportunities for Improvement in R&D Performance Tracking
Even with a well-structured scorecard, there are areas organizations can enhance further:
-
Integrate automation: Use Power Query or VBA to fetch data automatically.
-
Standardize KPI definitions: Ensure consistency across all departments.
-
Use dashboards for visual appeal: Convert sheets into a one-click dashboard view.
-
Link with Power BI: Extend Excel data to Power BI for advanced analytics.
-
Adopt continuous learning: Regularly review KPIs to keep them aligned with new R&D goals.
By improving these areas, you can maximize the effectiveness of your R&D reporting system.
Click to Purchases R&D KPI Scorecard in Excel
Best Practices for Managing R&D KPIs in Excel
To ensure your KPI Scorecard delivers maximum value, follow these best practices:
📘 1. Define SMART KPIs
Each KPI should be Specific, Measurable, Achievable, Relevant, and Time-bound.
🗓️ 2. Update Data Regularly
Ensure timely updates to maintain accuracy in analysis.
📈 3. Use Visuals for Quick Insights
Incorporate conditional formatting, charts, and progress bars for better understanding.
🧮 4. Maintain Data Integrity
Protect sheets and formulas to avoid accidental edits or deletions.
🧠 5. Encourage Collaboration
Share the scorecard with teams to improve cross-departmental communication.
🔄 6. Review KPIs Quarterly
Regular reviews help you keep metrics relevant to current organizational objectives.
Common Mistakes to Avoid
While using the R&D KPI Scorecard, avoid these common pitfalls:
-
Tracking too many KPIs — focus on the most impactful ones.
-
Ignoring trend analysis — patterns reveal real performance shifts.
-
Neglecting visualization — data without visuals loses meaning.
-
Not updating definitions — outdated formulas can mislead decisions.
-
Relying only on MTD values — always compare YTD for a holistic view.
Real-World Applications of the R&D KPI Scorecard
Let’s explore how different teams can benefit from this template:
🧪 Research Teams
Monitor innovation pipeline and test outcomes to identify successful prototypes.
⚙️ Engineering Teams
Track efficiency in product development and design improvements.
💰 Finance Departments
Evaluate cost vs performance and ensure optimal R&D expenditure.
👥 HR Teams
Assess productivity and training needs for R&D professionals.
🧍♂️ Top Management
Use KPI summaries to measure ROI from R&D initiatives and guide strategic decisions.
Example Use Case
Company X, a consumer electronics manufacturer, adopted the R&D KPI Scorecard in Excel to track innovation efficiency.
After implementing the tool:
-
Reporting time dropped by 60%.
-
The innovation success rate improved by 15%.
-
Product development cycle time reduced by 20%.
This demonstrates how a simple yet powerful Excel-based scorecard can deliver tangible business results.
Conclusion
The R&D KPI Scorecard in Excel is more than just a spreadsheet — it’s a complete performance management system that helps organizations drive innovation with precision. By centralizing key data, visualizing trends, and simplifying analysis, it empowers teams to make informed, strategic decisions.
Frequently Asked Questions (FAQs)
1. What is the purpose of an R&D KPI Scorecard?
It helps track and analyze key performance indicators related to innovation, product development, and research outcomes.
2. How often should the data be updated?
It’s best to update the data monthly to ensure your analysis remains current and accurate.
3. Can I customize the KPIs in the scorecard?
Yes. The KPI Definition Sheet allows you to add, edit, or remove KPIs as needed.
4. Is this scorecard suitable for small organizations?
Absolutely. It’s designed in Excel, making it accessible for both small teams and large enterprises.
5. Can I use this with Power BI?
Yes. You can easily link this Excel data to Power BI for advanced visualizations and real-time dashboards.
6. Does it require Excel formulas knowledge?
Not much. The template comes prebuilt — you only need to input data in the designated cells.
7. How does it help in improving innovation performance?
It identifies bottlenecks, compares actual vs target values, and highlights trends that support data-driven decisions.
8. Can I track both MTD and YTD data?
Yes. The scorecard provides dropdown options to switch between Month-to-Date and Year-to-Date analyses.
Visit our YouTube channel to learn step-by-step video tutorials
Click to Purchases R&D KPI Scorecard in Excel