Real estate development involves high capital investment, long project timelines, and multiple risk factors. Developers, project managers, and investors must continuously track project costs, revenues, phases, risks, and profitability. However, many teams still rely on scattered Excel sheets, manual calculations, and delayed reports. As a result, cost overruns and profit leakage often go unnoticed.
That is exactly why a Real Estate Development Dashboard in Excel becomes a powerful and practical solution. This ready-to-use dashboard brings all critical real estate KPIs into one interactive Excel file. Moreover, it helps stakeholders monitor project performance, analyze risks, control costs, and improve profitability.
In this detailed and SEO-friendly blog post, you will learn what a Real Estate Development Dashboard in Excel is, why it is important, how it works, its page-wise structure, key KPIs, advantages, best practices, and frequently asked questions. The language remains simple, clear, and business-focused so you can apply it immediately.
Click to Purchases Real Estate Development Dashboard in Excel
What Is a Real Estate Development Dashboard in Excel?
A Real Estate Development Dashboard in Excel is an interactive reporting and analysis tool designed to track and visualize real estate project performance. It consolidates data related to project costs, revenues, phases, cities, property types, risks, and profit margins into one structured Excel dashboard.
Instead of reviewing multiple reports, users can monitor the entire real estate portfolio through charts, KPIs, and slicers. As a result, decision-makers gain instant visibility into financial health and project progress.
Most importantly, Excel provides flexibility and familiarity. Therefore, teams can adopt this dashboard without investing in expensive BI tools.
Why Do Real Estate Developers Need a Dashboard in Excel?
Real estate projects involve land acquisition, construction, marketing, and sales. Each stage carries financial and operational risks. Without structured reporting, teams struggle to control costs and forecast profitability.
A Real Estate Development Dashboard in Excel helps because:
-
It provides a single source of truth for all projects
-
It tracks total project cost and revenue clearly
-
It highlights high-risk phases and properties
-
It improves cost control and margin visibility
-
It supports faster and better investment decisions
As a result, developers move from reactive reporting to data-driven project management.
How Does a Real Estate Development Dashboard in Excel Work?
The dashboard works on a simple and logical flow.
First, users capture all project-related data in a structured Data Sheet. Then, Excel formulas and pivot-based logic calculate KPIs. Finally, the dashboard pages display insights using charts, cards, and slicers.
Because of this approach, users can update data easily while the dashboard refreshes insights automatically.
Click to Purchases Real Estate Development Dashboard in Excel
Overall Structure of the Real Estate Development Dashboard in Excel
This ready-to-use template contains 5 interactive dashboard pages in the Excel desktop application. Additionally, it includes supporting data sheets to manage inputs and calculations.
A Page Navigator on the left side allows users to move between pages easily, improving usability and presentation.
Let us understand each dashboard page in detail.
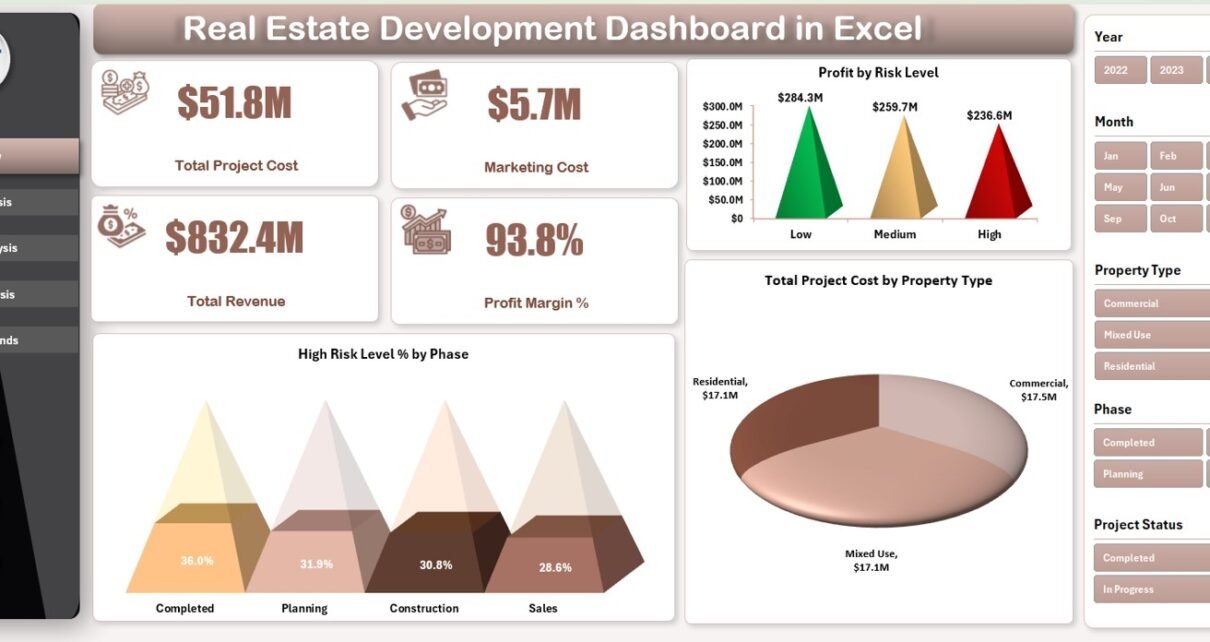
1. Overview Page – Executive-Level Project Summary
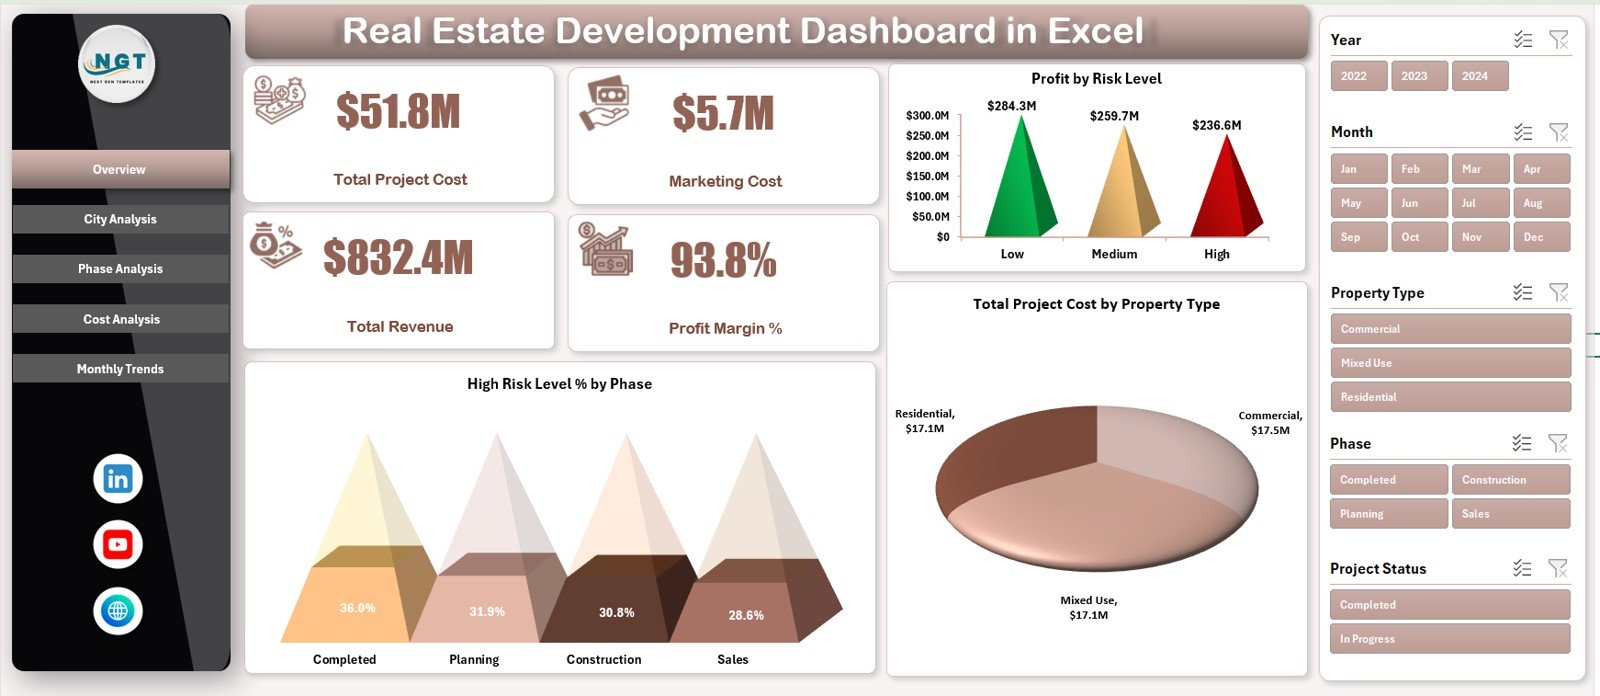
The Overview Page is the main landing page of the Real Estate Development Dashboard in Excel. This page provides a high-level snapshot of overall project performance.
KPI Cards on the Overview Page
The dashboard displays four key KPI cards:
-
Total Project Cost – Overall investment across projects
-
Marketing Cost – Total spending on promotions and sales
-
Total Revenue – Revenue generated from property sales
-
Profit Margin % – Overall profitability indicator
These cards give decision-makers instant financial visibility.
Charts on the Overview Page
The Overview Page also includes three insightful charts:
-
Profit by Risk Level – Shows profitability across risk categories
-
High Risk Level % by Phase – Highlights risky project phases
-
Total Project Cost by Property Type – Compares costs across property types
As a result, leadership can quickly identify risk exposure and cost drivers.
2. City Analysis Page – Location-Based Performance Insights
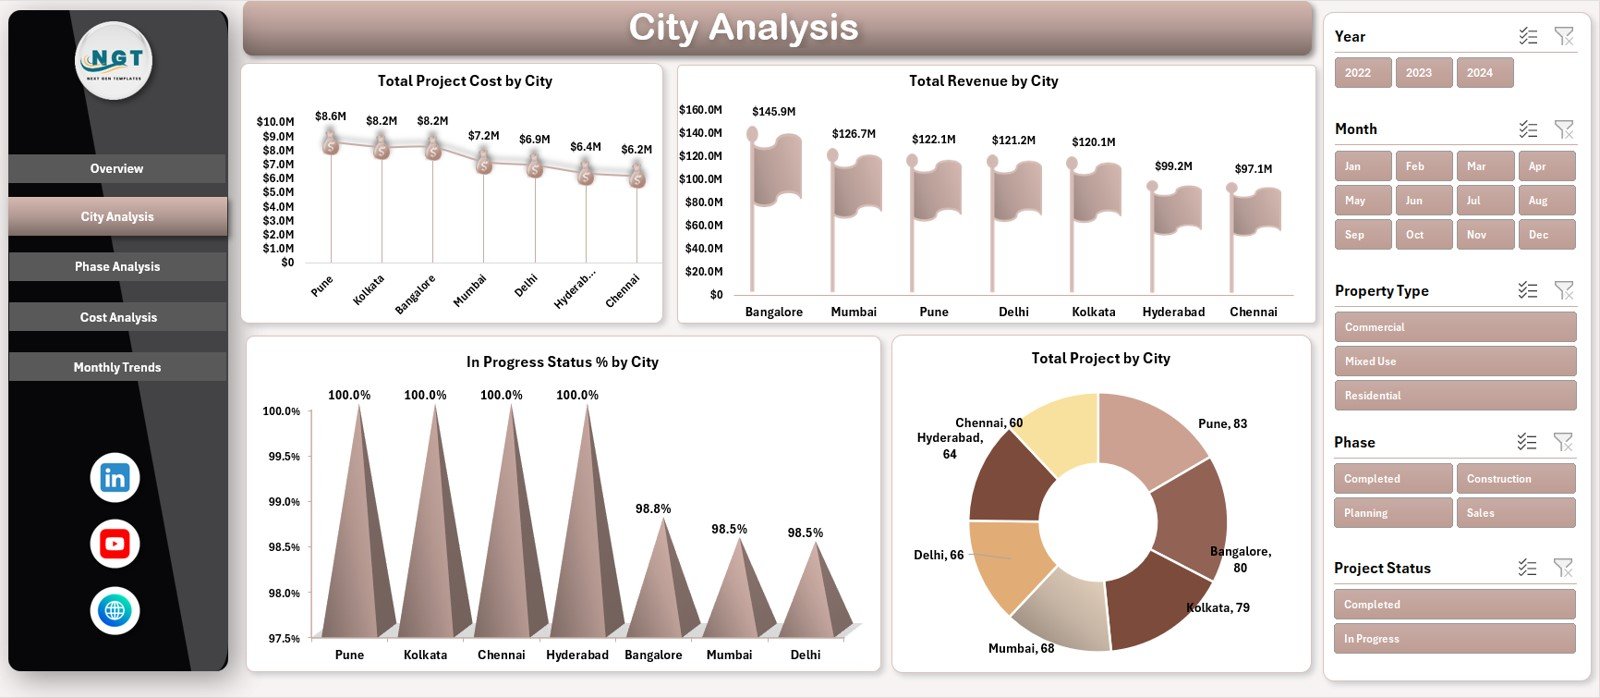
The City Analysis Page focuses on understanding project performance across different cities.
Charts on the City Analysis Page
This page includes four charts:
-
Total Project Cost by City
-
Total Revenue by City
-
In-Progress Status % by City
-
Total Projects by City
Because of this analysis, developers can:
-
Identify high-investment cities
-
Compare revenue contribution by location
-
Monitor project progress across regions
Therefore, location-based strategy becomes more effective.
Click to Purchases Real Estate Development Dashboard in Excel
3. Phase Analysis Page – Project Lifecycle Evaluation
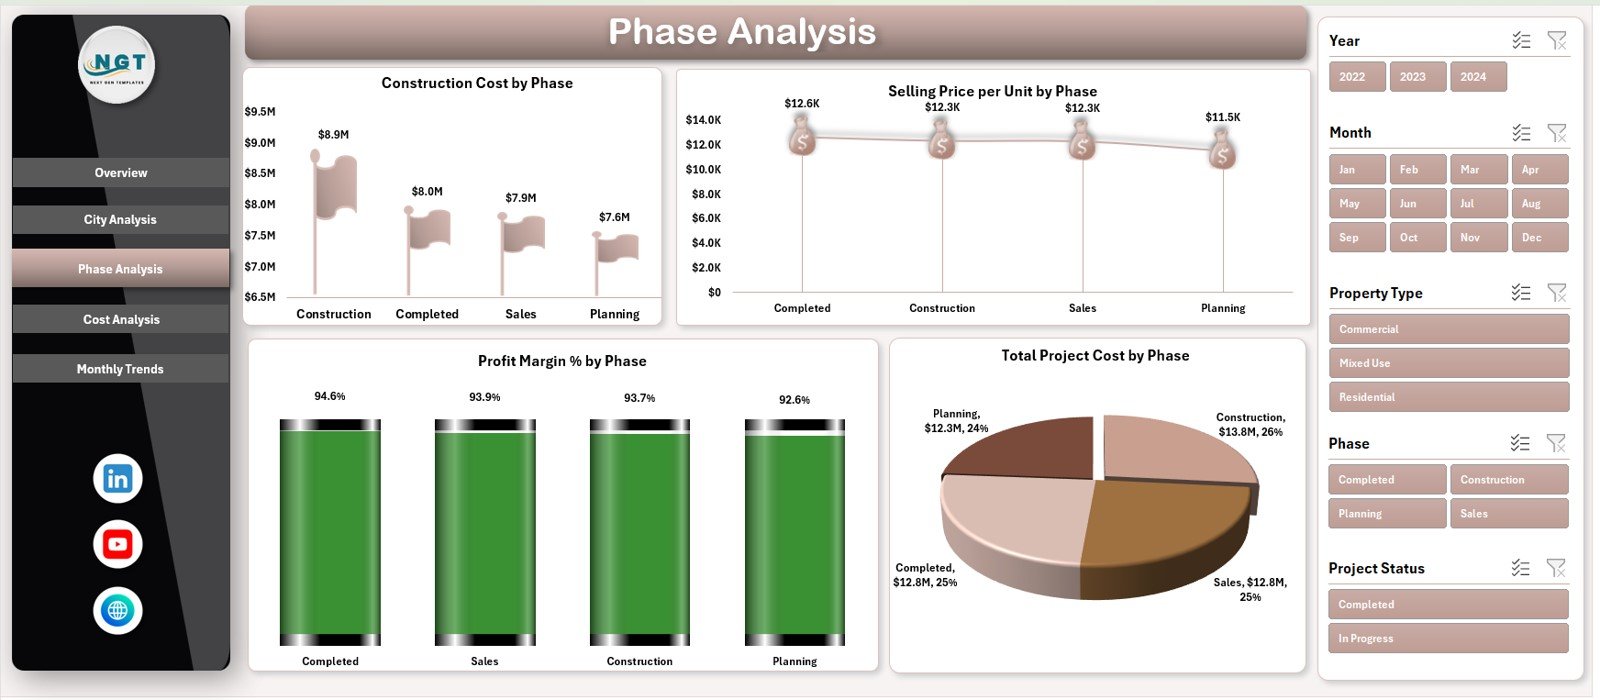
The Phase Analysis Page evaluates performance across different development phases.
Charts on the Phase Analysis Page
This page includes four charts:
-
Construction Cost by Phase
-
Selling Price per Unit by Phase
-
Profit Margin % by Phase
-
Total Project Cost by Phase
With this page, teams can:
-
Detect cost-heavy phases
-
Understand pricing variations
-
Improve margin planning across phases
As a result, phase-level decisions become more informed.
4. Cost Analysis Page – Detailed Cost Breakdown
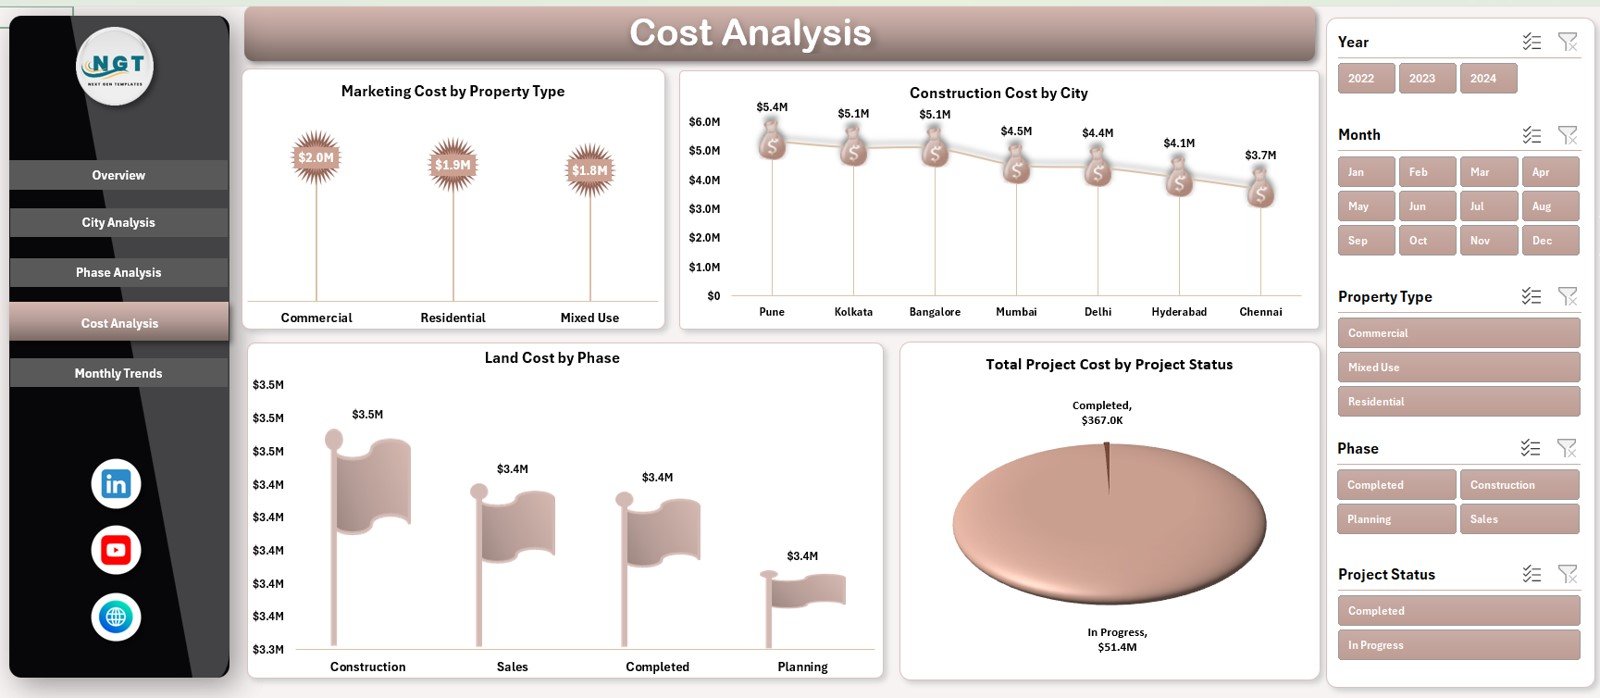
The Cost Analysis Page provides deep insights into cost structure.
Charts on the Cost Analysis Page
This page includes four charts:
-
Marketing Cost by Property Type
-
Construction Cost by City
-
Land Cost by Phase
-
Total Project Cost by Project Status
Because of this breakdown, organizations can:
-
Control cost overruns
-
Optimize land and construction expenses
-
Compare costs across project statuses
Therefore, financial discipline improves significantly.
5. Monthly Trends Page – Performance Over Time
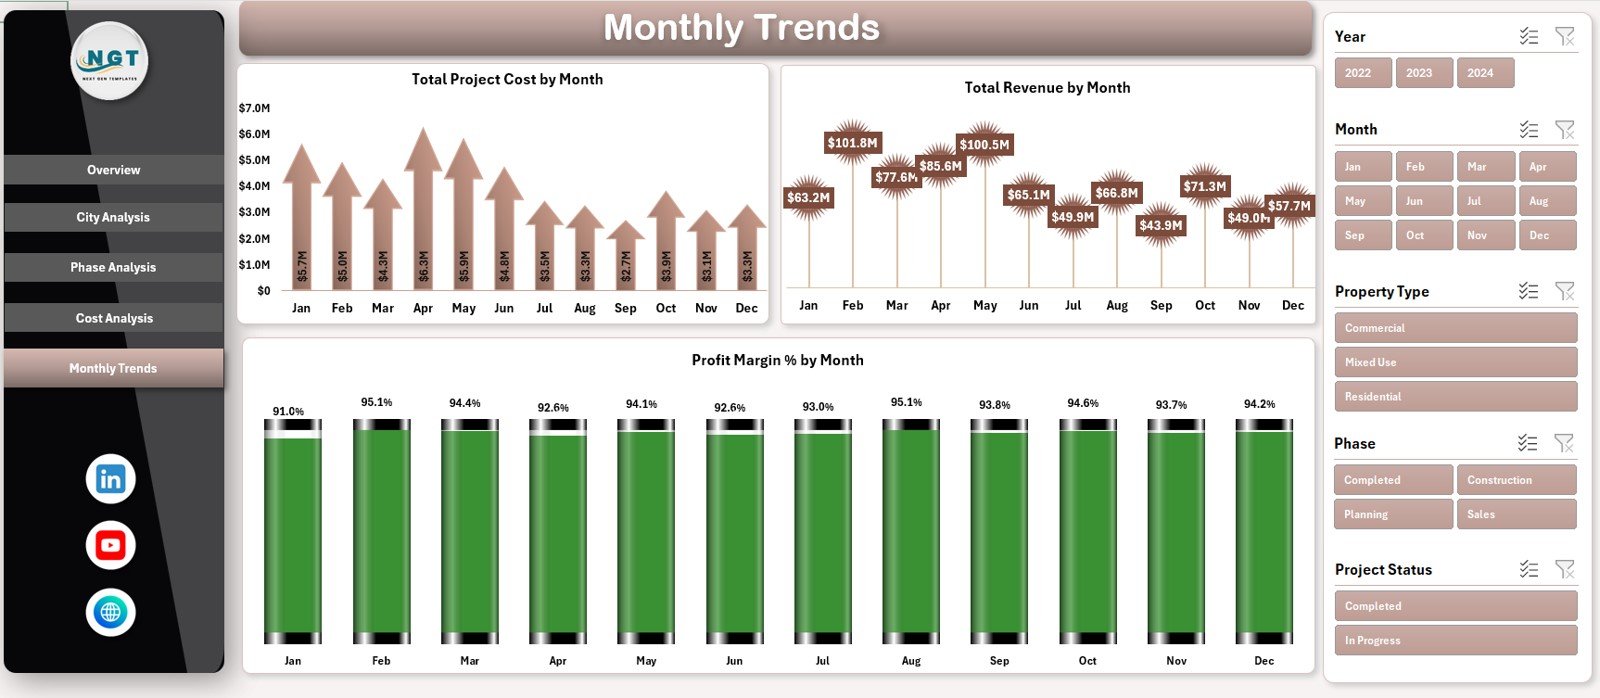
The Monthly Trends Page tracks how key metrics change over time.
Charts on the Monthly Trends Page
This page includes three trend charts:
-
Total Project Cost by Month
-
Total Revenue by Month
-
Profit Margin % by Month
These trends help stakeholders:
-
Identify seasonal patterns
-
Monitor revenue growth
-
Forecast profitability
As a result, long-term planning becomes more accurate.
What KPIs Can Be Tracked in a Real Estate Development Dashboard?
A Real Estate Development Dashboard in Excel can track KPIs such as:
-
Total Project Cost
-
Marketing Cost
-
Construction Cost
-
Land Cost
-
Total Revenue
-
Profit Margin %
-
Project Status
-
Risk Level
-
Selling Price per Unit
Because the dashboard remains flexible, teams can add more KPIs easily.
Click to Purchases Real Estate Development Dashboard in Excel
Advantages of Real Estate Development Dashboard in Excel
Using a Real Estate Development Dashboard in Excel offers several benefits.
Key Advantages
-
✅ Centralized real estate project reporting
-
✅ Clear visibility into cost and revenue
-
✅ Risk and phase-level analysis
-
✅ Location-based performance insights
-
✅ Trend-based financial monitoring
-
✅ No dependency on costly BI tools
-
✅ Easy customization in Excel
As a result, developers gain control, clarity, and confidence.
How Does This Dashboard Improve Decision-Making?
This dashboard turns complex project data into actionable insights. For example:
-
If costs rise in a city, managers can review contracts
-
If profit margins fall in a phase, teams can optimize pricing
-
If risk levels increase, leadership can reassess timelines
Therefore, decisions become proactive and data-driven.
Common Challenges Without a Real Estate Dashboard
Without a structured dashboard, teams often face:
-
Cost overruns
-
Delayed reporting
-
Limited project visibility
-
Poor risk assessment
-
Difficulty tracking profitability
A Real Estate Development Dashboard in Excel addresses these challenges effectively.
Best Practices for the Real Estate Development Dashboard in Excel
To get maximum value, follow these best practices:
Best Practices
-
Maintain accurate and timely data in the Data Sheet
-
Standardize project phases and statuses
-
Review dashboards monthly with stakeholders
-
Focus on profit margin and risk indicators
-
Use trend analysis for forecasting
-
Keep KPIs aligned with business goals
By following these practices, organizations ensure long-term success.
Click to Purchases Real Estate Development Dashboard in Excel
Who Can Use a Real Estate Development Dashboard in Excel?
This dashboard is ideal for:
-
Real Estate Developers
-
Project Managers
-
Finance Teams
-
Investment Analysts
-
Business Owners
-
Senior Leadership
Because Excel is widely used, adoption remains simple.
Why Choose Excel for Real Estate Development Dashboards?
Excel offers flexibility, familiarity, and affordability. Moreover, it supports:
-
Pivot-based analysis
-
Interactive slicers
-
Conditional formatting
-
Easy sharing
-
Offline access
Therefore, Excel remains a reliable platform for real estate analytics.
Conclusion
A Real Estate Development Dashboard in Excel is more than a reporting tool. It is a strategic project management and financial control system. It helps track costs, revenues, risks, and profitability across projects, cities, and phases. Moreover, it enables developers to identify issues early and maximize returns.
By using a well-structured 5-page Excel dashboard with navigation and trends, organizations can move from fragmented reporting to data-driven real estate development. When implemented correctly, this dashboard becomes a critical asset for sustainable growth.
Frequently Asked Questions (FAQs)
What is the main purpose of a Real Estate Development Dashboard in Excel?
The main purpose is to track project costs, revenues, risks, and profitability in one centralized dashboard.
Does this dashboard support monthly trend analysis?
Yes, the Monthly Trends page shows cost, revenue, and profit trends by month.
Can users customize KPIs in this dashboard?
Yes, KPIs and charts can be customized easily using Excel.
Is this dashboard suitable for multiple cities and projects?
Yes, it is designed to handle multiple projects across different cities.
Does this dashboard require VBA or macros?
No, it works using standard Excel features.
How often should the data be updated?
Ideally, data should be updated monthly or whenever new project data becomes available.
Can investors use this dashboard for performance review?
Yes, the dashboard provides investor-ready insights into cost, revenue, and profit.
Click to Purchases Real Estate Development Dashboard in Excel
Visit our YouTube channel to learn step-by-step video tutorials