The real estate industry runs on complex data—project timelines, budgets, construction costs, occupancy rates, and investment returns. Managing this data manually can lead to inefficiencies, delayed decisions, and missed opportunities. To stay competitive, developers and investors need a reliable way to measure and visualize key performance indicators (KPIs) in real time.
That’s where the Real Estate Development KPI Dashboard in Power BI comes in. This dynamic and interactive tool provides a single platform for tracking, analyzing, and improving performance across all stages of property development.
Built using Power BI and powered by an Excel data source, this dashboard helps real-estate professionals make data-driven decisions faster and more accurately than ever before.
Click to Purchases Real Estate Development KPI Dashboard in Power BI
What Is a Real Estate Development KPI Dashboard in Power BI?
A Real Estate Development KPI Dashboard is a performance-tracking tool that brings together all essential KPIs for construction, investment, and property development.
It connects to Excel data files and transforms raw figures into insightful charts and visuals. You can monitor monthly and yearly progress, analyze target vs actual performance, and identify trends that affect profitability.
This dashboard is designed to help real-estate developers, project managers, and investors evaluate critical metrics such as cost variance, project completion rate, sales performance, and return on investment—all within a visually appealing, interactive environment.
Click to Purchases Real Estate Development KPI Dashboard in Power BI
Key Features of the Real Estate Development KPI Dashboard in Power BI
The dashboard includes three pages in the Power BI file, each serving a unique purpose for analysis and reporting.
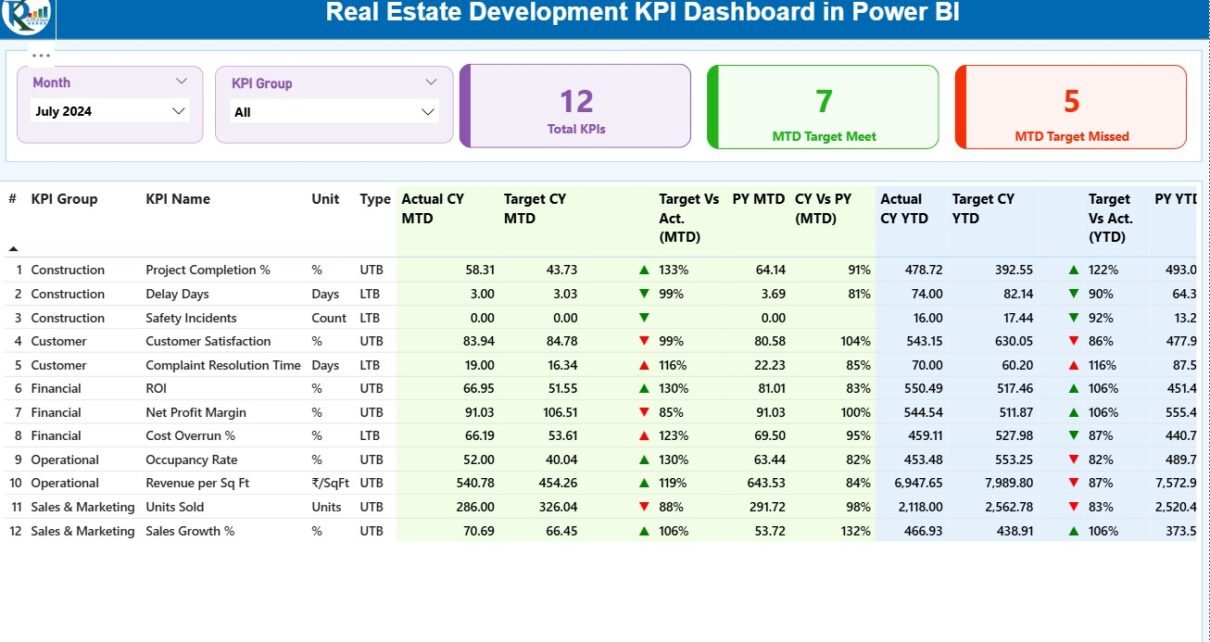
1️⃣ Summary Page
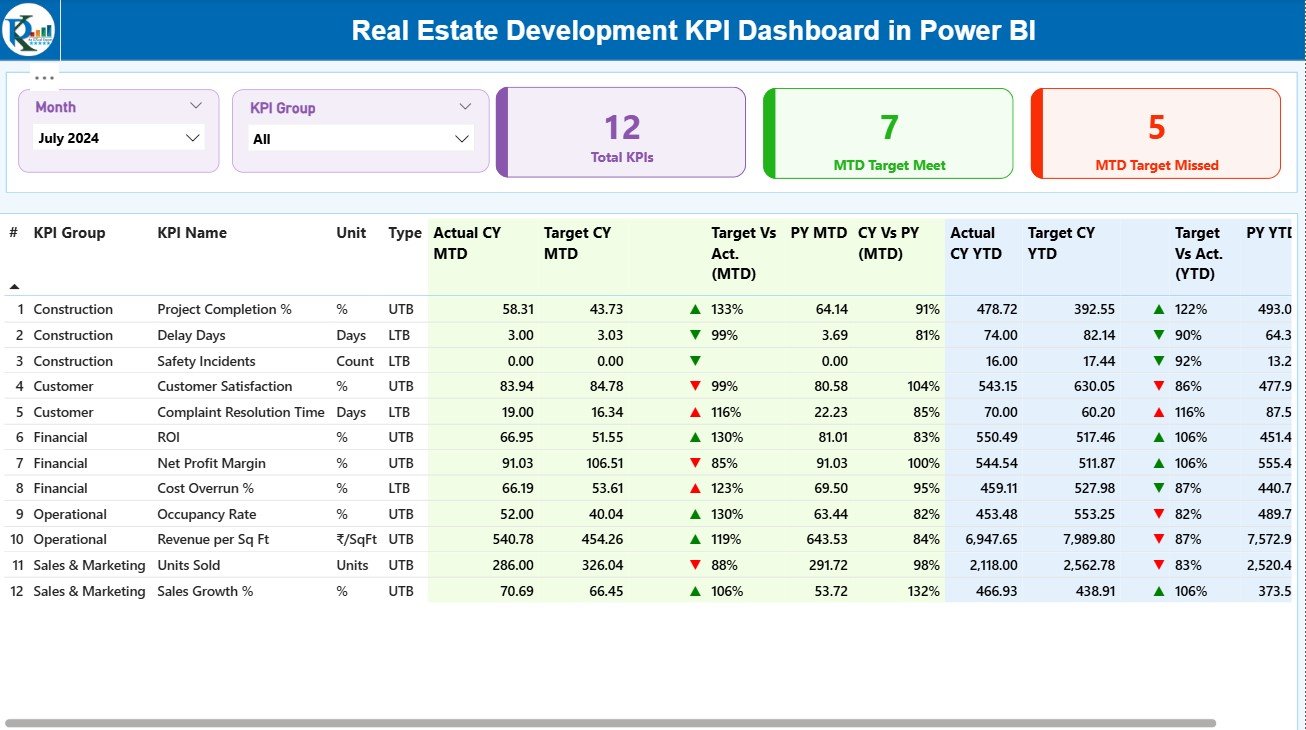
The Summary Page is the main landing area—the performance overview of your entire real-estate portfolio.
Key Highlights:
-
Slicers for Month and KPI Group: Filter data dynamically to view performance for specific timeframes or categories.
-
Three Cards on Top:
-
Total KPIs Count: Displays how many KPIs are being tracked.
-
MTD Target Met Count: Shows how many KPIs achieved their Month-to-Date (MTD) targets.
-
MTD Target Missed Count: Displays KPIs that fell short of their targets.
-
-
Detailed KPI Table:
-
KPI Number: Sequential identification number.
-
KPI Group: Category or domain (e.g., Construction, Sales, Finance).
-
KPI Name: Name of each performance indicator.
-
Unit: Measurement unit—percentage, currency, count, etc.
-
Type: LTB (Lower the Better) or UTB (Upper the Better).
-
Actual CY MTD: Current year’s Month-to-Date actual performance.
-
Target CY MTD: Current year’s MTD target.
-
MTD Icon: Visual arrows (▲ green / ▼ red) show KPI status.
-
Target vs Actual (MTD): Ratio of actual to target performance.
-
PY MTD: Previous year’s MTD numbers.
-
CY vs PY (MTD): Comparison between current and previous year MTD.
-
Actual CY YTD: Current year’s Year-to-Date actual.
-
Target CY YTD: Current year’s YTD target.
-
YTD Icon: Red or green arrow for YTD target status.
-
Target vs Actual (YTD): YTD ratio of actual to target.
-
PY YTD: Previous year’s YTD.
-
CY vs PY (YTD): Comparison between current and previous YTD results.
-
This structured layout provides a complete, real-time picture of how your real-estate projects are performing.
2️⃣ KPI Trend Page
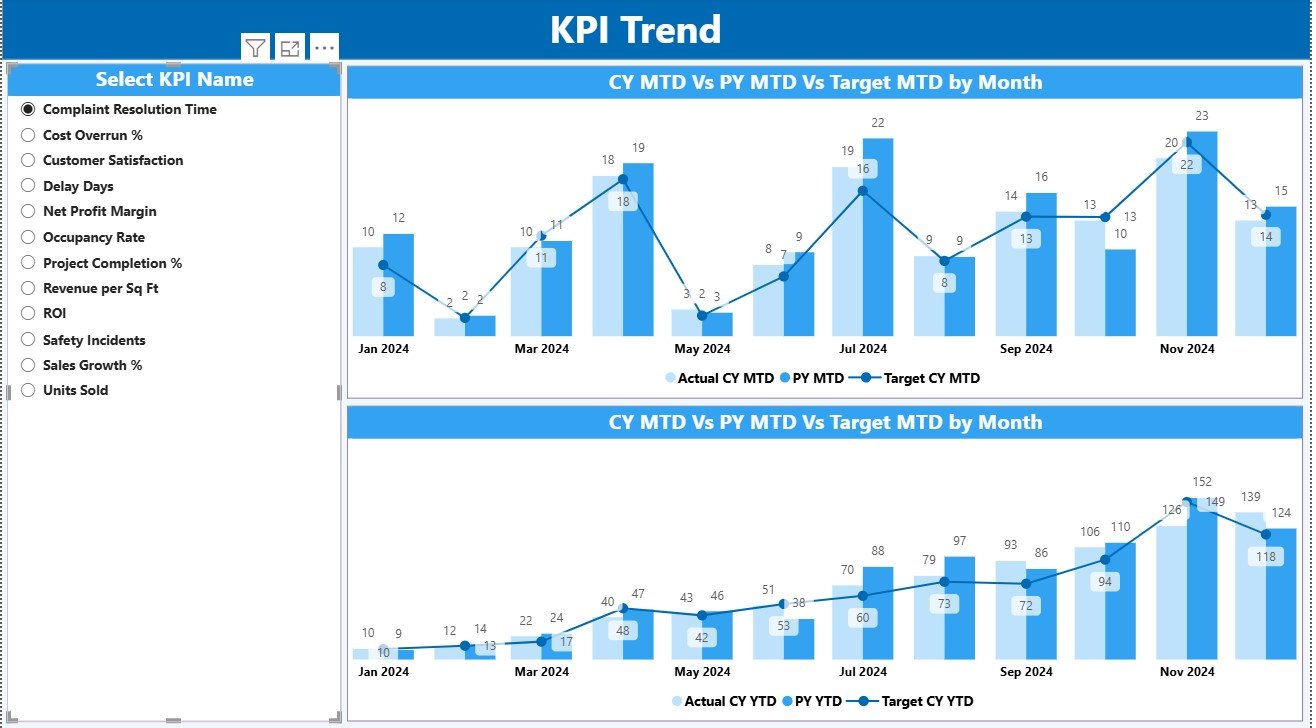
The KPI Trend Page focuses on time-series analysis for detailed performance evaluation.
Features Include:
-
Left-Side Slicer: Select any KPI name to view its trend.
-
Two Combo Charts:
-
One chart shows MTD performance for Actual, Target, and Previous Year.
-
The other chart shows YTD performance across the same three metrics.
-
-
Dynamic Visualization: Each selection automatically updates the visuals.
This page helps identify whether a KPI is improving, stable, or declining over time. You can clearly visualize the progress of construction milestones, sales targets, or investment returns.
3️⃣ KPI Definition Page
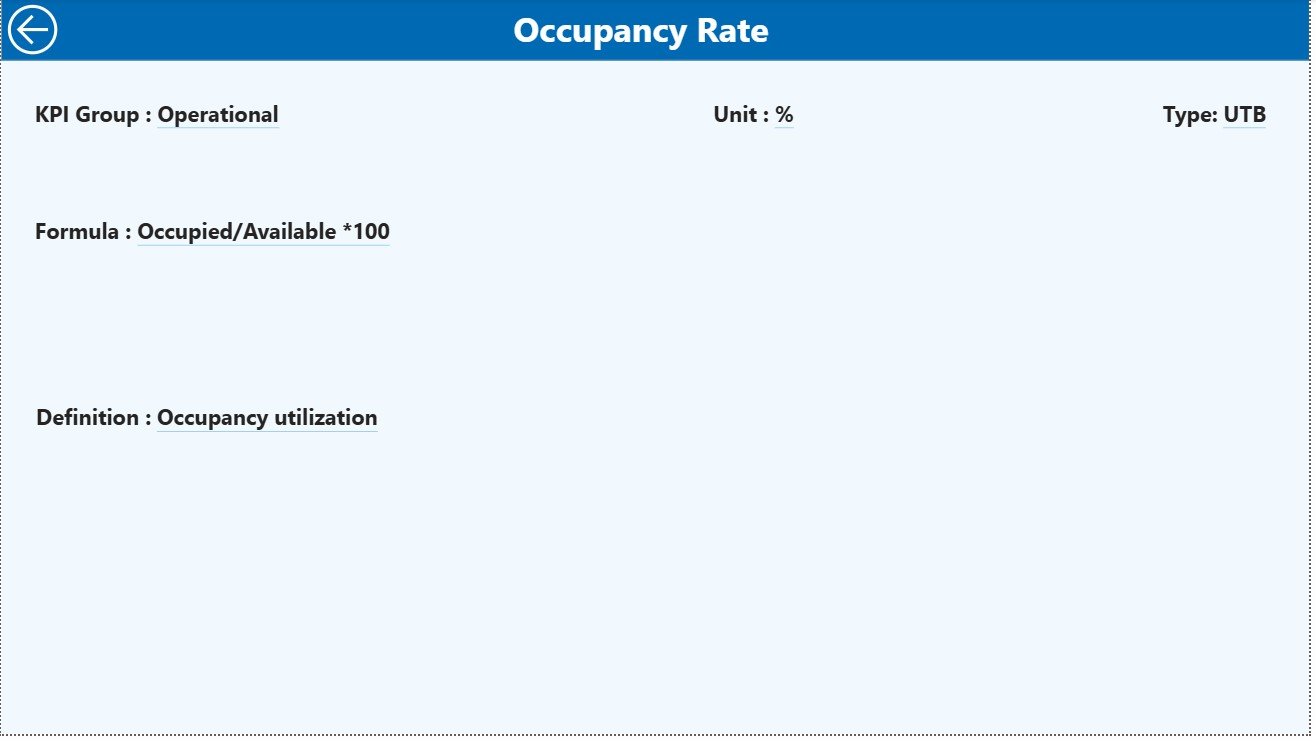
The KPI Definition Page acts as a hidden drill-through section. You can right-click on any KPI in the summary table to view its formula and definition.
Features:
-
Displays KPI formula, calculation logic, and definitions.
-
Contains a “Back” button on the top-left to return to the Summary Page.
This feature improves transparency and ensures that every team member interprets KPIs consistently.
Excel Data Source for Power BI Dashboard
The dashboard is connected to an Excel file that acts as the source data. The Excel workbook contains three worksheet tabs, each designed for a specific purpose:
1️⃣ Input_Actual Sheet Tab
-
Fill actual KPI data.
-
Include columns for KPI Name, Month (first date of month), MTD number, and YTD number.
2️⃣ Input_Target Sheet Tab
-
Fill target values for each KPI.
-
Use the same column structure as the Actual sheet for easy mapping.
3️⃣ KPI Definition Sheet Tab
-
Define each KPI by entering:
-
KPI Number
-
KPI Group
-
KPI Name
-
Unit
-
Formula
-
Definition
-
Type (LTB / UTB)
-
Once the Excel file is updated, Power BI automatically refreshes the visuals with the latest data.
Why Real Estate Developers Need This Dashboard
In real-estate development, performance monitoring is essential. Without structured tracking, it’s easy to lose visibility into project budgets, sales progress, or operational efficiency.
A Power BI KPI Dashboard helps developers and investors move from intuition to insight. It provides real-time visibility into how projects perform financially, operationally, and strategically.
Click to Purchases Real Estate Development KPI Dashboard in Power BI
Key Benefits
-
Centralized Data: One dashboard for all performance metrics.
-
Visual Insights: Color-coded indicators highlight success and shortfalls instantly.
-
Accurate Decision-Making: Reliable data reduces risks and prevents costly delays.
-
Time Efficiency: Automated updates save hours of manual reporting.
-
Collaboration: Teams across finance, sales, and construction work from the same data source.
Advantages of the Real Estate Development KPI Dashboard in Power BI
1. Real-Time Performance Tracking
Monitor monthly and yearly progress using dynamic MTD and YTD metrics.
2. Clear Visualization
Charts and icons make complex numbers easy to interpret at a glance.
3. Enhanced Accuracy
Automated calculations eliminate manual errors in reporting.
4. Data Integration
Connect multiple Excel files or databases easily using Power BI.
5. Customization Flexibility
Add new KPIs or modify visuals based on business needs.
6. Drill-Through Insights
Access detailed KPI definitions without cluttering your main dashboard.
7. Improved Decision-Making
Instant access to accurate insights helps executives make faster, more confident choices.
How to Use the Dashboard Effectively
Step 1: Prepare Data in Excel
Fill in the Actual, Target, and KPI Definition sheets with accurate information.
Step 2: Load Data into Power BI
Connect your Excel file to Power BI and enable automatic refresh.
Step 3: Explore the Summary Page
Use the slicers to filter by month or KPI group and review overall performance.
Step 4: Analyze KPI Trends
Use the KPI Trend Page to visualize short-term and long-term movements.
Step 5: Drill Through for Details
Right-click on any KPI to see its definition, formula, and type.
By following these steps, you can gain a complete view of project performance from planning to completion.
Best Practices for the Real Estate Development KPI Dashboard
✅ Keep KPI Definitions Clear: Ensure every stakeholder understands how KPIs are calculated.
✅ Update Data Regularly: Refresh Excel data monthly for accurate reporting.
✅ Set Realistic Targets: Establish achievable MTD and YTD goals.
✅ Use Conditional Formatting Wisely: Let visuals highlight what matters most.
✅ Benchmark Against Previous Year: Compare CY vs PY for growth tracking.
✅ Ensure Data Accuracy: Validate Excel entries before Power BI refresh.
✅ Secure Your Files: Protect sensitive property and investment data.
How This Dashboard Transforms Real Estate Analysis
The dashboard brings multiple departments—finance, construction, marketing—onto a single analytical platform.
You can answer critical questions instantly:
-
Are projects progressing on schedule and within budget?
-
Which developments are yielding the highest ROI?
-
Are we meeting sales and occupancy goals month over month?
With Power BI, you move from static reports to interactive storytelling—transforming data into actionable insights.
Integration and Scalability
The dashboard integrates seamlessly with:
-
Excel workbooks
-
SQL Server or SharePoint data sources
-
Online services like OneDrive or Power BI Service
You can also:
-
Automate updates via Power Automate
-
Share reports securely with stakeholders
-
Scale the dashboard to track multiple real-estate projects simultaneously
Conclusion
The Real Estate Development KPI Dashboard in Power BI is a game-changing solution for developers, investors, and managers who want complete visibility into project performance.
By integrating Excel data with Power BI’s powerful analytics, you can track MTD and YTD results, visualize KPI trends, and make faster, smarter business decisions.
Whether you’re monitoring construction progress, evaluating sales performance, or measuring ROI, this dashboard empowers you to transform raw data into actionable intelligence.
Start using it today—and elevate your real-estate development strategy with the power of data visualization. 🏗️📊
Click to Purchases Real Estate Development KPI Dashboard in Power BI
Frequently Asked Questions (FAQs)
1. What is a Real Estate Development KPI Dashboard in Power BI?
It’s an interactive Power BI tool that visualizes key performance indicators related to property development, construction, and investment.
2. How many KPI pages does this dashboard include?
There are three: Summary, KPI Trend, and KPI Definition (drill-through).
3. What data source does it use?
It uses an Excel file with three worksheets: Actuals, Targets, and KPI Definitions.
4. Do I need Power BI Pro to use it?
You can use Power BI Desktop for local analysis or Power BI Pro for cloud sharing.
5. How often should I update data?
Monthly updates keep your dashboard accurate and relevant.
6. Can I customize the KPIs?
Yes—you can edit, add, or remove KPIs according to your project requirements.
7. Is this suitable for small developers?
Absolutely. It’s scalable for both small and large real-estate projects.
8. What’s the benefit of MTD and YTD tracking?
MTD focuses on short-term monthly performance, while YTD measures cumulative annual progress.
Click to Purchases Real Estate Development KPI Dashboard in Power BI
Visit our YouTube channel to learn step-by-step video tutorials