Real Estate Investment Trusts (REITs) play an essential role in global real estate investing. They allow individuals and institutions to invest in income-generating properties such as commercial buildings, retail outlets, corporate offices, warehouses, data centers, hospitality units, and residential complexes. Because REITs handle large datasets, shifting market conditions, varying rental income, capital appreciation, risk ratings, and occupancy fluctuations, they need a smart way to track all critical performance indicators.
A Real Estate Investment Trusts (REITs) Dashboard in Power BI becomes the perfect solution for this challenge. It transforms raw property and financial data into clean, interactive, visual insights. Moreover, it helps investors, fund managers, analysts, and decision-makers monitor investment status, regional performance, property type behavior, REIT-wise performance, and monthly trends with accuracy and speed.
In this detailed guide, you will explore everything about the REITs Dashboard in Power BI, including its features, structure, advantages, best practices, and common questions asked by real estate investment professionals.
Click to Purchases Real Estate Investment Trusts (REITs) Dashboard in Power BI
What Is a Real Estate Investment Trusts (REITs) Dashboard in Power BI?
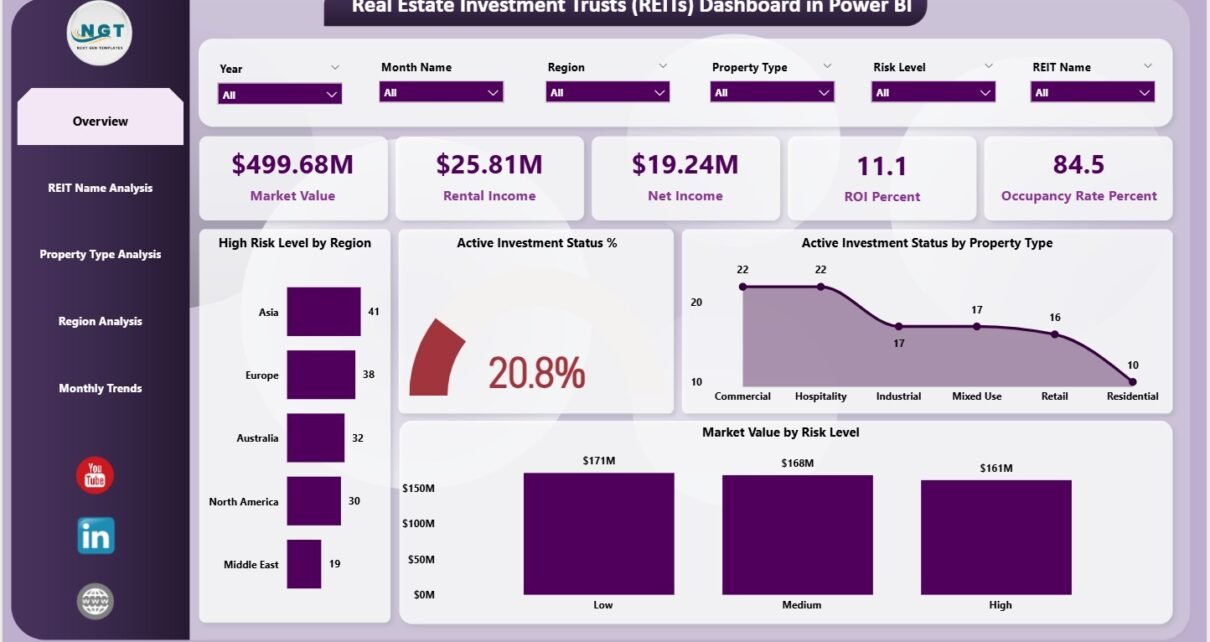
A REITs Dashboard in Power BI is an automated analytical tool that helps users track key performance indicators such as market value, rental income, net income, ROI%, occupancy rate, active investment status, risk levels, and regional performance. Because Power BI connects directly with data sources, the dashboard updates instantly and offers real-time insights.
This dashboard contains five analytical pages:
-
Overview
-
REIT Name Analysis
-
Property Type Analysis
-
Region Analysis
-
Monthly Trends
Each page uses slicers, charts, and KPI cards to make complex REIT data clear and manageable. As a result, stakeholders make faster, smarter decisions with confidence.
Why Do Real Estate Investment Trusts Need a Power BI Dashboard?
The REIT industry handles:
-
Large property portfolios
-
Diverse property categories
-
Multiple regions with varying regulations
-
Dynamic rental income patterns
-
Fluctuating market values
-
Varying occupancy levels
-
Active and pending investment cycles
-
Changes in risk ratings
Manual reporting becomes slow and difficult. A Power BI dashboard solves these problems by providing real-time tracking and data-driven decision-making capabilities.
Some key issues it solves:
-
Delayed financial reporting
-
Inaccurate spreadsheets
-
Poor visibility across regions
-
Difficulty analyzing property performance
-
No quick way to compare REITs
-
Missing insights into monthly trends
Because of this dashboard, teams get the clarity they need to monitor, forecast, and optimize investment outcomes.
Key Features of the Real Estate Investment Trusts (REITs) Dashboard in Power BI
This dashboard includes five powerful pages, each designed to simplify complex investment and performance monitoring.
Click to Purchases Real Estate Investment Trusts (REITs) Dashboard in Power BI
1. Overview Page – Complete Portfolio Visibility
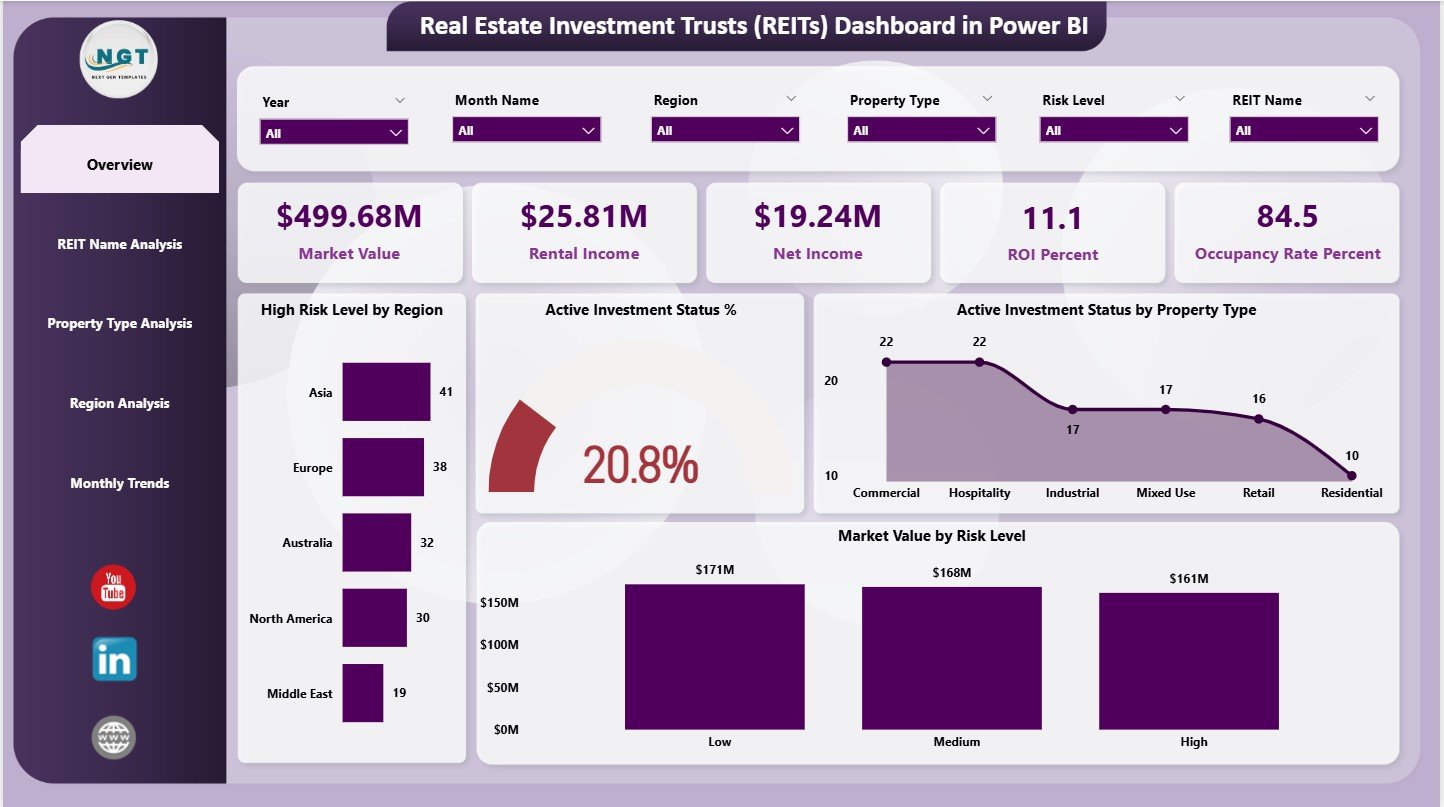
The Overview Page acts as the main page of the REITs Dashboard. It includes slicers on the right side for easy filtering across:
-
Regions
-
Property Types
-
REIT Names
-
Risk Levels
-
Investment Status
These slicers help users isolate specific insights instantly.
KPI Cards on the Overview Page
The dashboard displays five high-level KPI cards:
-
Market Value
-
Rental Income
-
Net Income
-
ROI (%)
-
Occupancy Rate (%)
These cards provide a snapshot of financial performance and property utilization in a single view.
Charts on the Overview Page
The Overview Page contains four analytical charts:
-
High-Risk Level by Region
-
Active Investment Status (%)
-
Active Investment Status by Property Type
-
Market Value by Risk Level
These visuals reveal:
-
Areas with higher investment risk
-
Regions performing better than others
-
Property categories showing strong activity
-
How market value behaves under different risk levels
This page covers everything required for strategic decision-making.
Click to Purchases Real Estate Investment Trusts (REITs) Dashboard in Power BI
2. REIT Name Analysis – Evaluate REIT-wise Performance
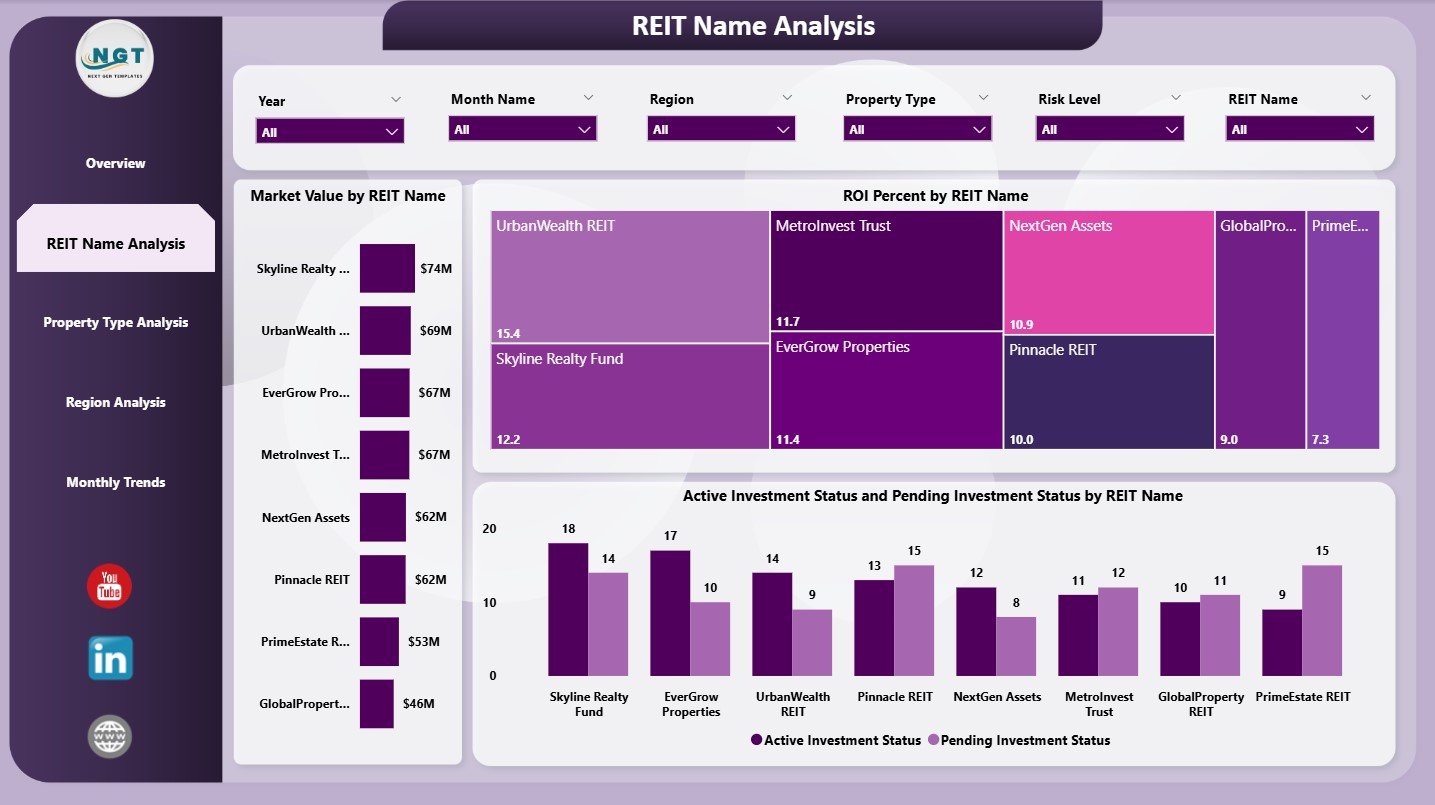
This is the second page of the dashboard. It focuses on REIT-wise insights and includes slicers for filtering.
Charts on the REIT Name Analysis Page
-
Market Value by REIT Name
-
ROI (%) by REIT Name
-
Active & Pending Investment Status by REIT Name
These visuals help users understand:
-
Which REITs hold stronger market value
-
Which ones provide better returns
-
The status of investments (active vs. pending) for each REIT
This page supports portfolio optimization and comparison between REITs across different investment cycles.
3. Property Type Analysis – Compare Property Categories
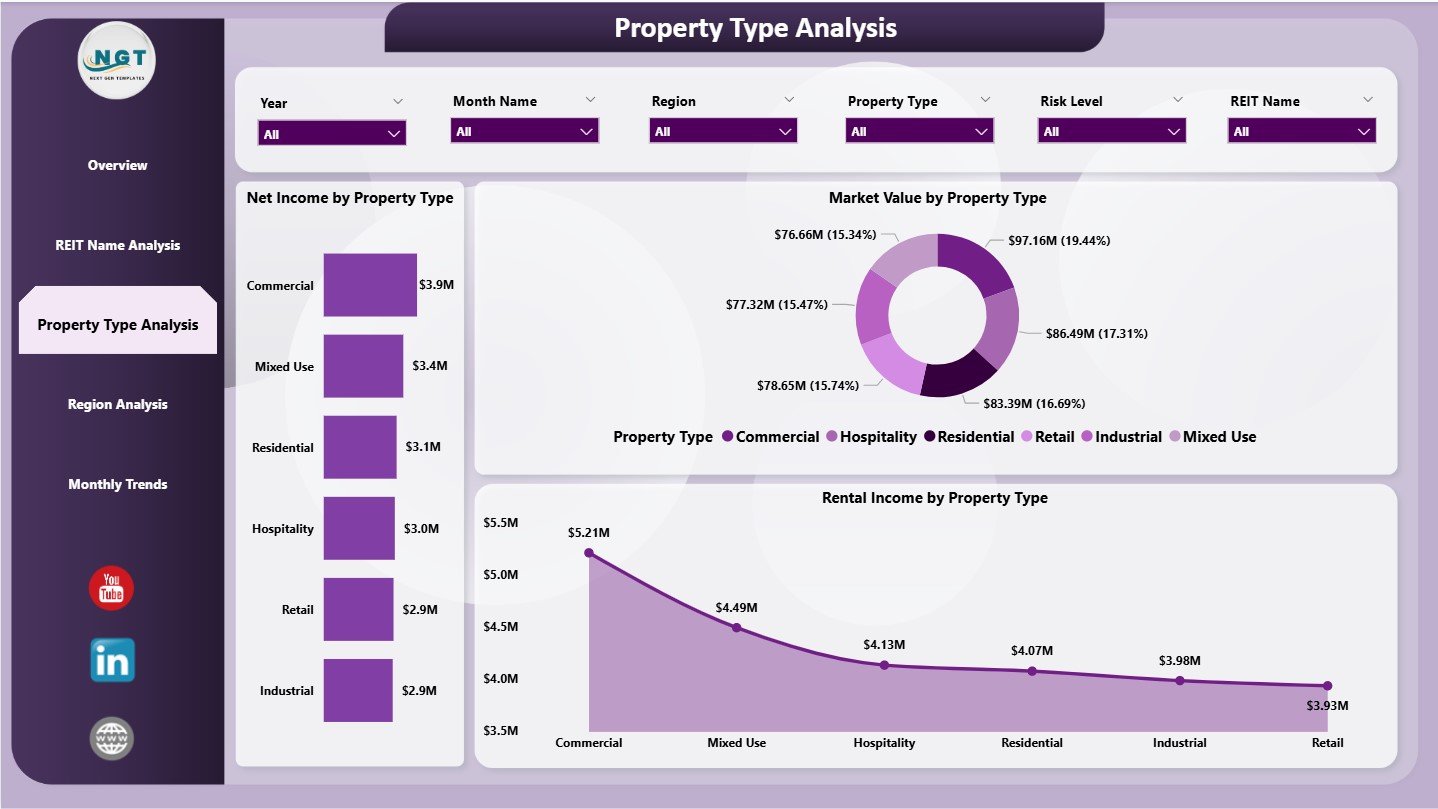
Property performance varies across real estate categories. This page shows category-wise analysis for asset managers and analysts.
Charts on the Property Type Analysis Page
-
Net Income by Property Type
-
Market Value by Property Type
-
Rental Income by Property Type
It clearly reveals:
-
Which property types generate higher rental income
-
Which categories have stronger market value
-
Which types yield higher net income
This is helpful for investment planning and resource allocation.
4. Region Analysis – Monitor Regional Performance
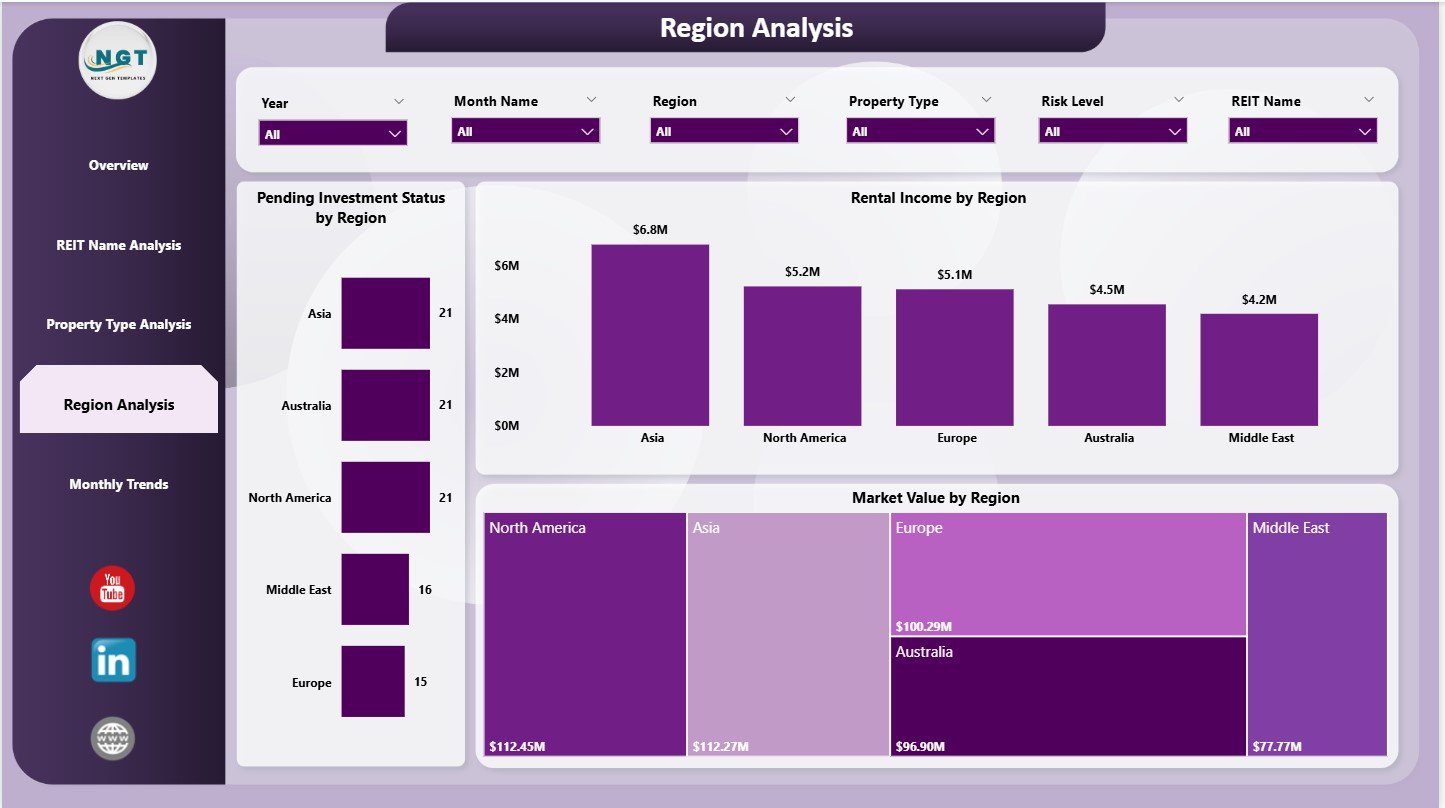
The Region Analysis page evaluates investment performance across geographic areas. It includes slicers for filtering regional insights.
Charts on the Region Analysis Page
-
Pending Investment Status by Region
-
Rental Income by Region
-
Market Value by Region
These charts answer key questions:
-
Which regions delay investment cycles?
-
Where does rental income grow consistently?
-
Which areas show strong capital growth?
Investors use these insights for risk assessment and portfolio diversification.
Click to Purchases Real Estate Investment Trusts (REITs) Dashboard in Power BI
5. Monthly Trends – Understand Time-Based Behavior
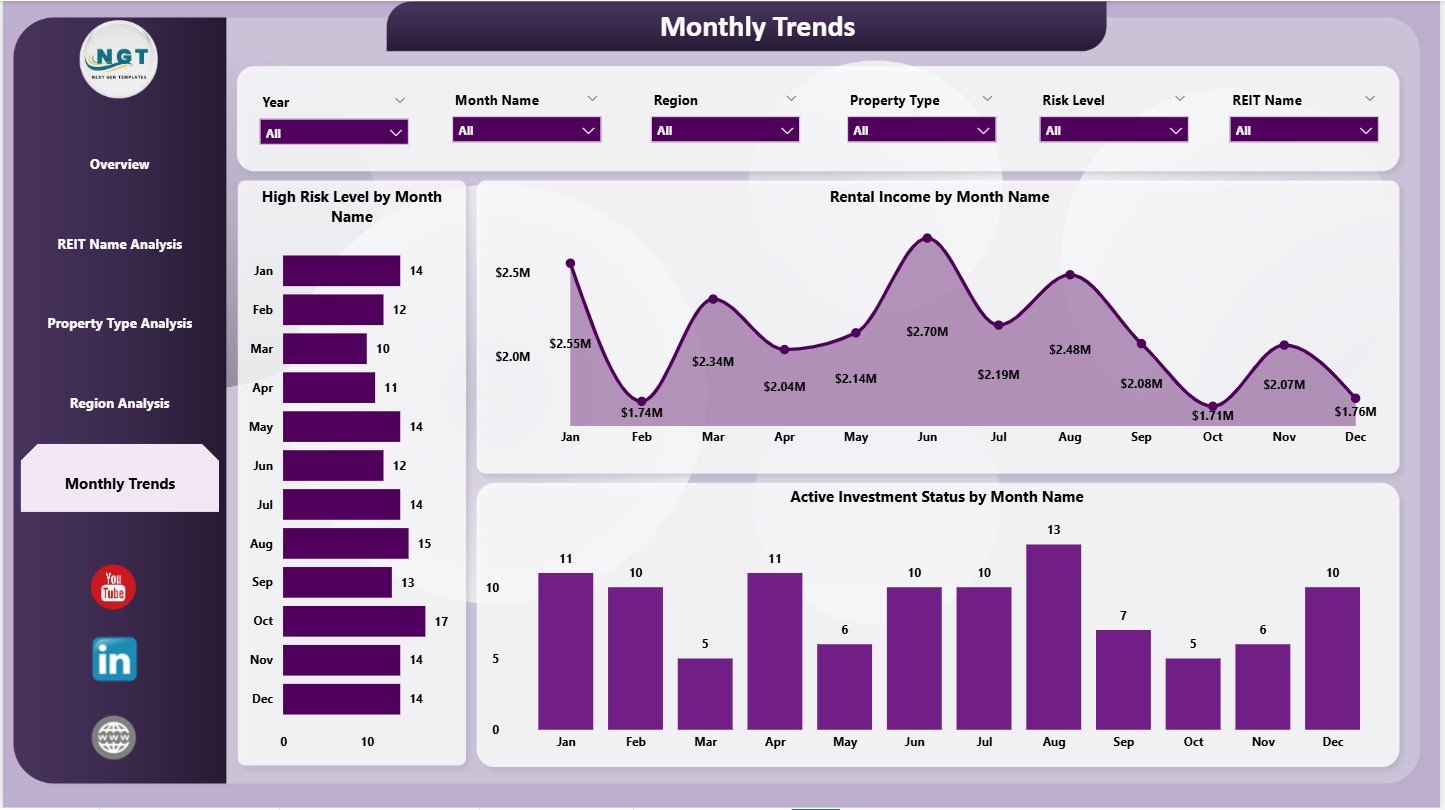
The Monthly Trends page displays time-series performance indicators, helping users understand monthly fluctuations.
Charts on Monthly Trends Page
-
High-Risk Level by Month
-
Rental Income by Month
-
Active Investment Status by Month
These visuals highlight:
-
Seasonal rental variations
-
Rising or falling investment risk
-
Month-wise activity patterns
Trend-based insights support future forecasting and budgeting.
What KPIs Should a REITs Dashboard Track?
A good REIT dashboard measures critical financial, operational, and risk-based KPIs.
Financial KPIs
-
Market Value
-
Rental Income
-
Net Income
-
ROI (%)
-
Operating Expenses
-
Capital Expenditure
Operational KPIs
-
Occupancy Rate (%)
-
Property Utilization
-
Maintenance Costs
-
Vacancy Periods
Risk KPIs
-
High Risk Level (%)
-
Pending Investments
-
Regional Risk Exposure
Category-Based KPIs
-
Property Type Performance
-
REIT Name Performance
-
Regional Performance
-
Monthly Trends
These KPIs create a complete view of real estate investment performance.
Click to Purchases Real Estate Investment Trusts (REITs) Dashboard in Power BI
Advantages of the Real Estate Investment Trusts Dashboard in Power BI
This dashboard brings several powerful advantages to REIT analysts and investment managers.
1. You Get Real-Time Financial Insights
Users track rental income, market value, and net income instantly without reliance on manual reports.
2. You Understand Risk Faster
Charts showing high-risk regions and pending investments help teams act quickly.
3. You Improve ROI Tracking
Power BI calculates ROI (%) automatically, helping stakeholders measure investment performance clearly.
4. You Compare REITs, Property Types, and Regions Easily
The Dashboard breaks performance down into multiple dimensions:
-
REIT name
-
Property type
-
Geographic region
-
Investment status
This helps investors decide where to allocate funds.
5. You Improve Portfolio Forecasting
Monthly trend charts reveal behavior patterns, supporting forecasting and planning.
6. You Reduce Reporting Time
Power BI eliminates manual data compilation and creates automated visual reporting.
7. You Enhance Strategic Decision-Making
Clear visuals allow investors to:
-
Increase investments in profitable areas
-
Reduce exposure in high-risk regions
-
Strengthen property category decisions
Overall, this dashboard supports smarter REIT management.
Click to Purchases Real Estate Investment Trusts (REITs) Dashboard in Power BI
Best Practices for Using a REIT Dashboard in Power BI
To get maximum value from the dashboard, follow these practices:
1. Update Source Data Regularly
Real-time data helps maintain dashboard accuracy.
2. Use Consistent Data Formats
Ensure rental income, dates, property types, and regions follow a consistent pattern.
3. Review Monthly Trends Frequently
Trend charts help with forecasting and planning investments.
4. Monitor High-Risk Areas Closely
High-risk regions require immediate attention.
5. Compare Property Types Before Investing
Category-wise insights help optimize investment decisions.
6. Train Teams to Use the Dashboard
Knowledgeable users make better investment choices.
7. Use Slicers Effectively
Filters help isolate insights and avoid confusion.
Conclusion
A Real Estate Investment Trusts (REITs) Dashboard in Power BI provides real-time insights into rental income, market value, ROI, occupancy levels, risk distribution, regional differences, and property category performance. Because this dashboard organizes the entire REIT data ecosystem, decision-makers get complete clarity and control.
It simplifies KPI tracking, strengthens forecasting, improves risk management, and empowers investment teams to take smarter actions. In an industry where financial transparency and analytical accuracy matter most, this dashboard becomes an essential tool for every REIT manager.
Click to Purchases Real Estate Investment Trusts (REITs) Dashboard in Power BI
Frequently Asked Questions (FAQs)
1. Can I customize the REIT dashboard?
Yes, KPIs, charts, and slicers can be customized based on your REIT operations.
2. Do I need advanced Power BI knowledge?
No, basic Power BI skills are enough since the dashboard is ready to use.
3. Can this dashboard track multiple REITs at once?
Yes, the REIT Name Analysis page monitors performance for each REIT separately.
4. How often should I update the dashboard?
Most teams update it monthly or weekly depending on investment volume.
5. Can I compare property types and regions?
Yes, the Property Type Analysis and Region Analysis pages provide clear comparisons.
Click to Purchases Real Estate Investment Trusts (REITs) Dashboard in Power BI
Visit our YouTube channel to learn step-by-step video tutorials