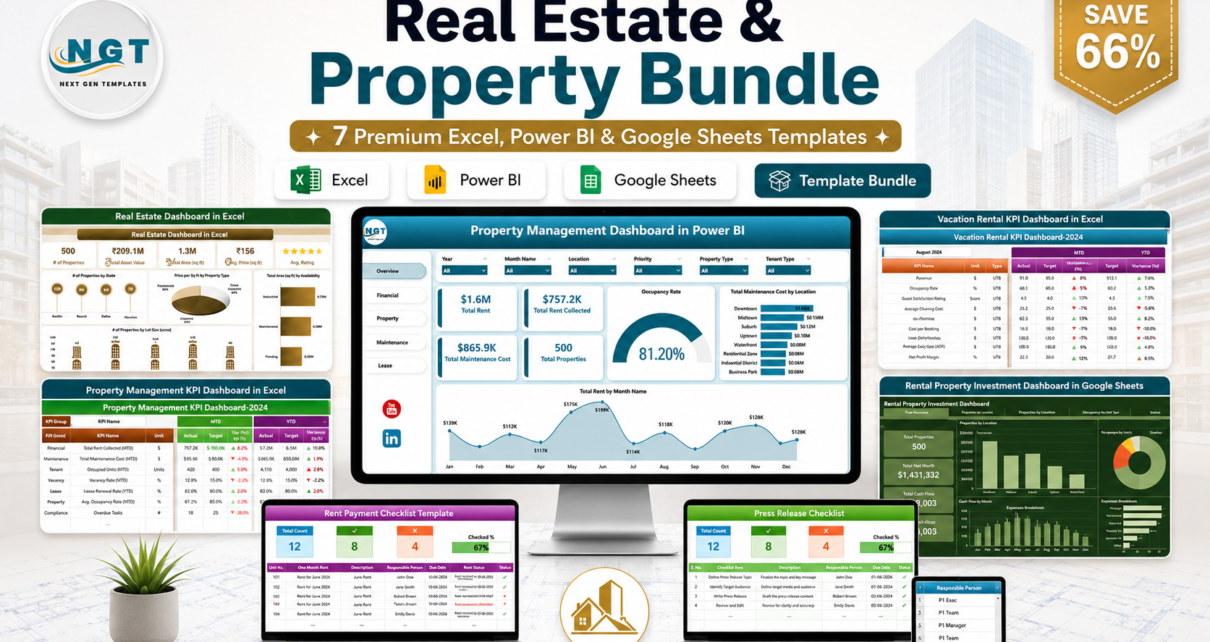
If you manage, rent, or invest in property, you have probably pieced together your reporting from a dozen disconnected spreadsheets. The Real Estate & Property Bundle replaces all of that with one curated kit: 7 premium templates across Excel, Power BI, and Google Sheets that cover the entire property lifecycle — portfolio analytics, property management KPIs, vacation rentals, investor cash-flow, and the day-to-day operational checklists that keep everything running. Buy them together for $39.99 instead of $118.93 individually, and save 66% ($78.94).
This bundle pulls together the most popular real estate templates from our Excel dashboards, Power BI dashboards, and Google Sheets dashboards into a single download, so every member of your team can work in the tool they already prefer.
Real Estate & Property Bundle — 7 Templates, One Price
Individual price $118.93 → $39.99 (Save 66%)
Key Features of the Real Estate & Property Bundle
Every template in the bundle is built on the same plug-and-play philosophy: replace the sample data with your own and the dashboards, KPIs, and charts update automatically. Here is what you get across the seven files.
Full property lifecycle coverage. From listing and portfolio tracking through rent collection, maintenance, lease renewals, and investor returns, the bundle addresses every stage of property management rather than a single slice.
Three platforms, one purchase. You receive native Excel, Power BI, and Google Sheets versions. Analysts who live in Power BI, landlords who prefer Excel, and teams that collaborate in Google Sheets are all covered without buying separate tools.
Rent and collection tracking. Compare total rent versus rent collected by building, tenant type, and property manager so under-collected units and lagging managers are obvious at a glance.
Occupancy and vacancy analytics. Monitor occupancy rate, vacant units, and under-maintenance properties broken down by location and property type to prioritize leasing effort.
Maintenance cost control. Break repair spend down by priority, maintenance type, and property manager to keep budgets predictable and contractors accountable.
Vacation rental KPIs. A dedicated dashboard tracks ADR, RevPAR, booking sources, seasonal trends, and guest satisfaction for short-term rental operators.
Investor cash-flow analysis. Rental income, expenses, net income, and expense ratios are summarized across your entire portfolio for fast investment decisions.
What’s Included in the Bundle
Here is a closer look at each of the seven templates and what it does.
1. Real Estate Dashboard in Excel
A six-tab analytical dashboard that tracks number of properties, total cost, total area, price per square foot, and average rating, with breakdowns by property type, region, and client type plus a monthly trend sheet. Ideal for agents, managers, and investors who want a portfolio command center.

Real Estate Dashboard in Excel
View the Real Estate Dashboard in Excel →
2. Property Management Dashboard in Power BI
Five interactive report pages — Overview, Financial, Property, Maintenance, and Lease — with 15+ visuals, five executive KPI cards, and cross-page slicers for Location, Property Manager, and Tenant Type. Setup takes under ten minutes in free Power BI Desktop.Real Estate & Property Bundle
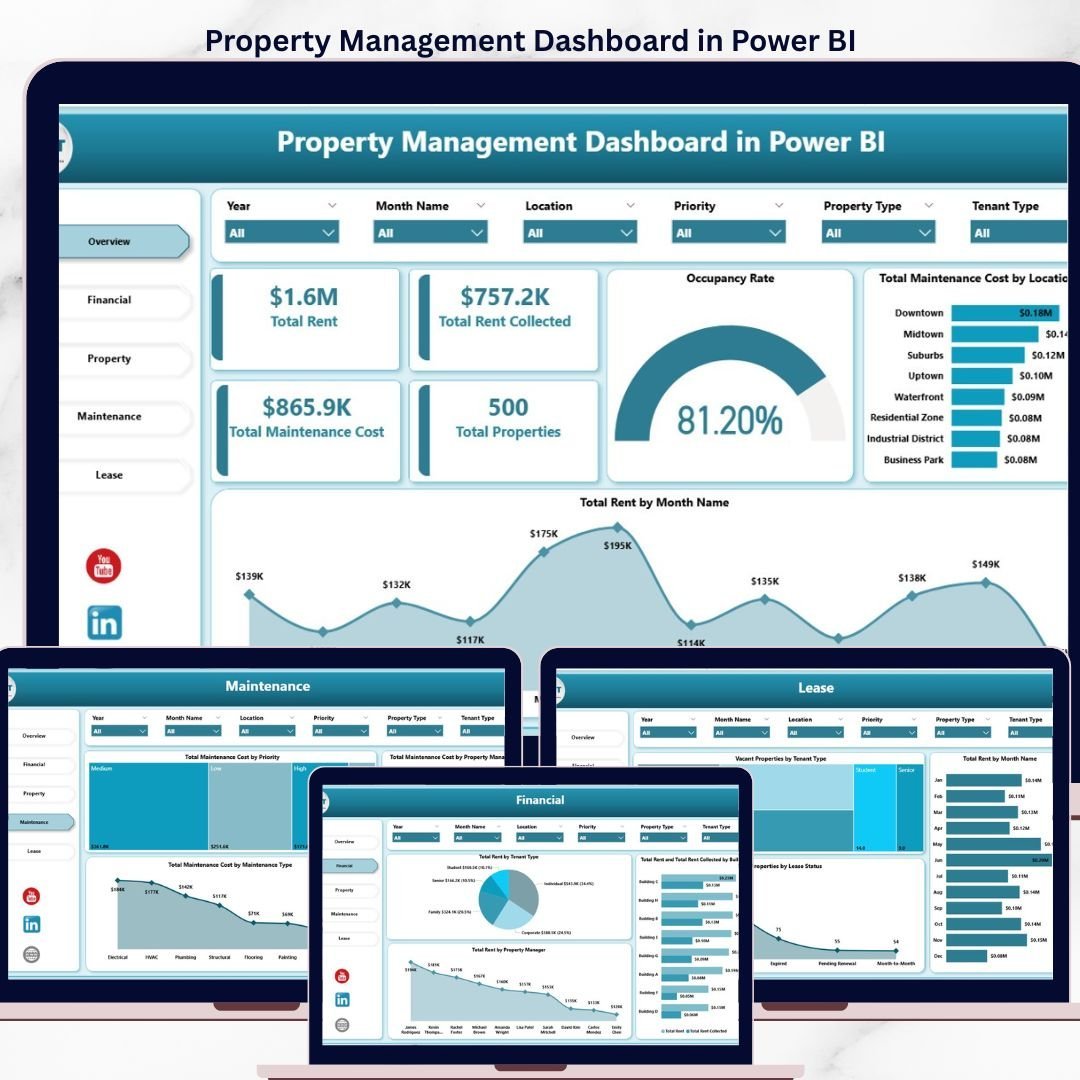 Property Management Dashboard in Power BI
View the Property Management Dashboard in Power BI →
3. Property Management KPI Dashboard in Excel
Tracks occupancy rates, rental income, maintenance requests, tenant satisfaction, and lease renewals with custom reports. A focused KPI layer for managers who want financial and operational health in one Excel file.Real Estate & Property Bundle
 Property Management KPI Dashboard in Excel
View the Property Management KPI Dashboard in Excel →
4. Vacation Rental KPI Dashboard in Excel
Purpose-built for short-term rentals: track bookings, occupancy, ADR, RevPAR, guest satisfaction, operational efficiency, and seasonal performance so you can fine-tune pricing for peak and off-peak periods.Real Estate & Property Bundle
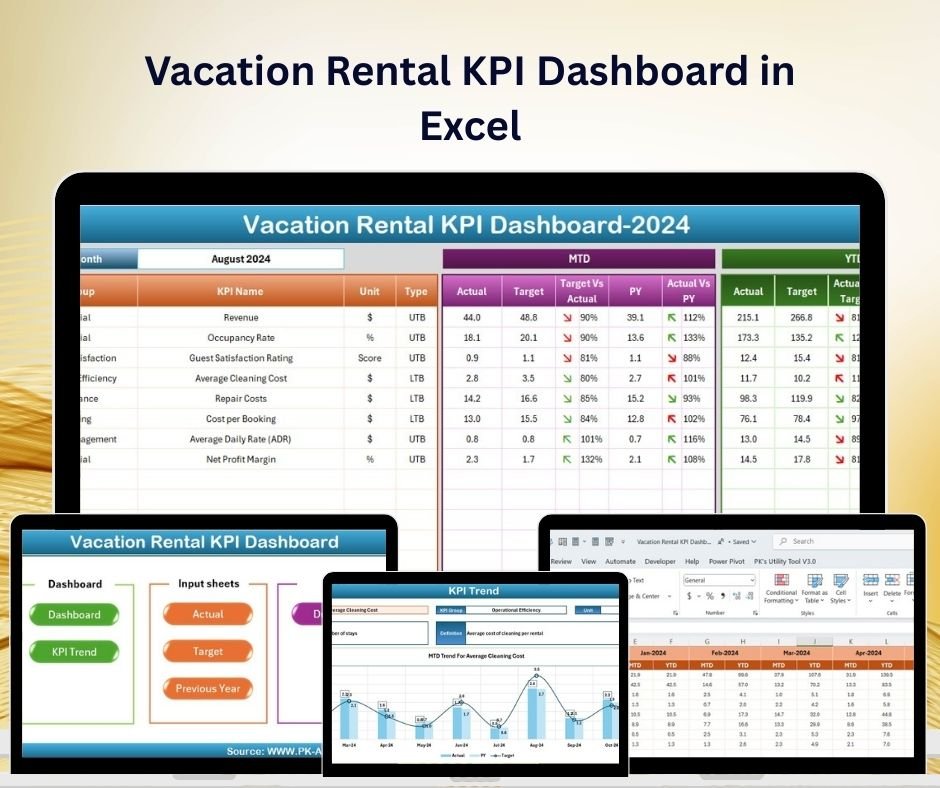 Vacation Rental KPI Dashboard in Excel
View the Vacation Rental KPI Dashboard in Excel →
5. Rental Property Investment Dashboard in Google Sheets
A cloud-based, six-page dashboard covering an overview, financial analysis, property performance, occupancy analysis, a smart property search, and a data sheet. Make a copy in Google Drive, drop in your data, and share with your team in real time.Real Estate & Property Bundle
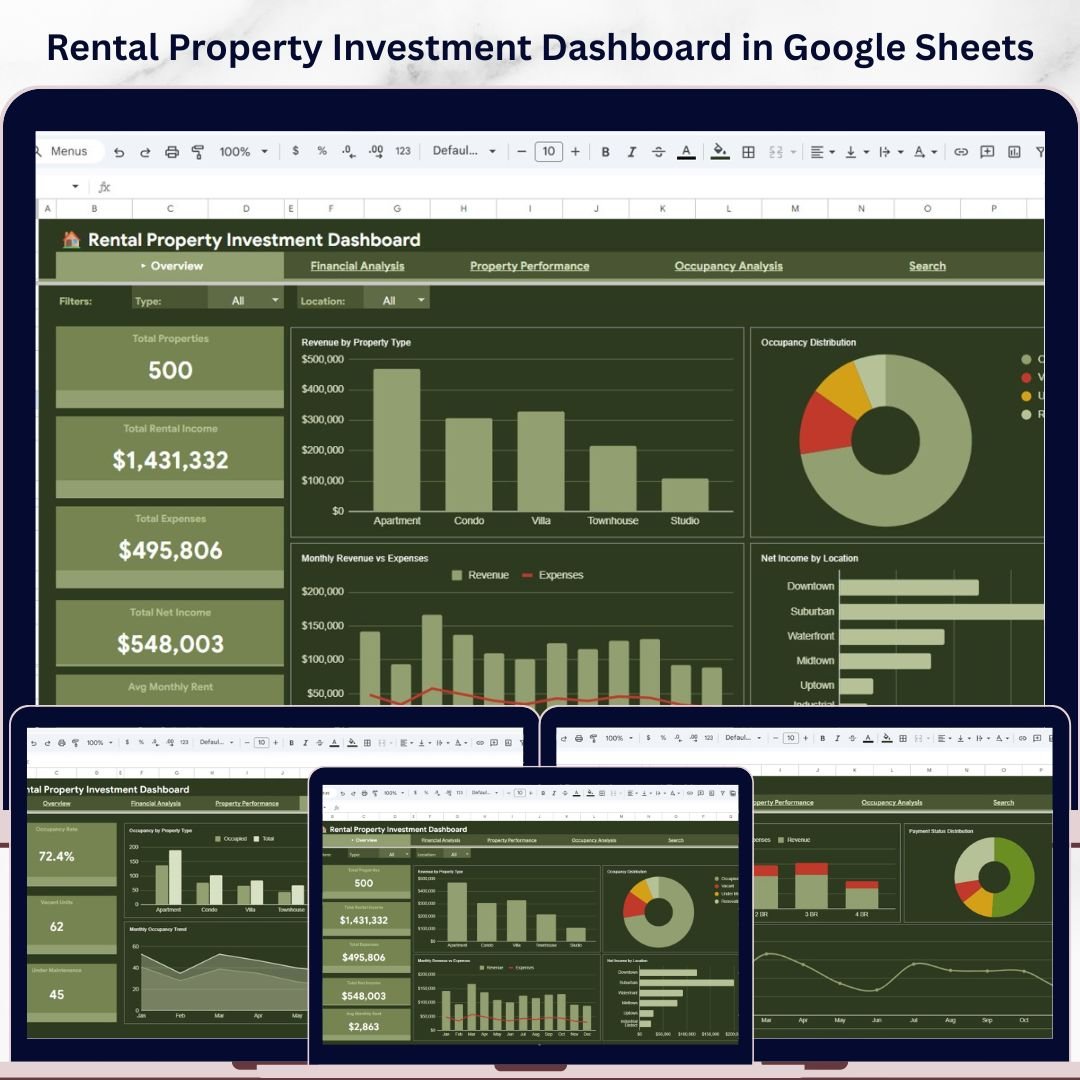 Rental Property Investment Dashboard in Google Sheets
View the Rental Property Investment Dashboard in Google Sheets →
6. Rent Payment Checklist Template in Excel
A simple, effective tracker for monthly rent, due dates, payment status, and reminders across multiple tenants and units — the operational backbone that keeps collections on time.Real Estate & Property Bundle
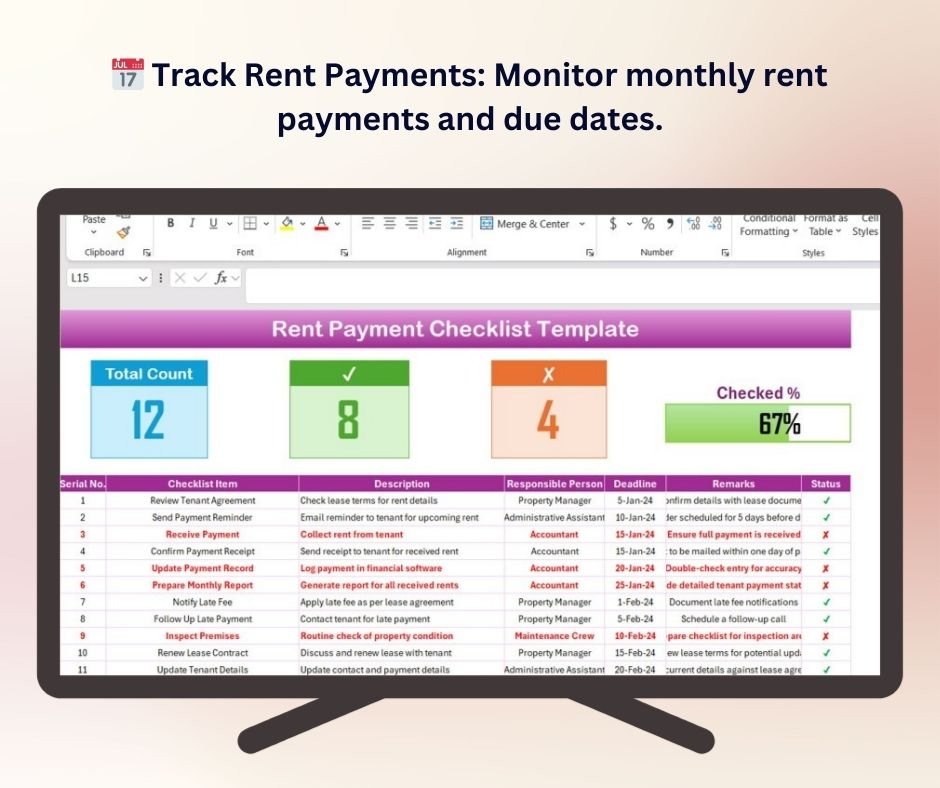 Rent Payment Checklist Template in Excel
View the Rent Payment Checklist Template in Excel →
7. Press Release Checklist in Excel
For property launches, new developments, and agency announcements: a guided checklist to structure, approve, optimize, and distribute press releases while tracking media contacts and follow-ups.
 Press Release Checklist in Excel
View the Press Release Checklist in Excel →
Smart Comparison — Individual vs Bundle
| # | Template | Platform | Individual Price |
|---|---|---|---|
| 1 | Real Estate Dashboard | Excel | $24.99 |
| 2 | Property Management Dashboard | Power BI | $24.99 |
| 3 | Property Management KPI Dashboard | Excel | $19.99 |
| 4 | Vacation Rental KPI Dashboard | Excel | $19.99 |
| 5 | Rental Property Investment Dashboard | Google Sheets | $18.99 |
| 6 | Rent Payment Checklist Template | Excel | $4.99 |
| 7 | Press Release Checklist | Excel | $4.99 |
| Individual Total | $118.93 | ||
| Bundle Price (Save 66%) | $39.99 | ||
Why Buy the Bundle Instead of Individual Templates
Lower cost, broader coverage. At $39.99 the bundle costs less than buying just two of the dashboards separately, yet you receive all seven — including the operational checklists most teams forget they need until collections slip.
One consistent data model. Because the templates share a common design language, learning one makes the others instantly familiar. Your team spends time analyzing properties, not relearning layouts.
Platform flexibility. Keep desktop Excel for offline work, Power BI for board-ready interactive reports, and Google Sheets for cloud collaboration — without committing to a single ecosystem or paying recurring SaaS fees.
No subscription, lifetime access. This is a one-time purchase with instant download and free updates, unlike property-management SaaS platforms that charge monthly per-unit fees.
Best Practices for Deploying the Bundle
Start with the dashboard that maps to your most urgent question. If collections are the pain point, set up the Rent Payment Checklist and the Property Management KPI Dashboard first. If you are reporting to investors, lead with the Power BI dashboard or the Google Sheets investment dashboard.
Keep one clean source table per template and avoid editing the calculated cells directly — enter data only in the designated input sheets so the formulas and visuals keep working. Once a month, review occupancy and maintenance trends together; rising maintenance cost in a low-occupancy property is usually the earliest signal that a unit needs attention.
For teams, use the Google Sheets dashboard as the shared, always-current view and export the Excel or Power BI versions for formal monthly or quarterly reporting.
Explore More Templates
Looking for more? Browse our full ranges of Excel dashboard templates, Power BI dashboard templates, and Google Sheets dashboard templates, or see all of our template bundles for more ways to save.
Frequently Asked Questions
What is included in the Real Estate & Property Bundle?
The bundle includes 7 templates: the Real Estate Dashboard (Excel), Property Management Dashboard (Power BI), Property Management KPI Dashboard (Excel), Vacation Rental KPI Dashboard (Excel), Rental Property Investment Dashboard (Google Sheets), Rent Payment Checklist (Excel), and Press Release Checklist (Excel).
How much do I save by buying the bundle?
Purchased individually the seven templates total $118.93. The bundle is $39.99, so you save $78.94 — about 66% off.
Which software do I need?
You need Microsoft Excel for the Excel templates, free Power BI Desktop for the Power BI dashboard, and a Google account for the Google Sheets dashboard. No coding, macros, or add-ins are required.
Is this a one-time payment or a subscription?
It is a one-time payment with instant download and lifetime access. There are no recurring charges and no per-unit fees.
Can I customize the templates for my own portfolio?
Yes. Every template is fully editable. Replace the sample data with your own property, rent, tenant, and booking records, and all KPIs, charts, and slicers update automatically.
Who is this bundle best for?
Property managers, landlords, real estate investors, vacation rental hosts, and real estate analysts who want professional portfolio analytics without paying for expensive property-management software.
Get the Real Estate & Property Bundle Today
All 7 Real Estate Templates for Just $39.99
Individual price $118.93 → $39.99 (Save 66%)
Visit our YouTube channel for step-by-step video tutorials on every template in this bundle.