Recruitment agencies work in a fast-moving, target-driven environment. Every day, recruiters track candidates, clients, interviews, offers, and revenue. However, without a structured performance system, teams lose visibility, managers miss trends, and decisions rely on guesswork. Therefore, a Recruitment Agencies KPI Dashboard in Excel becomes an essential business tool.
In this detailed guide, you will learn what a Recruitment Agencies KPI Dashboard in Excel is, why it matters, how it works, its structure, advantages, best practices, and frequently asked questions. Moreover, this article explains how recruitment agencies can convert raw hiring data into meaningful insights using a simple yet powerful Excel-based dashboard.
Click to buy Recruitment Agencies KPI Dashboard in Excel
What Is a Recruitment Agencies KPI Dashboard in Excel?
A Recruitment Agencies KPI Dashboard in Excel is a centralized performance management tool that tracks, analyzes, and visualizes key recruitment metrics in one interactive Excel file. Instead of reviewing multiple sheets or manual reports, agencies view all critical KPIs in a single dashboard.
Moreover, this dashboard focuses on both MTD (Month-to-Date) and YTD (Year-to-Date) performance. As a result, recruiters and managers understand short-term execution and long-term progress at the same time.
In addition, Excel-based dashboards offer flexibility, cost-effectiveness, and ease of customization, which makes them ideal for small, mid-sized, and large recruitment agencies.
Why Do Recruitment Agencies Need a KPI Dashboard in Excel?
Recruitment agencies deal with high volumes of data. However, raw data alone does not deliver insights. Therefore, agencies need a structured dashboard that transforms data into action.
Here is why a KPI Dashboard in Excel matters:
- It creates clear visibility into recruitment performance
- It highlights target vs actual gaps instantly
- It supports data-driven decisions
- It improves accountability across recruiters
- It saves hours of manual reporting time
Moreover, when leaders see performance trends early, they act faster and reduce hiring risks.
Which KPIs Should a Recruitment Agency Track?
Every recruitment agency tracks multiple KPIs. However, the most effective dashboards focus on actionable metrics rather than vanity numbers.
Common recruitment KPIs include:
- Number of job openings
- Candidates sourced
- Interviews scheduled
- Offers made
- Offers accepted
- Time to hire
- Cost per hire
- Placement success rate
- Revenue per recruiter
Therefore, a structured KPI Definition sheet becomes the backbone of the dashboard.
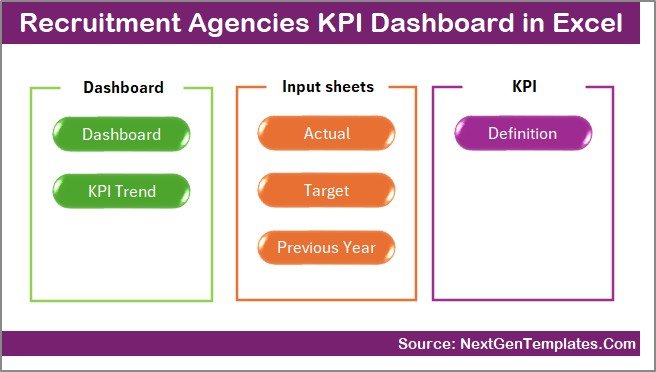
How Is the Recruitment Agencies KPI Dashboard in Excel Structured?
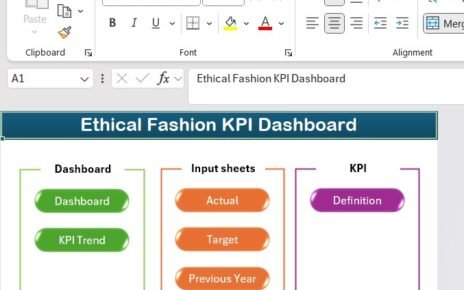
This Recruitment Agencies KPI Dashboard in Excel follows a professional and scalable structure with 7 well-defined worksheets. Each sheet plays a specific role and ensures smooth data flow across the dashboard.
Summary Page – Why Start with an Index Sheet?
The Summary Page acts as the navigation hub of the dashboard.
Key Features of the Summary Page
- Acts as an index sheet
- Contains 6 clickable buttons
- Enables quick navigation to all major worksheets
- Improves user experience and usability
Because of this structure, even non-technical users navigate the dashboard without confusion.
Click to buy Recruitment Agencies KPI Dashboard in Excel
Dashboard Sheet – Where Do KPIs Come Alive?
The Dashboard Sheet serves as the heart of the Recruitment KPI Dashboard in Excel.
What Does the Dashboard Sheet Show?
- Overall KPI performance for the selected month
- MTD Actual, Target, and Previous Year values
- YTD Actual, Target, and Previous Year values
Interactive Month Selection
- Month dropdown available in cell D3
- All KPIs update automatically when the month changes
- Enables quick month-wise performance analysis
Performance Comparison Logic
The dashboard highlights:
- Target vs Actual comparison
- Previous Year vs Actual comparison
Moreover, conditional formatting arrows visually indicate performance:
- Green arrow → Performance improved
- Red arrow → Performance declined
As a result, users identify performance gaps instantly.

Click to buy Recruitment Agencies KPI Dashboard in Excel
Trend Sheet – How Do You Analyze KPI Trends?
The Trend Sheet focuses on individual KPI analysis over time.
What Can You Select on the Trend Sheet?
- KPI Name dropdown available in cell C3
- Automatic display of:
KPI Group
KPI Unit
KPI Type (UTB or LTB)
KPI Formula
KPI Definition
Charts Available on the Trend Sheet
- MTD trend chart for Actual, Target, and Previous Year
- YTD trend chart for Actual, Target, and Previous Year
Because of these charts, recruiters understand performance direction instead of isolated values.

Click to buy Recruitment Agencies KPI Dashboard in Excel
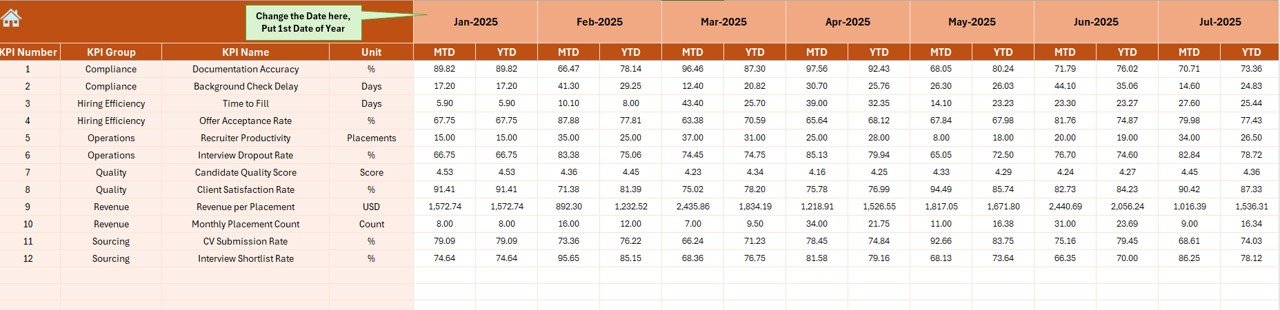
Actual Numbers Input Sheet – Where Does Data Entry Happen?
The Actual Numbers Input Sheet captures real recruitment performance data.
How Does This Sheet Work?
- Users enter MTD and YTD actual values
- Month selection available in cell E1
- Users input the first month of the year
- Dashboard adjusts automatically based on inputs
This design ensures consistency and reduces data entry errors.
Click to buy Recruitment Agencies KPI Dashboard in Excel
Target Sheet – How Do You Track Recruitment Goals?
The Target Sheet stores monthly recruitment targets.
Key Details of the Target Sheet
- Separate input for MTD targets
- Separate input for YTD targets
- Target values entered for each KPI
- Enables goal tracking and benchmarking
Because targets define success, this sheet drives performance accountability.

Click to buy Recruitment Agencies KPI Dashboard in Excel
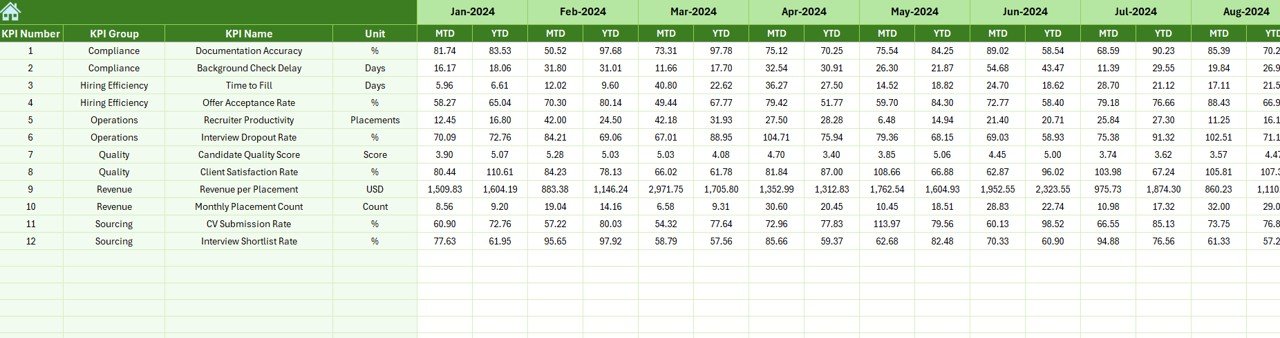
Previous Year Number Sheet – Why Compare with History?
The Previous Year Number Sheet captures historical performance data.
Why This Sheet Matters
- Enables year-over-year comparison
- Highlights growth or decline trends
- Supports strategic planning
Users enter data in the same format as the current year, which ensures accurate comparisons.
Click to buy Recruitment Agencies KPI Dashboard in Excel
KPI Definition Sheet – Why Is KPI Governance Important?
The KPI Definition Sheet acts as the foundation of the entire dashboard.
Information Captured in This Sheet
- KPI Name
- KPI Group
- Unit of Measurement
- KPI Formula
- KPI Definition
Because every KPI remains clearly defined, confusion disappears and reporting stays consistent.

Click to buy Recruitment Agencies KPI Dashboard in Excel
Advantages of Recruitment Agencies KPI Dashboard in Excel
A Recruitment KPI Dashboard in Excel delivers measurable business benefits.
Key Advantages
- Centralized KPI tracking
- Clear MTD and YTD visibility
- Instant target vs actual comparison
- Easy customization in Excel
- No expensive BI tools required
- Faster decision-making
- Improved recruiter accountability
Therefore, agencies gain control over performance without increasing overhead costs.
How Does This Dashboard Improve Recruitment Decision-Making?
This dashboard supports decision-making in multiple ways.
- Managers identify underperforming KPIs early
- Recruiters adjust sourcing strategies quickly
- Leaders allocate resources based on data
- Teams align actions with business targets
Moreover, visual indicators eliminate the need for lengthy explanations.
Best Practices for the Recruitment Agencies KPI Dashboard in Excel
To get maximum value from the dashboard, follow these best practices.
- Define KPIs Clearly
Always define KPIs with clear formulas and ownership.
- Update Data Regularly
Enter actual numbers consistently every month.
- Review Trends Monthly
Focus on trend direction instead of single-month performance.
- Keep KPI Count Manageable
Track meaningful KPIs rather than too many metrics.
- Validate Data Accuracy
Ensure data consistency across Actual, Target, and Previous Year sheets.
- Train Users
Educate recruiters and managers on reading dashboard insights.
Who Can Use a Recruitment Agencies KPI Dashboard in Excel?
This dashboard suits multiple roles:
- Recruitment agency owners
- HR consultants
- Talent acquisition managers
- Staffing firms
- Executive leadership teams
Because Excel remains widely used, adoption becomes easy.
How Is This Dashboard Different from Basic Recruitment Reports?
Unlike static reports, this dashboard offers:
- Interactivity
- Month-wise selection
- Automated calculations
- Visual performance indicators
- Structured KPI governance
Therefore, it transforms reporting into performance management.
Common Mistakes to Avoid When Using Recruitment KPI Dashboards
Avoid these mistakes to ensure success:
- Ignoring KPI definitions
- Tracking too many metrics
- Delaying data updates
- Focusing only on MTD values
- Skipping trend analysis
Correct usage ensures long-term value.
Future Scope of Recruitment KPI Dashboards in Excel
Excel dashboards continue to evolve.
Future improvements may include:
- Recruiter-wise performance views
- Client-wise recruitment analysis
- Automation using Power Query
- Integration with ATS exports
Therefore, Excel remains a powerful analytics platform.
Conclusion
A Recruitment Agencies KPI Dashboard in Excel provides clarity, control, and confidence in recruitment performance management. By combining structured KPI definitions, interactive dashboards, trend analysis, and clear comparisons, agencies transform raw data into strategic insights.
Moreover, Excel-based dashboards offer affordability, flexibility, and scalability. When recruitment agencies track the right KPIs and follow best practices, they improve efficiency, reduce hiring risks, and achieve consistent growth.
Frequently Asked Questions (FAQs)
What is the main purpose of a Recruitment Agencies KPI Dashboard in Excel?
The dashboard helps recruitment agencies track performance, compare targets, analyze trends, and make data-driven decisions.
Can small recruitment agencies use this dashboard?
Yes, small agencies benefit greatly because Excel dashboards require no additional software investment.
How often should recruitment KPIs be updated?
Agencies should update KPIs monthly to maintain accuracy and relevance.
Does this dashboard support MTD and YTD analysis?
Yes, the dashboard shows both MTD and YTD Actual, Target, and Previous Year values.
Can users customize KPIs in this Excel dashboard?
Yes, users can modify KPIs easily through the KPI Definition sheet.
Is Excel better than BI tools for recruitment dashboards?
Excel works best for teams that need flexibility, simplicity, and cost efficiency, especially at early or mid growth stages.
Click to buy Recruitment Agencies KPI Dashboard in Excel
Visit our YouTube channel to learn step-by-step video tutorials
Watch the step-by-step video tutorial: