The renewable energy industry is growing faster than ever. Solar farms, wind parks, hydropower plants, and hybrid energy projects now generate massive amounts of operational data every day. However, many organizations still struggle to convert this raw data into meaningful insights. As a result, decision-makers often face delays, inefficiencies, and missed optimization opportunities.
Therefore, companies increasingly adopt advanced analytics solutions to monitor performance in real time. One of the most powerful solutions available today is the Renewable Energy Dashboard in Power BI — an interactive analytics platform that transforms complex energy data into clear, visual insights.
In this comprehensive guide, you will learn everything about the Renewable Energy Dashboard in Power BI, including its structure, features, benefits, analysis capabilities, best practices, and frequently asked questions. Moreover, you will understand how this dashboard helps organizations improve operational efficiency and maximize renewable energy output.
Click to buy Renewable Energy Dashboard in Power BI
What Is a Renewable Energy Dashboard in Power BI?
A Renewable Energy Dashboard in Power BI is a data visualization and reporting system designed to track renewable energy performance using interactive charts, KPIs, and filters.
Instead of reviewing multiple spreadsheets and reports, managers analyze all operational metrics from a centralized dashboard. Consequently, teams identify performance gaps quickly and take corrective actions faster.
This dashboard helps organizations monitor:
- Energy generation performance
- Grid export efficiency
- Revenue performance
- Curtailment losses
- Plant and regional productivity
- Monthly operational trends
Because Power BI updates visuals dynamically, users can analyze data instantly using slicers and filters.
Why Do Renewable Energy Companies Need a Dashboard?
Renewable energy operations involve multiple variables. Plants operate across regions, energy sources vary, and grid conditions change frequently. Therefore, manual tracking becomes inefficient.
A structured dashboard solves these challenges.
Key Challenges Without a Dashboard
- Data scattered across systems
- Slow reporting processes
- Lack of performance visibility
- Difficulty tracking downtime and curtailment
- Poor strategic decision-making
However, a Power BI dashboard centralizes all information. As a result, organizations gain clarity and control over operations.
Key Features of Renewable Energy Dashboard in Power BI
This dashboard contains five interactive analytical pages within the Power BI Desktop application. Each page focuses on a specific performance perspective.
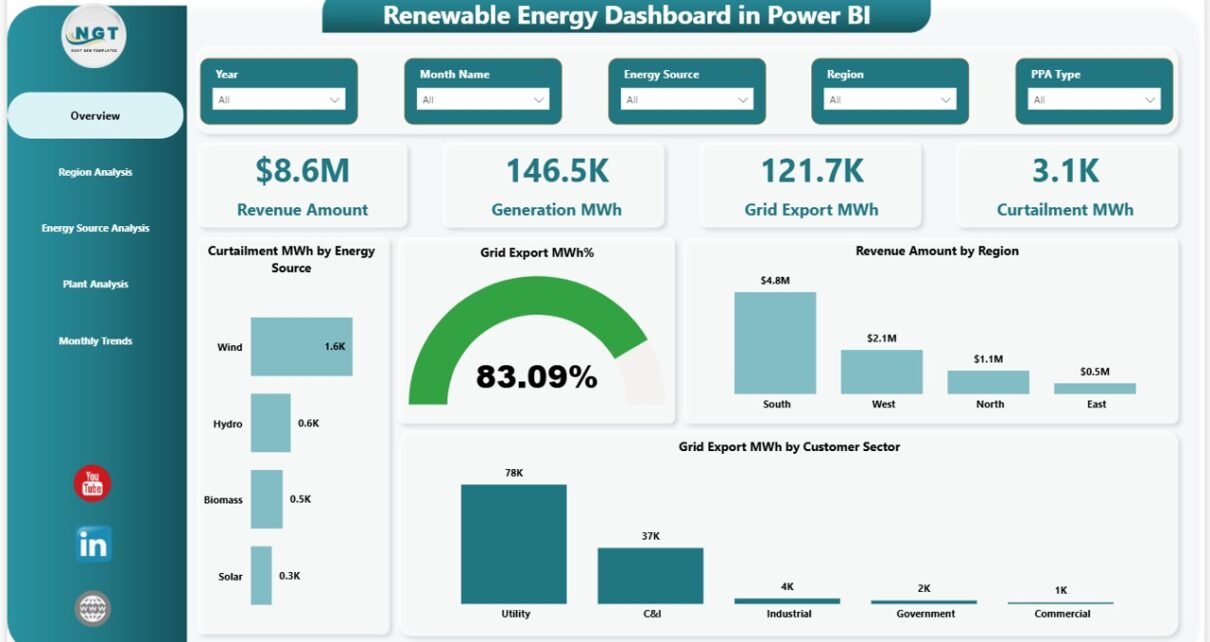
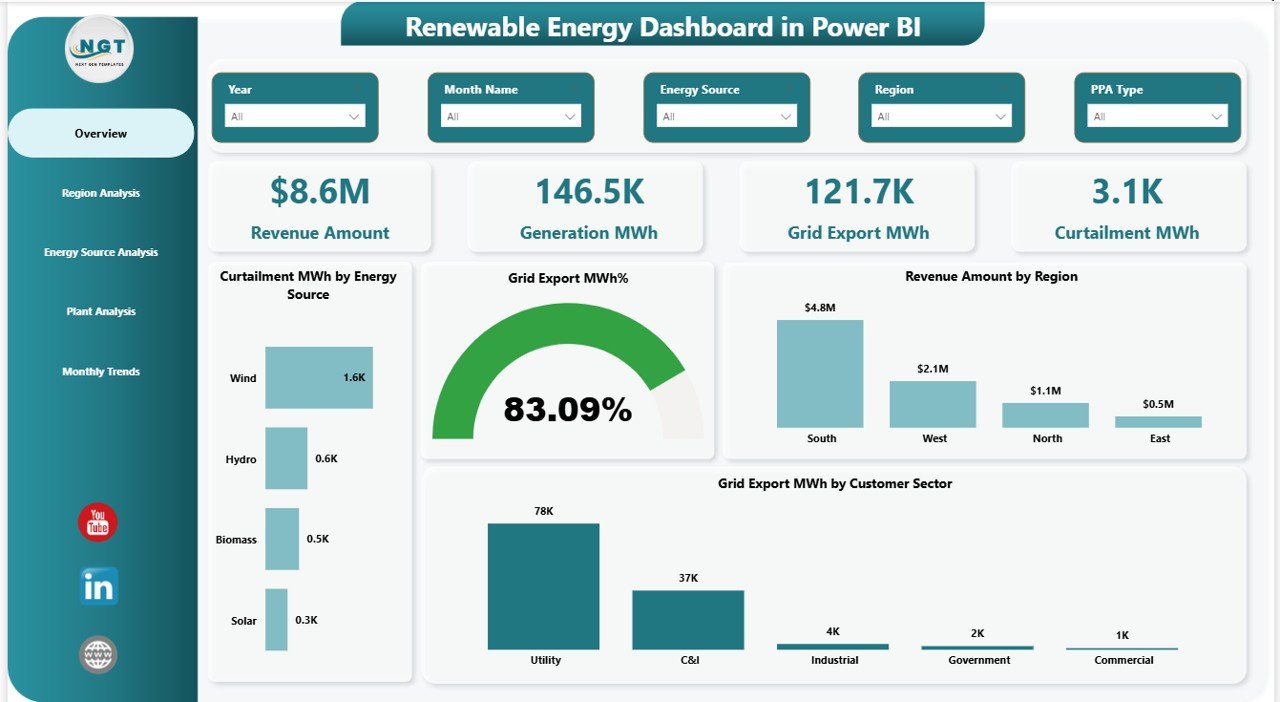
Overview Page — How Does the Dashboard Summarize Performance?
The Overview Page acts as the main control center of the dashboard. It provides a quick snapshot of overall renewable energy operations.
KPI Cards
The dashboard displays five important KPI cards:
- Revenue Amount
- Generation (MWh)
- Grid Export (MWh)
- Curtailment (MWh)
- Overall performance indicators
These cards allow decision-makers to evaluate performance instantly.
Charts Available
- Curtailment MWh by Energy Source
- Grid Export MWh %
- Revenue Amount by Region
- Grid Export MWh by Customer Sector
Because users can apply slicers, they instantly filter data by time or category.
Click to buy Renewable Energy Dashboard in Power BI
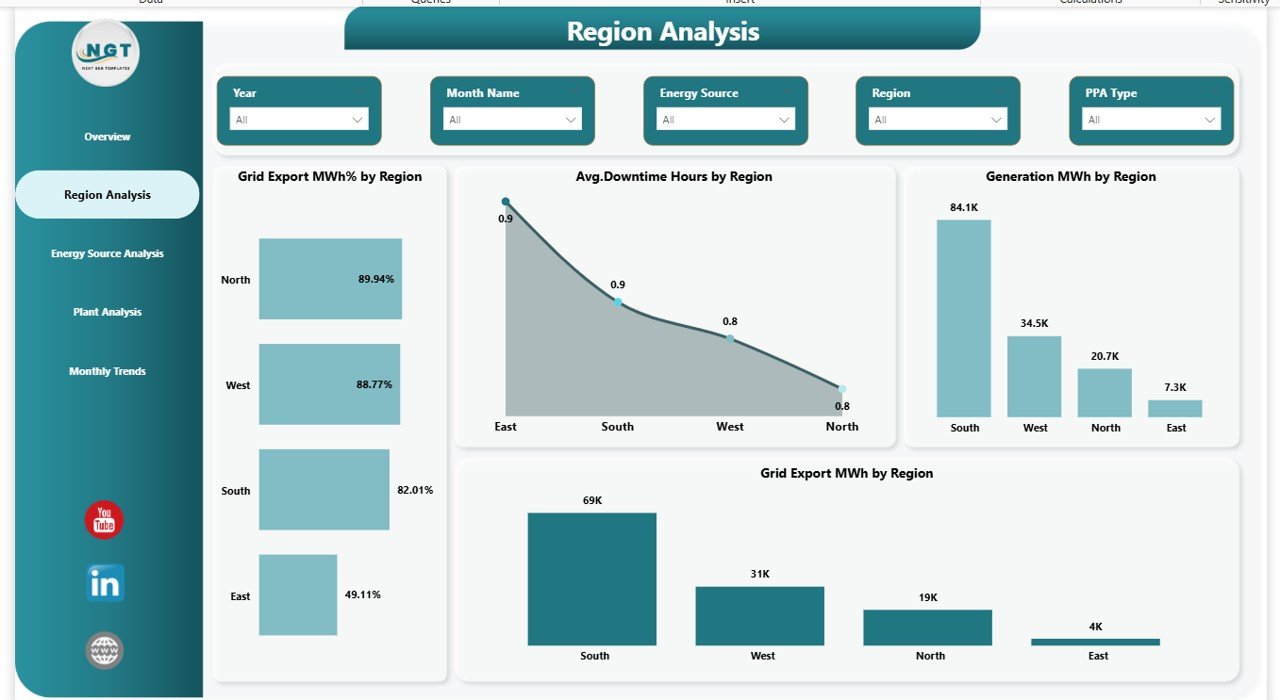
Region Analysis — How Does Performance Differ Across Regions?
Renewable energy output varies by geography. Weather conditions, infrastructure, and demand influence performance. Therefore, regional analysis becomes essential.
Charts in Region Analysis
- Grid Export MWh % by Region
- Average Downtime Hours by Region
- Generation MWh by Region
- Grid Export MWh by Region
Through this page, managers quickly identify high-performing and underperforming regions.
For example, if downtime increases in one region, teams investigate operational issues immediately.
Click to buy Renewable Energy Dashboard in Power BI
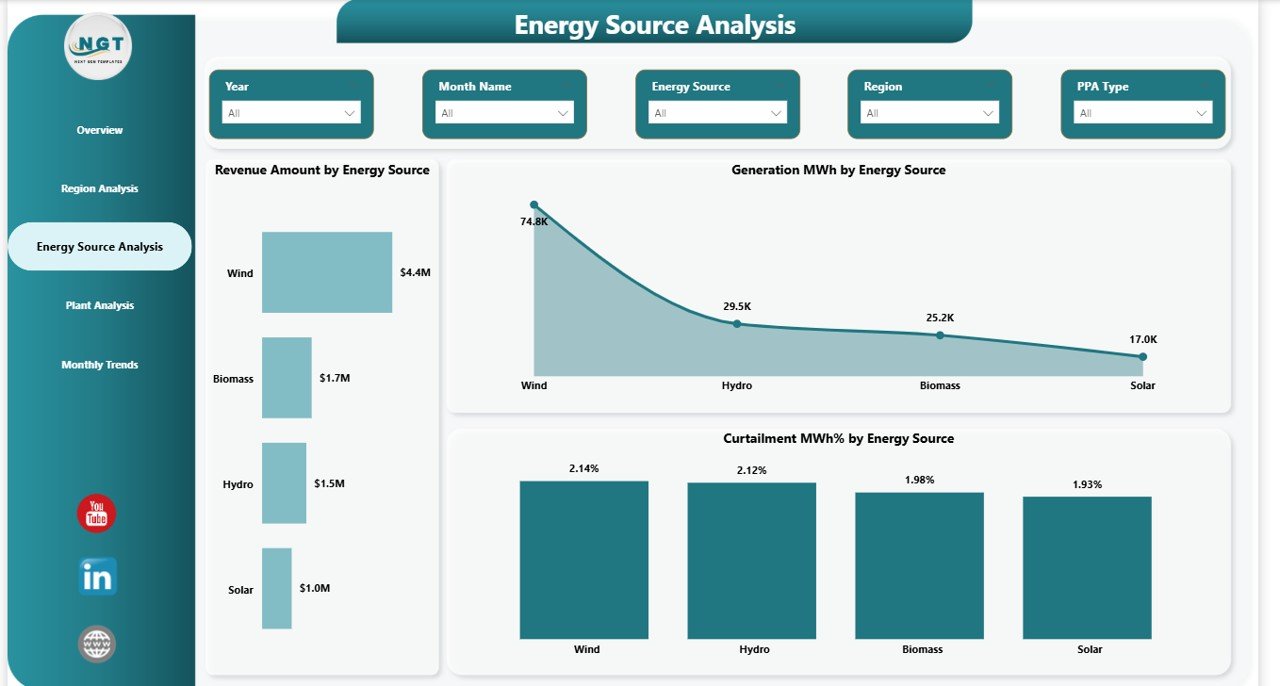
Energy Source Analysis — Which Energy Source Performs Best?
Renewable energy projects often combine multiple energy sources such as solar, wind, hydro, or biomass. Therefore, organizations must compare performance across sources.
Charts Included
- Revenue Amount by Energy Source
- Generation MWh by Energy Source
- Curtailment MWh % by Energy Source
This analysis helps companies allocate investments strategically. Additionally, managers understand which energy source delivers maximum profitability.
Click to buy Renewable Energy Dashboard in Power BI
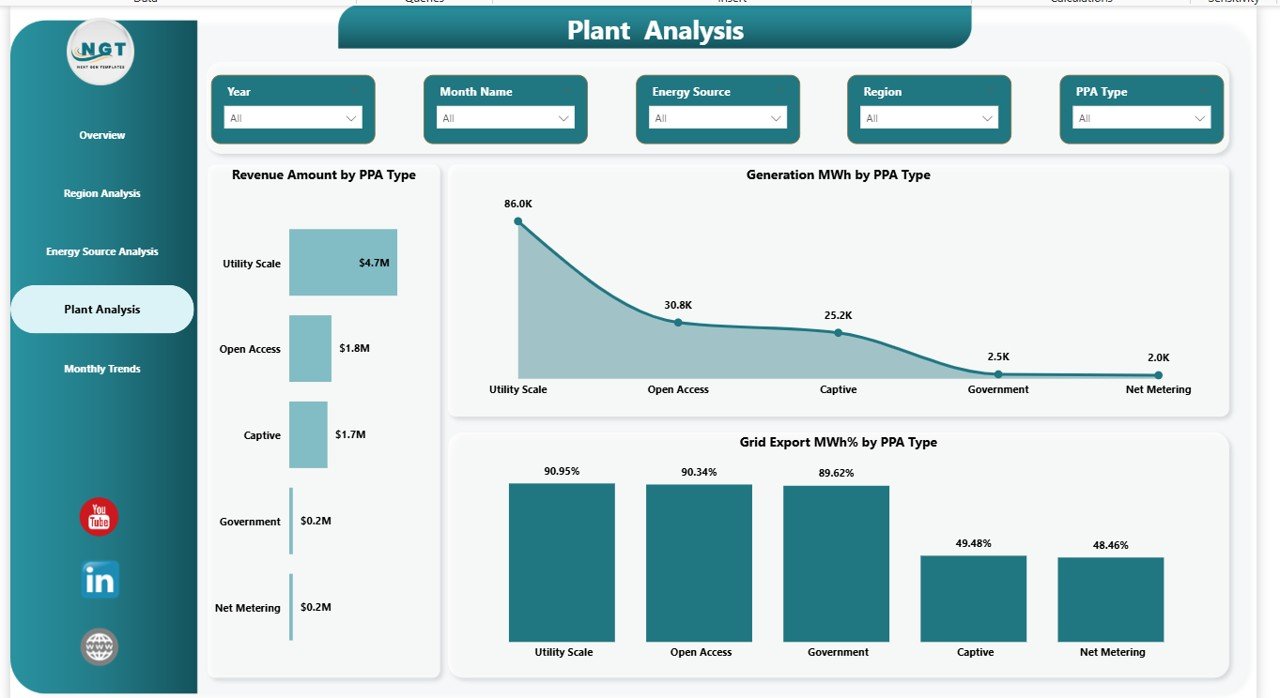
Plant Analysis — How Do Power Purchase Agreements Affect Performance?
Power Purchase Agreements (PPAs) directly impact revenue and operational planning. Hence, analyzing performance by PPA type becomes essential.
Charts Available
- Revenue Amount by PPA Type
- Generation MWh by PPA Type
- Grid Export MWh % by PPA Type
Using this page, organizations evaluate contract effectiveness and improve future agreements.
Click to buy Renewable Energy Dashboard in Power BI
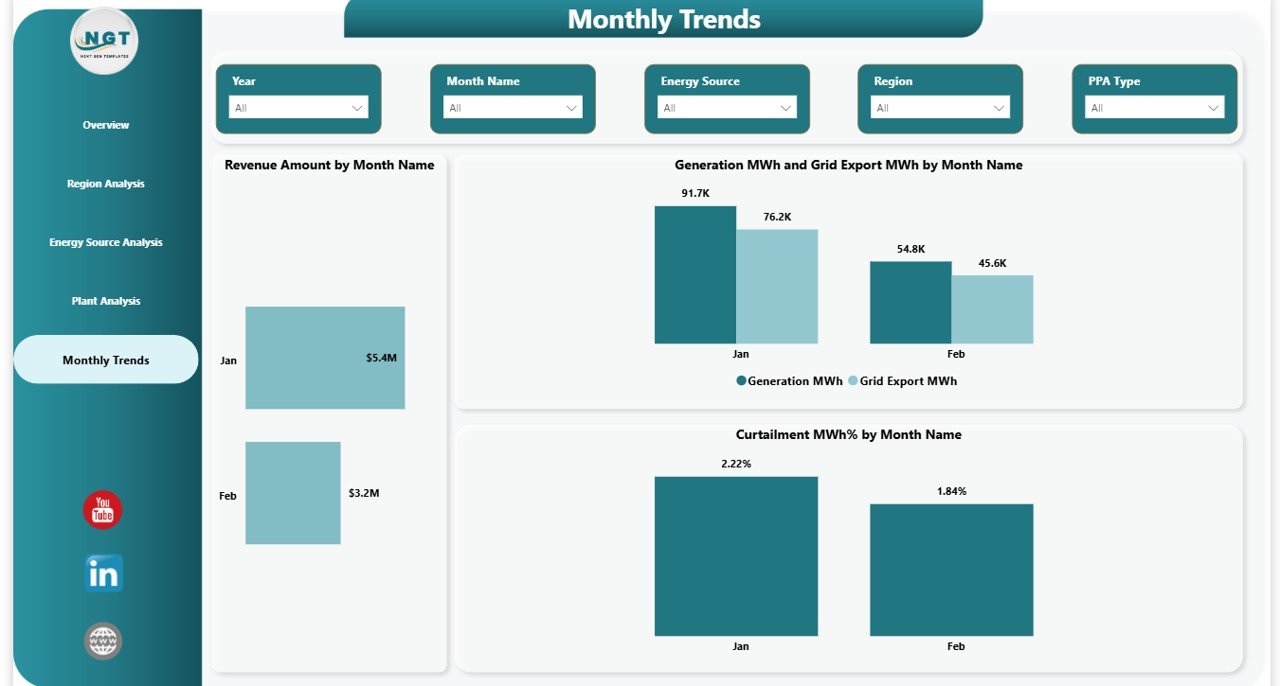
Monthly Trends — How Does Performance Change Over Time?
Trend analysis plays a crucial role in renewable energy management. Seasonal variations influence energy generation significantly.
Monthly Trend Charts
- Revenue Amount by Month Name
- Generation MWh and Grid Export MWh by Month
- Curtailment MWh % by Month
Because trend visuals highlight seasonal patterns, companies forecast production more accurately.
Click to buy Renewable Energy Dashboard in Power BI
What Insights Can You Gain from This Dashboard?
The Renewable Energy Dashboard provides actionable insights that support strategic decisions.
Operational Insights
- Identify plants with high downtime
- Monitor generation efficiency
- Track grid export performance
- Reduce curtailment losses
Financial Insights
- Analyze revenue contribution by region
- Compare energy source profitability
- Evaluate PPA effectiveness
Strategic Insights
- Improve energy distribution planning
- Optimize plant operations
- Support expansion decisions
Advantages of Renewable Energy Dashboard in Power BI
Organizations gain multiple benefits when they implement this dashboard.
Improved Decision-Making
Managers access real-time insights, therefore they make faster decisions.
Centralized Data Visibility
All performance metrics appear in one dashboard, which eliminates data confusion.
Enhanced Operational Efficiency
Teams quickly identify problems and resolve them proactively.
Better Revenue Optimization
Companies analyze profitable energy sources and focus investments accordingly.
Sustainability Monitoring
Organizations track renewable energy impact and efficiency continuously.
How Does Power BI Improve Renewable Energy Analytics?
Power BI offers advanced capabilities that make dashboards highly effective.
Interactive Visualization
Users explore data dynamically instead of reading static reports.
Real-Time Updates
Data refresh ensures accurate reporting.
Drill-Down Analysis
Managers move from summary view to detailed insights instantly.
User-Friendly Interface
Even non-technical users analyze data easily.
Who Can Benefit from a Renewable Energy Dashboard?
Many professionals use this dashboard daily.
- Renewable energy companies
- Solar and wind farm operators
- Energy analysts
- Utility companies
- Sustainability managers
- Government energy departments
- Investors and stakeholders
Because the dashboard simplifies complex analysis, every stakeholder understands performance clearly.
Best Practices for the Renewable Energy Dashboard in Power BI
Following best practices ensures maximum dashboard effectiveness.
- Maintain Clean Data Structure
Always organize data using consistent formats and units.
- Update Data Regularly
Frequent updates ensure accurate insights.
- Use Meaningful KPIs
Select metrics aligned with business goals.
- Apply Proper Filters
Slicers should simplify navigation rather than confuse users.
- Monitor Curtailment Closely
Reducing curtailment improves profitability significantly.
- Focus on Trend Analysis
Monthly trends reveal operational patterns early.
- Standardize Energy Units
Use MWh consistently across datasets.
How Does This Dashboard Support Sustainability Goals?
Renewable energy organizations aim to reduce carbon emissions while maintaining profitability. Therefore, performance monitoring becomes essential.
This dashboard helps by:
- Tracking clean energy generation
- Measuring efficiency improvements
- Monitoring energy distribution
- Supporting data-driven sustainability reporting
As a result, companies align operations with environmental targets.
How to Implement a Renewable Energy Dashboard Successfully?
Implementation becomes simple when organizations follow structured steps.
- Collect operational data from plants.
- Clean and validate datasets.
- Import data into Power BI.
- Create relationships between tables.
- Build KPIs and measures.
- Design interactive visuals.
- Publish dashboard for stakeholders.
Because Power BI supports automation, future updates require minimal effort.
Future of Renewable Energy Analytics
Renewable energy analytics continues to evolve rapidly. Organizations now integrate AI, IoT sensors, and predictive analytics into dashboards.
In the future, dashboards will:
- Predict energy generation using weather data
- Detect equipment failures early
- Optimize grid distribution automatically
- Provide AI-driven recommendations
Therefore, analytics dashboards will become essential operational tools rather than optional reports.
Conclusion
The Renewable Energy Dashboard in Power BI provides a powerful and structured way to monitor renewable energy performance. Instead of managing disconnected reports, organizations gain a centralized analytics platform that delivers real-time operational and financial insights.
Moreover, the dashboard improves decision-making, enhances efficiency, and supports sustainability goals simultaneously. Because renewable energy operations depend heavily on data accuracy and visibility, this dashboard becomes a critical management tool.
Ultimately, organizations that adopt data-driven energy monitoring achieve higher efficiency, reduced losses, and stronger long-term growth.
Frequently Asked Questions (FAQs)
- What is a Renewable Energy Dashboard in Power BI?
It is an interactive analytics dashboard that tracks renewable energy performance using KPIs, charts, and filters.
- Which KPIs are included in this dashboard?
Key KPIs include revenue amount, generation MWh, grid export MWh, and curtailment MWh.
- Can this dashboard support multiple energy sources?
Yes, it analyzes solar, wind, hydro, and other renewable sources simultaneously.
- Is Power BI suitable for renewable energy analytics?
Yes, Power BI provides powerful visualization, automation, and real-time analysis capabilities.
- Who should use this dashboard?
Energy managers, analysts, plant operators, and sustainability teams benefit most.
- Can beginners use this dashboard?
Yes, the interface remains user-friendly and requires minimal technical expertise.
- How often should data be updated?
Organizations should update data daily or weekly depending on operational needs.
- Does the dashboard help reduce curtailment losses?
Yes, it identifies inefficiencies quickly, allowing teams to take corrective actions.
Visit our YouTube channel to learn step-by-step video tutorials
Watch the step-by-step video tutorial:
Click to buy Renewable Energy Dashboard in Power BI