Rental Property Investment Dashboard in Excel is one of the most powerful and comprehensive Excel-based analytics tools available for real estate investors, property managers, landlords, and financial analysts. Designed to track rental income, occupancy rates, return on investment, and portfolio valuation across your entire property portfolio, this dashboard template provides everything you need to make data-driven investment decisions without any advanced Excel skills.
Click here to Purchase the Rental Property Investment Dashboard in Excel
Whether you manage a handful of rental properties or an extensive multi-location portfolio, this ready-to-use dashboard template gives you instant visibility into the financial and operational health of your real estate investments. With 5 interactive dashboard pages, advanced slicers, and fully automated pivot tables, this is the best Excel template for tracking rental property investments in 2026.
Key Features of Rental Property Investment Dashboard in Excel
The Rental Property Investment Dashboard in Excel is packed with professional-grade features that make property investment tracking simple and visual. Here are the standout features that set this template apart:
- 5 Interactive Dashboard Pages — The template includes Overview, Portfolio Analysis, Revenue Analysis, Occupancy Tracker, and ROI Analysis pages, each designed for a specific analytical focus area.
- Dynamic KPI Cards — Track Total Rent Income, Total NOI (Net Operating Income), Total Records, Total Portfolio Value, and Total Occupied properties at a glance from the Overview page.
- Advanced Slicers and Filters — Filter every dashboard page by Property Type, Location, Bedrooms, Management Type, Tenant Type, Lease Status, Property Condition, and Month for targeted analysis.
- Comprehensive ROI Analysis — Evaluate Return on Investment percentage by Property Type, Bedrooms, and Location to identify your best-performing rental assets.
- Monthly Trend Tracking — Spot seasonal patterns by monitoring NOI, occupancy, and record trends month over month.
- Portfolio Valuation Comparison — Compare Total Portfolio Value vs Total Investment by Property Type to understand net asset positioning and capital allocation efficiency.
- Fully Automated with Pivot Tables — All charts and KPI cards refresh automatically when you update the data and click Refresh All in the Data tab.
Dashboard Pages Explained
Click here to Purchase the Rental Property Investment Dashboard in Excel
1. Overview Page
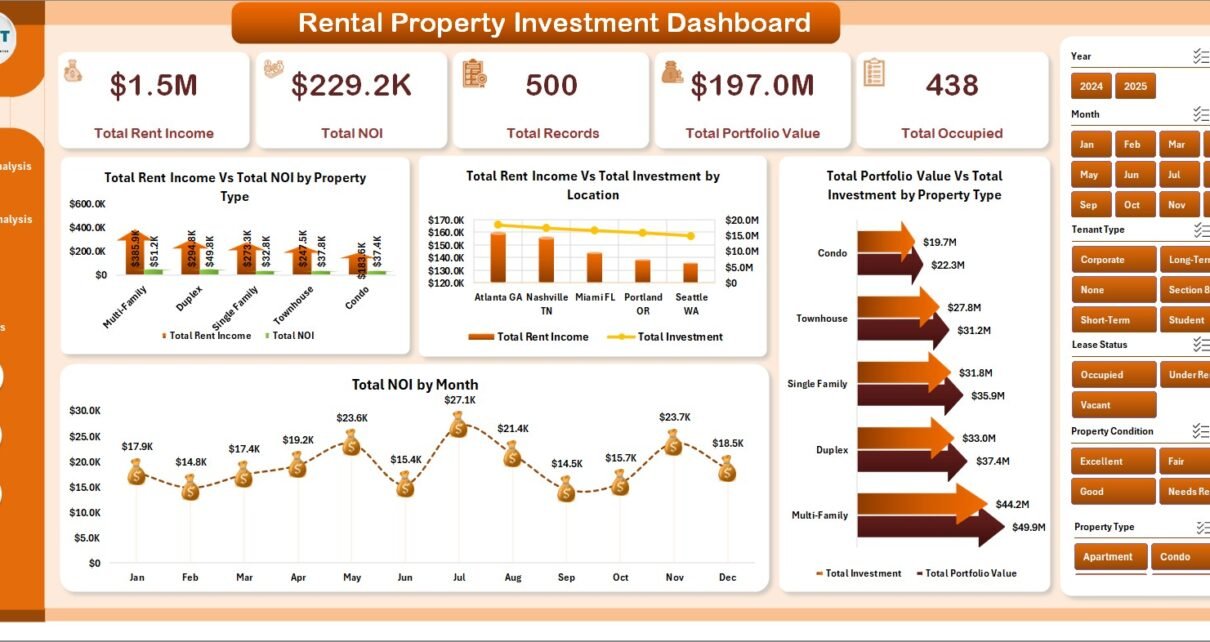
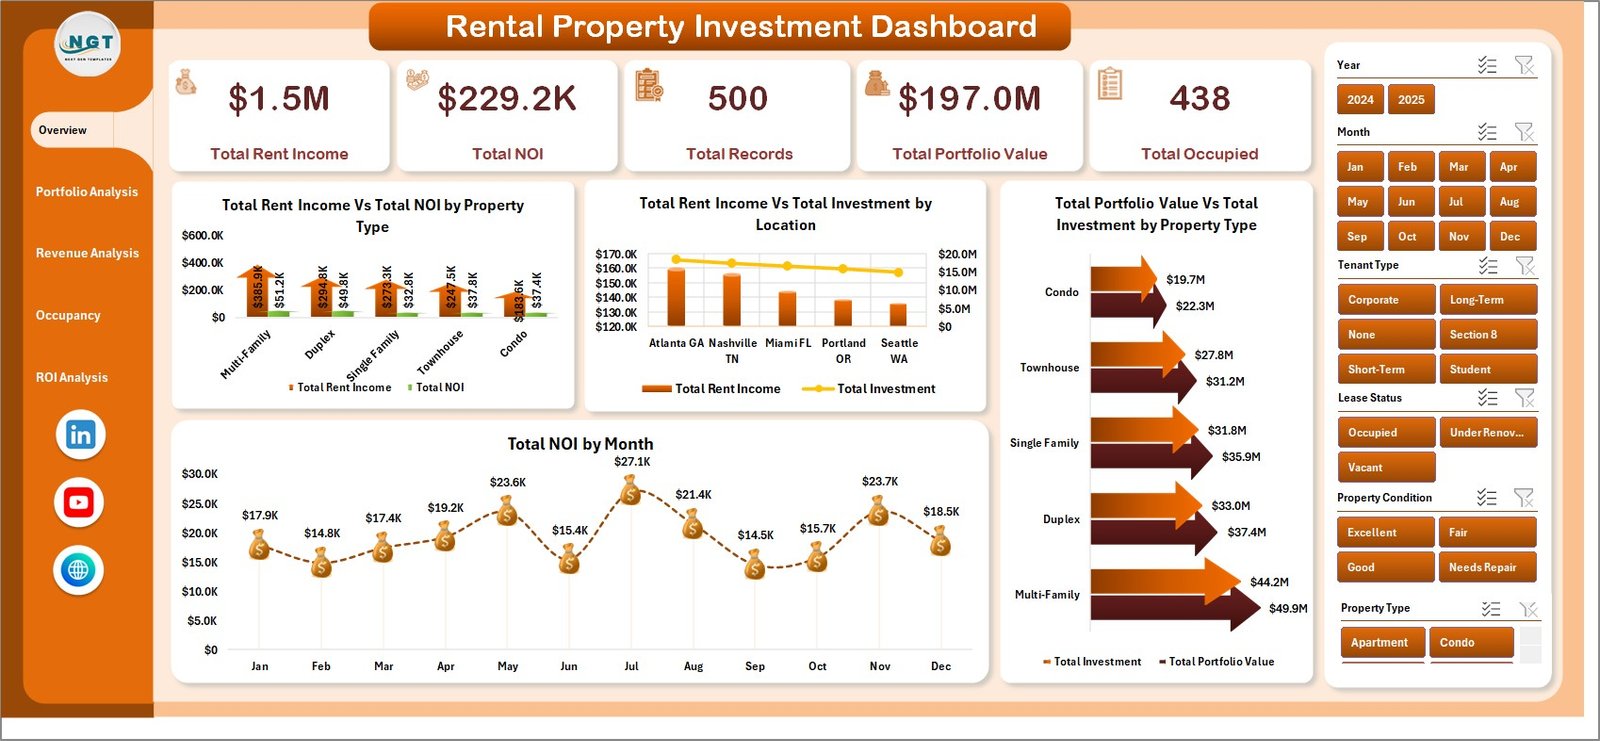
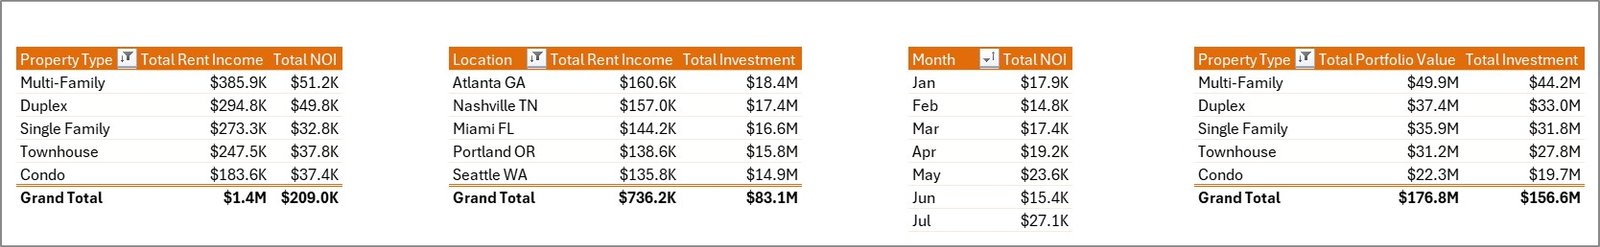
The Overview page serves as the main landing dashboard. At the top, you will find 5 high-level KPI cards displaying Total Rent Income, Total NOI, Total Records, Total Portfolio Value, and Total Occupied properties. Below the cards, 4 analytical charts provide deeper insights:
- Total Rent Income vs Total NOI by Property Type — Compare income against net operating income across different property categories to quickly identify which property types generate the highest margins.
- Total Rent Income vs Total Investment by Location — Evaluate how rental income stacks up against your capital investment in each geographic area.
- Total Portfolio Value vs Total Investment by Property Type — Understand your net asset position and how your portfolio value compares to the total capital deployed.
- Total NOI by Month — Monitor monthly NOI trends to spot seasonal patterns and plan your cash flow strategy accordingly.
- Click here to Purchase the Rental Property Investment Dashboard in Excel
Multiple slicers are available to filter the entire Overview page for focused analysis.
Rental Property Investment Dashboard in Excel2. Portfolio Analysis
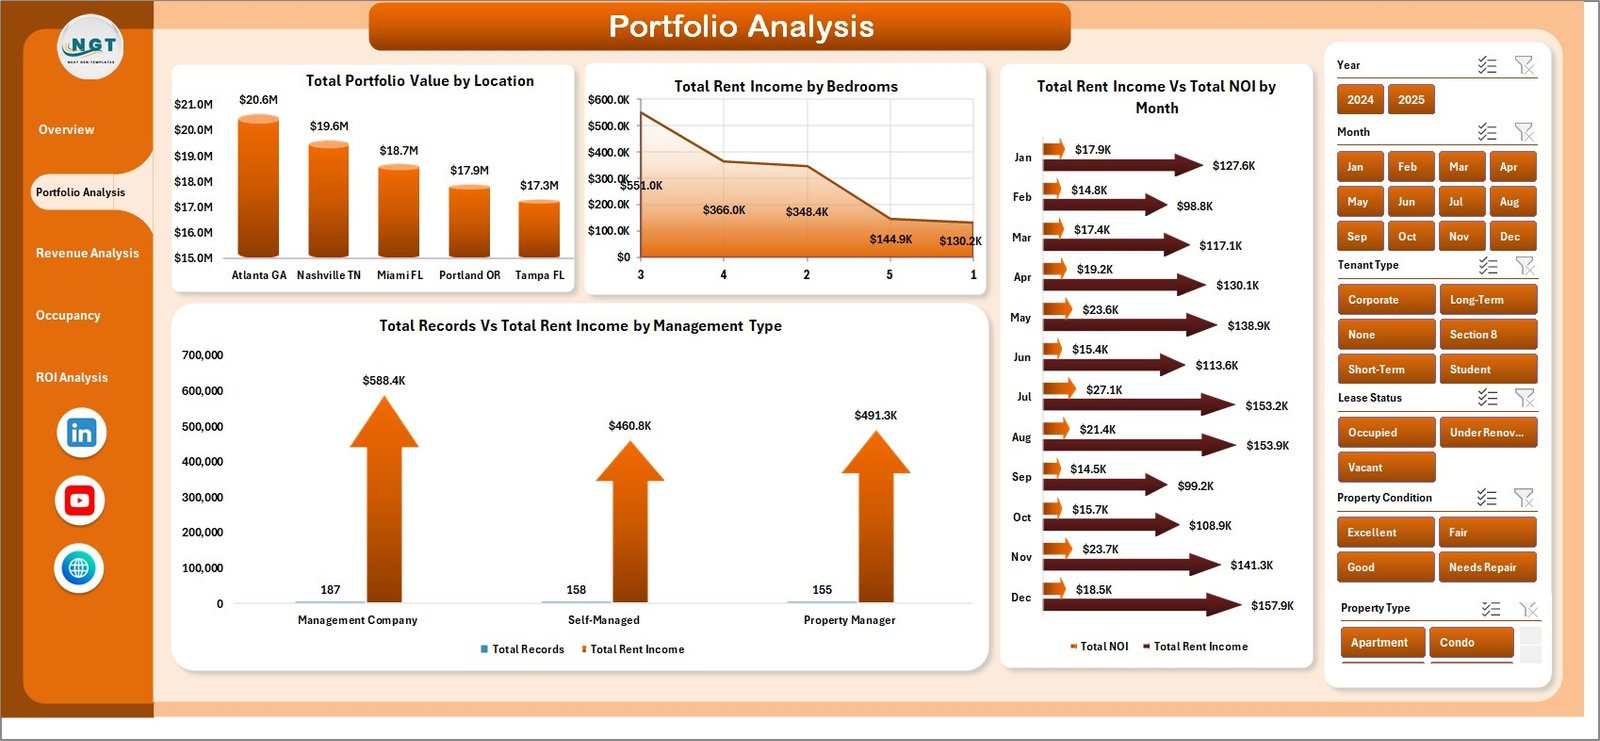
The Portfolio Analysis page dives deeper into your property portfolio structure and performance. It includes the following charts:
- Total Portfolio Value by Location — See how your portfolio value is distributed across different locations to assess geographic concentration risk.
- Total Rent Income by Bedrooms — Understand which bedroom configurations generate the most rental income.
- Total Rent Income vs Total NOI by Month — Track the relationship between gross income and net operating income over time.
- Total Records vs Total Rent Income by Management Type — Compare how different management approaches (self-managed, agency-managed, etc.) affect your property count and income.
 Portfolio Analysis
3. Revenue Analysis
The Revenue Analysis page helps you understand where your rental income comes from and how property conditions affect profitability:
- Total Rent Income by Tenant Type — Break down your income by tenant categories to see which tenant segments contribute the most.
- Total Rent Income vs Total Investment by Property Condition — Evaluate how properties in different conditions (excellent, good, fair, poor) perform relative to the capital invested.
- Total Records by Lease Status — Get a clear view of your active, expired, and pending lease statuses across the portfolio.
- Total NOI by Property Condition — Identify whether renovated or well-maintained properties deliver better net operating income.
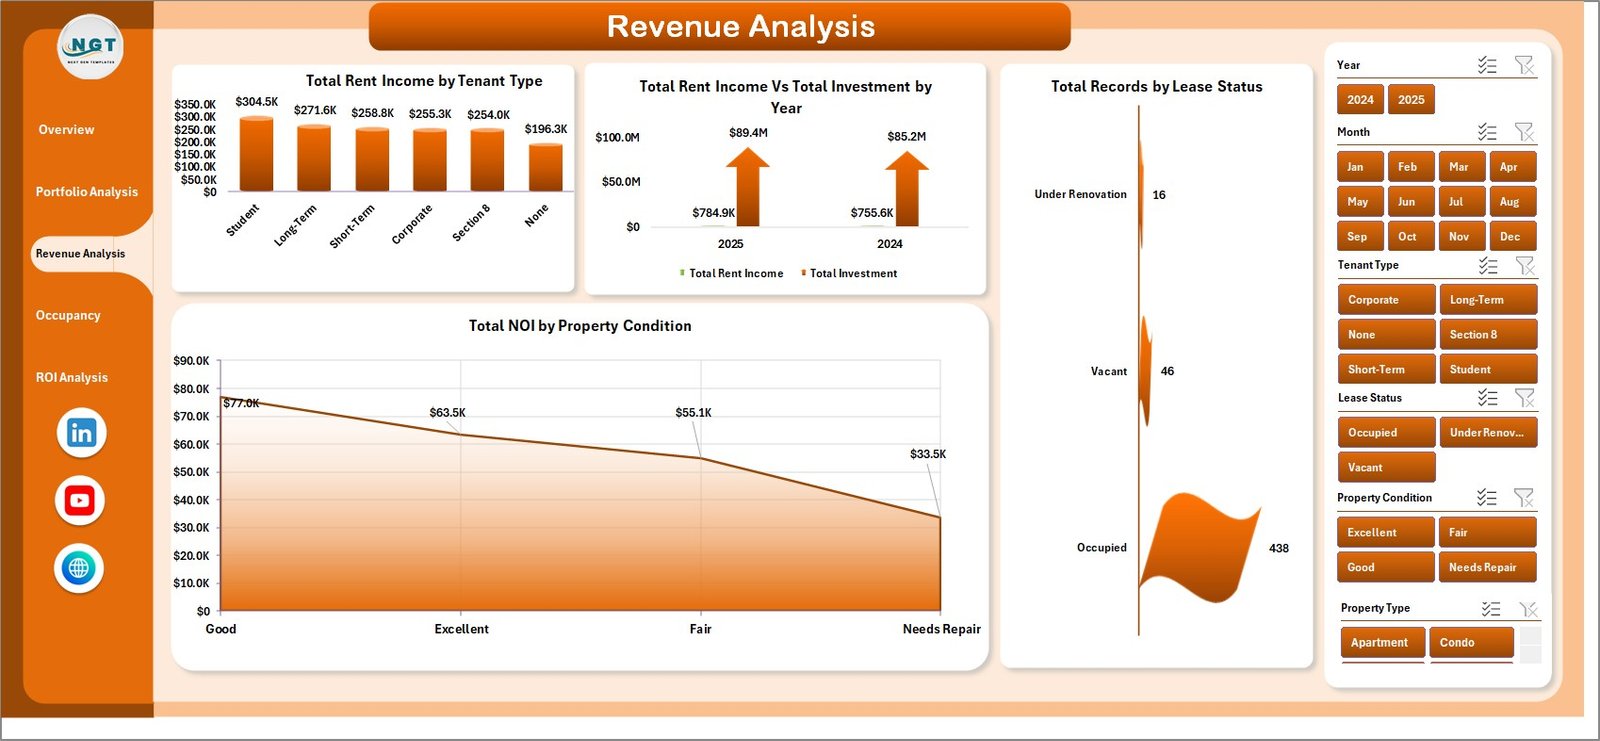 Revenue Analysis
4. Occupancy Tracker
The Occupancy Tracker page focuses on vacancy management and occupancy performance:
- Occupancy Rate % by Property Type — See which property types maintain the highest occupancy and which may need marketing attention.
- Avg. Vacancy Days by Location — Identify locations with longer vacancy periods so you can adjust pricing or marketing strategies.
- Return on Investment % by Property Type — Compare ROI performance across property categories to inform future investment decisions.
- Total Occupied vs Total Records by Month — Track the monthly trend of occupied properties against your total portfolio size.
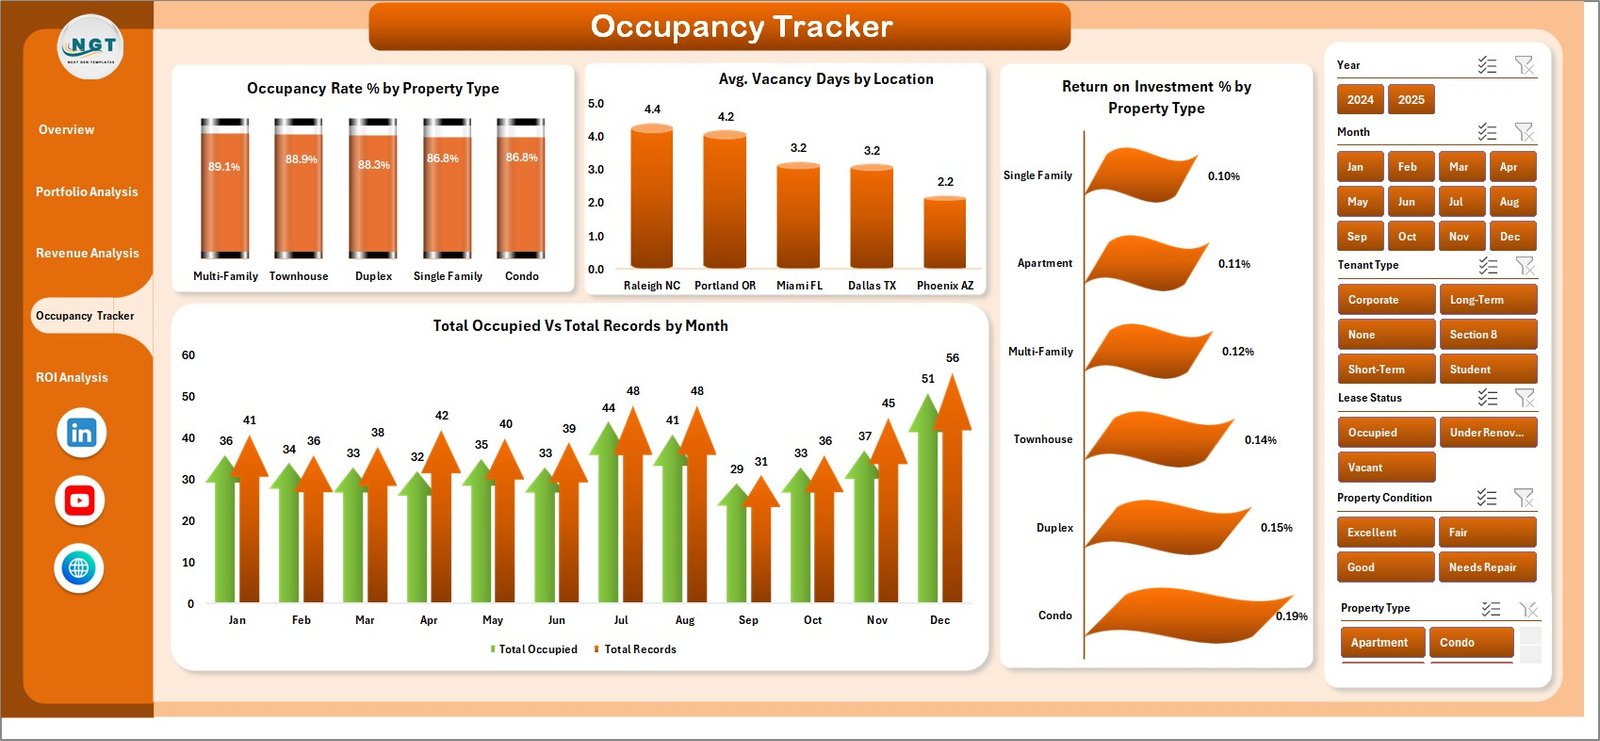 Occupancy Tracker
5. ROI Analysis
The ROI Analysis page provides investment return insights to help you optimize your property portfolio:
- Return on Investment % by Bedrooms — See which bedroom configurations deliver the best returns on your investment.
- Total Records by Bedrooms — Understand the distribution of your portfolio by bedroom count.
- Total Records by Month — Track how your portfolio size has grown over the months.
- Property Appreciation by Location — Evaluate which locations have seen the most property value growth.
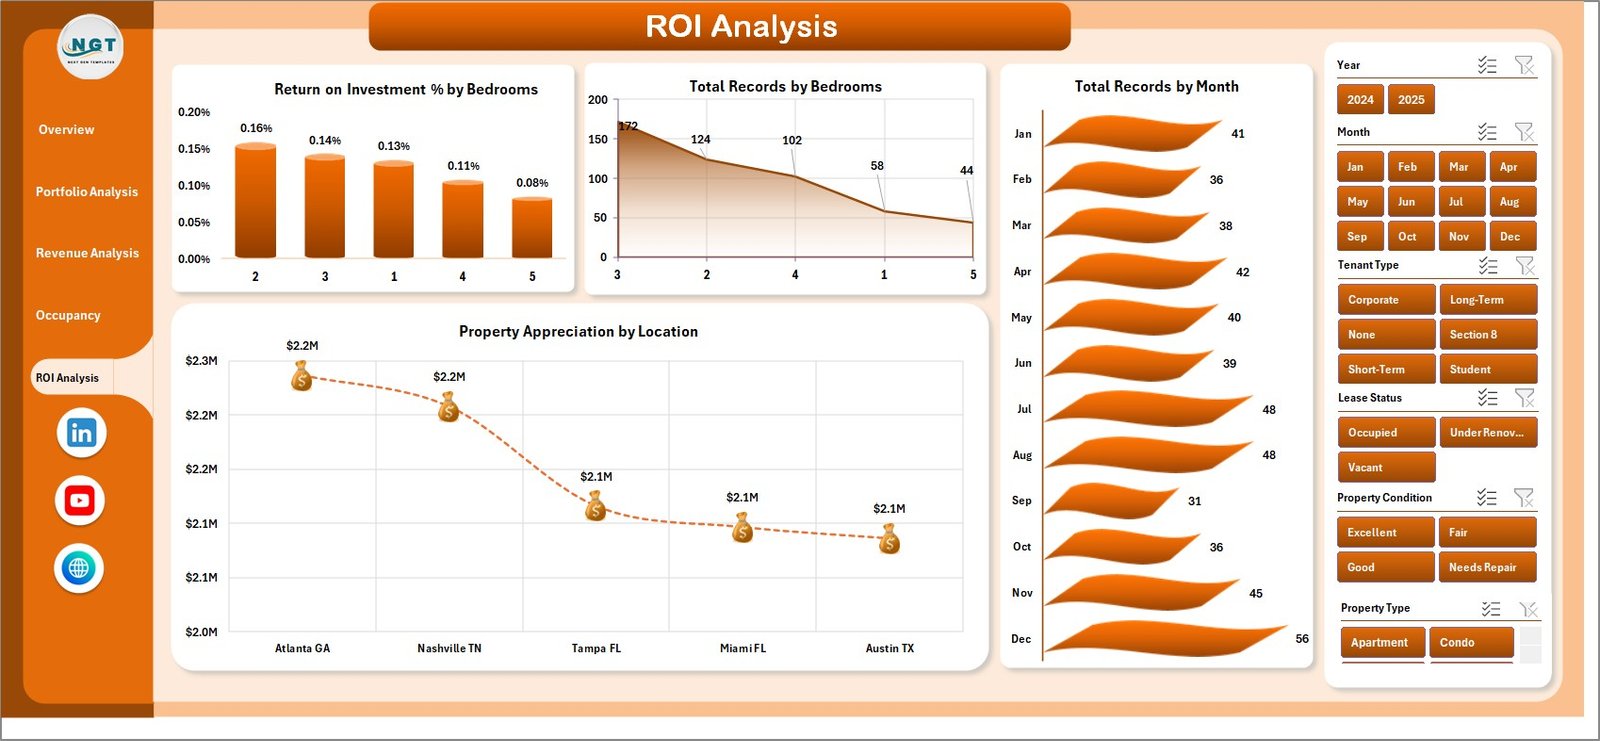 ROI Analysis
6. Data Sheet
The Data Sheet is where you input your rental property records. The template comes pre-loaded with sample data so you can see the dashboard in action immediately. Simply replace the sample data with your own property records, maintaining the same column format.
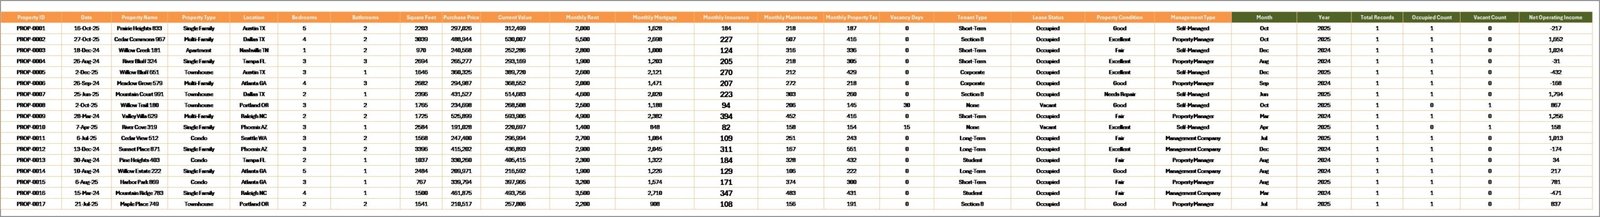 Data Sheet Tab
7. Support Sheet
The Support Sheet contains all the pivot tables that power the dashboard. After updating your data in the Data Sheet, navigate to the Data tab in the Excel Ribbon and click Refresh All. Every pivot table and chart across all 5 dashboard pages will update automatically. You can keep this sheet hidden for a cleaner workbook experience.
 Support Sheet Tab
Advantages of the Rental Property Investment Dashboard in Excel
- All-in-One Solution — Combines income tracking, occupancy management, ROI analysis, and portfolio valuation in a single workbook.
- No Coding Required — Built entirely with Excel pivot tables and charts, so there are no macros or VBA to enable.
- Instant Insights — KPI cards and charts give you a complete picture of your investment performance at a glance.
- Highly Customizable — Add new property records, adjust categories, and extend the data fields as your portfolio grows.
- Offline Access — Unlike cloud-based tools, this Excel dashboard works completely offline on your local machine.
- Professional Presentation — The clean, modern design is ready for investor meetings, portfolio reviews, and financial reporting.
- Click here to Purchase the Rental Property Investment Dashboard in Excel
Opportunities for Improvement
- Expense Breakdown — Adding a detailed expense tracking page for maintenance, insurance, taxes, and management fees could provide deeper NOI insights.
- Cash Flow Forecasting — A forward-looking cash flow projection model would help investors plan for upcoming expenses and revenue targets.
- Tenant Details Page — Including a tenant-level detail tracker with lease expiry alerts would enhance property management capabilities.
- Comparative Market Analysis — Adding market rental rate benchmarks would help investors evaluate whether their properties are priced competitively.
Best Practices for Using the Rental Property Investment Dashboard
- Update Data Monthly — Enter new rental records and occupancy data at the end of each month for the most accurate trend analysis.
- Always Click Refresh All — After updating the Data Sheet, go to the Data tab and click Refresh All to ensure all pivot tables and charts reflect the latest data.
- Use Slicers Strategically — Combine multiple slicers to create focused views, such as filtering by a specific location AND property type simultaneously.
- Keep the Support Sheet Hidden — Hide the Support Sheet for a cleaner experience, but remember it powers all the dashboard analytics.
- Back Up Your File — Save a backup copy before making major data changes to protect your historical analysis.
- Use Excel 2016 or Later — The dashboard is optimized for Excel 2016+ for full slicer and chart compatibility.
- Click here to Purchase the Rental Property Investment Dashboard in Excel
Explore Relevant Templates
If you are interested in real estate analytics, here are some related templates from NextGenTemplates that you might find useful:
- Real Estate Dashboard in Excel — A comprehensive real estate analytics dashboard covering property sales, market trends, and valuation metrics.
- Real Estate Valuation KPI Dashboard in Excel — Track property valuation KPIs with an interactive scorecard-style dashboard.
- Real Estate Investment Trusts (REITs) Dashboard in Excel — Analyze REIT performance, distributions, and investment returns in Excel.
- Real Estate Valuation Dashboard in Excel — A detailed property valuation analysis tool for real estate professionals.
- Office Space Leasing KPI Dashboard in Excel — Monitor office space leasing KPIs including occupancy, lease rates, and tenant retention.
- Click here to Purchase the Rental Property Investment Dashboard in Excel
Frequently Asked Questions
What is the best Excel template for tracking rental property investments?
The Rental Property Investment Dashboard in Excel from NextGenTemplates is one of the best Excel templates for tracking rental property investments. It includes 5 interactive dashboard pages covering rent income, NOI, occupancy, ROI, and portfolio valuation, all powered by automated pivot tables that update with a single click.
How do I track rental income and ROI in Excel?
You can track rental income and ROI in Excel using the Rental Property Investment Dashboard template. Enter your property data in the structured Data Sheet, and the dashboard automatically calculates and visualizes Total Rent Income, Return on Investment %, and Net Operating Income across all your properties with interactive charts and slicers.
Can I filter the dashboard by specific property type or location?
Yes. The dashboard includes interactive slicers on every page that let you filter data by Property Type, Location, Bedrooms, Management Type, Tenant Type, Lease Status, Property Condition, and Month for targeted analysis.
Do I need advanced Excel skills to use this rental property dashboard?
No advanced Excel skills are needed. Simply replace the sample data in the Data Sheet with your own rental property records and click Refresh All in the Data tab. All charts, KPI cards, and pivot tables update automatically without any formula editing.
How many KPIs does this rental property dashboard track?
The dashboard tracks 5 key performance indicators on the Overview page: Total Rent Income, Total NOI, Total Records, Total Portfolio Value, and Total Occupied. Additionally, it provides ROI percentages, occupancy rates, average vacancy days, and property appreciation metrics across the other 4 analysis pages.
Is this template compatible with Google Sheets?
This template is specifically designed for Microsoft Excel and leverages pivot tables and slicers. For Google Sheets alternatives, visit the Google Sheets Dashboard Templates collection on NextGenTemplates.
Conclusion
The Rental Property Investment Dashboard in Excel is an essential tool for anyone managing rental properties or building a real estate investment portfolio. With 5 interactive dashboard pages, automated pivot tables, and comprehensive analytics covering income, occupancy, ROI, and portfolio valuation, this template saves you hours of manual reporting while providing professional-grade insights.
Click here to Purchase the Rental Property Investment Dashboard in Excel
For more professional Excel dashboard templates, visit NextGenTemplates.com and explore our growing collection of ready-to-use analytics solutions for every industry.
Visit our YouTube channel for step-by-step video tutorials:
Youtube.com/@PK-AnExcelExpert