Running a restaurant or food service business without clear data insights feels like driving without a dashboard. You may see sales coming in, costs going out, and customers leaving feedback. However, without a structured view, you cannot clearly understand what works, what fails, and where profits actually come from. That is exactly why a Restaurants and Food Services Dashboard in Power BI plays a critical role in modern restaurant management.
In this detailed and practical article, you will learn what a Restaurants and Food Services Dashboard in Power BI is, why it matters, how it works, and how each page of the dashboard supports better decision-making. Moreover, this guide explains advantages, best practices, real-world use cases, and frequently asked questions in simple language. As a result, you can easily apply these concepts to your own restaurant analytics strategy.
Click to Purchases Restaurants and Food Services Dashboard in Power BI
What Is a Restaurants and Food Services Dashboard in Power BI?
A Restaurants and Food Services Dashboard in Power BI is an interactive analytics and reporting solution designed to track restaurant performance in one centralized visual report.
Instead of managing sales data, cost sheets, customer feedback, and monthly reports separately, this dashboard combines all critical restaurant KPIs into a single Power BI file. Consequently, managers, owners, and analysts can monitor performance instantly.
This dashboard typically connects to structured data sources such as Excel, databases, or POS systems. Then, Power BI transforms that data into interactive visuals like cards, charts, and slicers. As a result, users can filter data by restaurant, food category, city, or time period without writing formulas.
Why Do Restaurants and Food Services Need a Power BI Dashboard?
Restaurants operate in a fast-moving and competitive environment. Therefore, relying on static reports or manual Excel tracking slows down decision-making. A Power BI dashboard solves this problem effectively.
Key Reasons Restaurants Need This Dashboard
-
Restaurants manage multiple revenue streams such as dine-in, takeaway, and delivery.
-
Food costs fluctuate due to supplier pricing and seasonal changes.
-
Customer preferences change frequently across cities and locations.
-
Profit margins vary by food category and restaurant branch.
-
Monthly and seasonal trends directly impact planning and staffing.
Because of these challenges, a Restaurants and Food Services Dashboard in Power BI provides clarity, speed, and control.
How Does a Restaurants and Food Services Dashboard in Power BI Work?
The dashboard works through a structured and logical flow.
First, you collect raw data such as sales transactions, cost records, customer ratings, restaurant names, food categories, cities, and dates.
Next, you clean and model this data in Power BI using relationships, measures, and calculated columns.
After that, Power BI converts the data into interactive visuals. Users then interact with slicers to filter insights dynamically. As a result, every chart updates instantly.
Most importantly, the dashboard remains easy to maintain. Once data updates, visuals refresh automatically. Therefore, teams save time and reduce manual effort.
Key Features of Restaurants and Food Services Dashboard in Power BI
This dashboard includes five powerful analytical pages, each designed to answer specific business questions. Let us explore each page in detail.
What Does the Overview Page Show in the Dashboard?
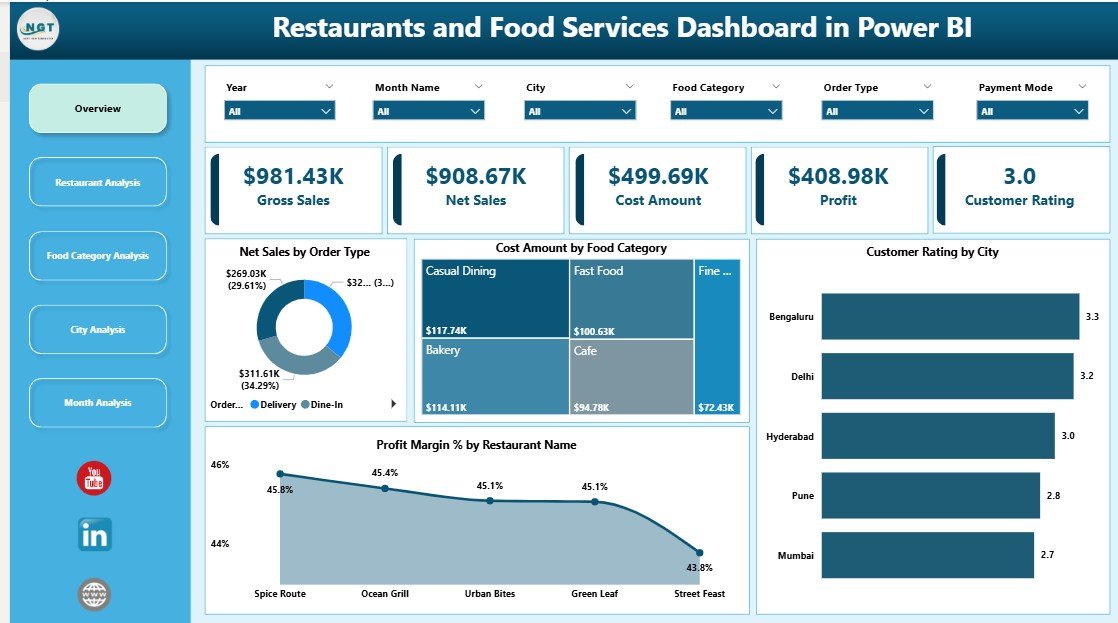
The Overview Page acts as the executive summary of the entire dashboard. This page gives decision-makers a quick snapshot of overall restaurant performance.
Key Elements of the Overview Page
-
Interactive Slicers
-
Filter data by restaurant, city, food category, or time period.
-
Instantly update all visuals on the page.
-
-
KPI Cards
-
Highlight high-level metrics at a glance.
-
Help leaders understand performance within seconds.
-
Charts on the Overview Page
-
Net Sales by Order Type
-
Compares sales from dine-in, takeaway, and delivery.
-
Helps identify the most profitable order channel.
-
-
Cost Amount by Food Category
-
Shows where the highest costs occur.
-
Supports cost control and menu optimization.
-
-
Customer Rating by City
-
Reveals customer satisfaction across locations.
-
Highlights cities that need service improvement.
-
-
Profit Margin % by Restaurant Name
-
Compares profitability across restaurant branches.
-
Helps prioritize high-performing locations.
-
Because this page summarizes everything, managers can make quick decisions without deep analysis.
Click to Purchases Restaurants and Food Services Dashboard in Power BI
How Does the Restaurant Analysis Page Improve Branch Performance?
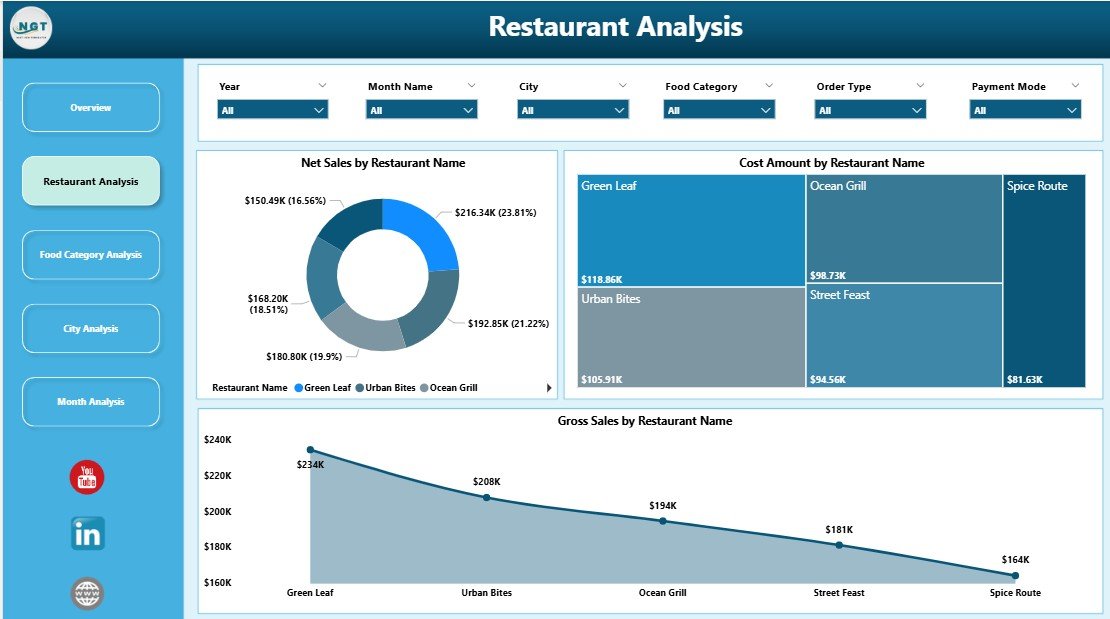
The Restaurant Analysis Page focuses on performance at the individual restaurant level. This page helps managers compare branches side by side.
Key Insights from Restaurant Analysis
-
Identify top-performing restaurants.
-
Detect underperforming branches quickly.
-
Understand revenue and cost differences across locations.
Charts on the Restaurant Analysis Page
-
Net Sales by Restaurant Name
-
Shows which restaurants generate the highest revenue.
-
Supports performance benchmarking.
-
-
Cost Amount by Restaurant Name
-
Highlights cost-heavy branches.
-
Helps investigate operational inefficiencies.
-
-
Gross Sales by Restaurant Name
-
Displays overall sales volume.
-
Supports capacity and demand analysis.
-
As a result, restaurant owners can take targeted actions instead of applying generic strategies.
Why Is Food Category Analysis Important in Restaurants?
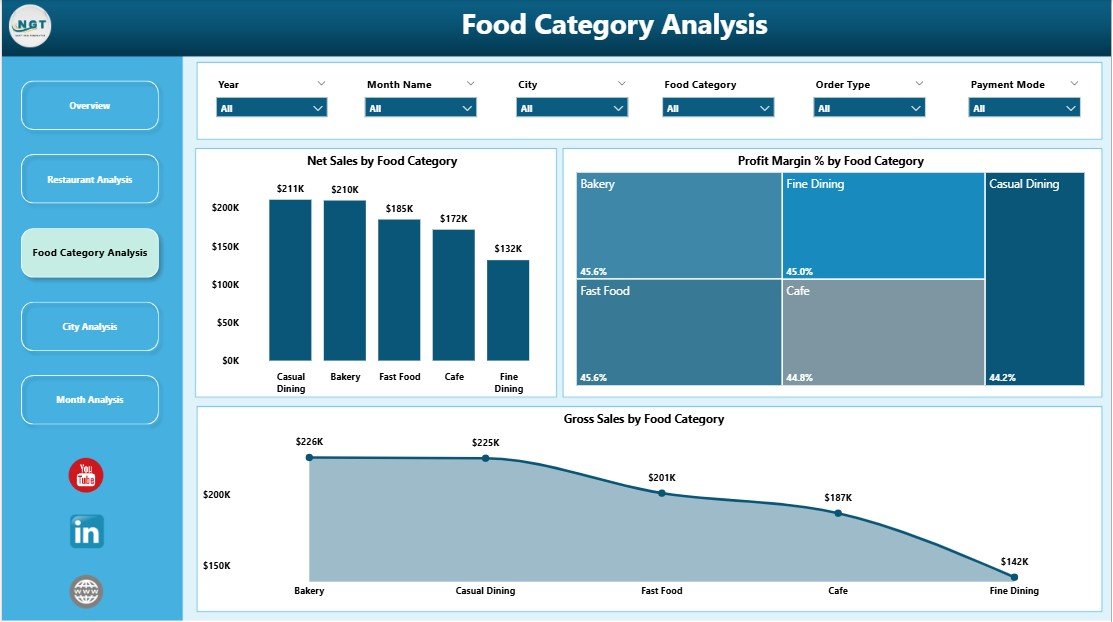
Food category performance directly affects profitability. Therefore, the Food Category Analysis Page plays a vital role in menu optimization.
Benefits of Food Category Analysis
-
Understand which food categories drive revenue.
-
Identify categories with low profit margins.
-
Optimize menu offerings and pricing strategies.
Charts on the Food Category Analysis Page
-
Net Sales by Food Category
-
Highlights best-selling categories.
-
Supports promotional planning.
-
-
Profit Margin % by Food Category
-
Identifies high-margin and low-margin items.
-
Helps remove or improve low-performing items.
-
-
Gross Sales by Food Category
-
Shows volume contribution of each category.
-
Supports inventory planning.
-
Because of this analysis, restaurants can focus on profitable menu items and control food costs effectively.
Click to Purchases Restaurants and Food Services Dashboard in Power BI
How Does the City Analysis Page Support Location-Based Decisions?
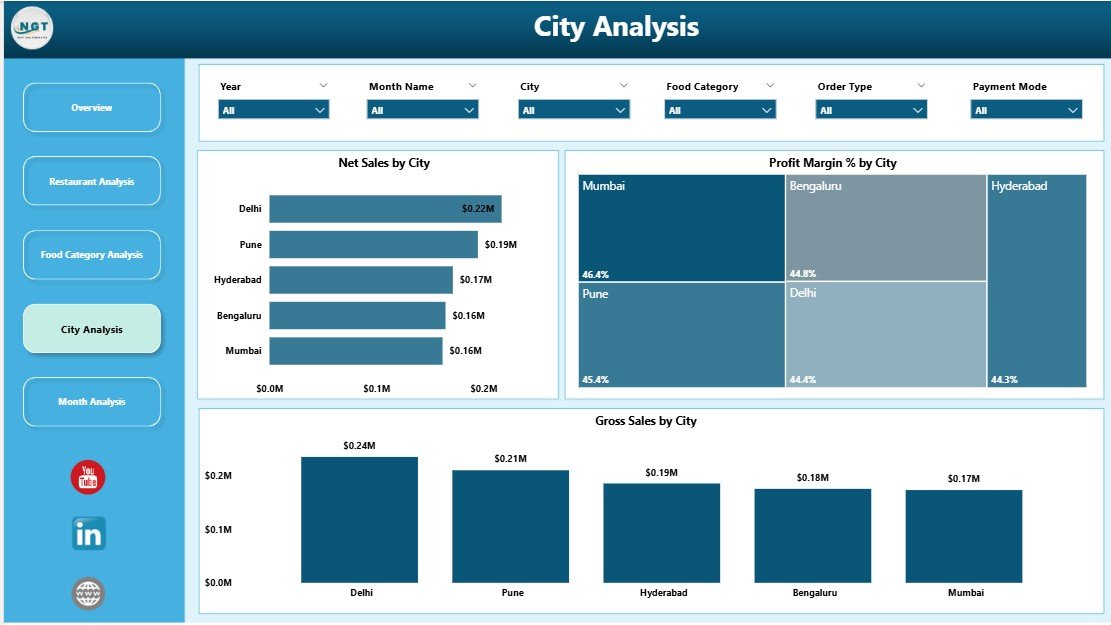
Restaurants often operate in multiple cities. Customer behavior, costs, and sales vary by location. Therefore, the City Analysis Page provides critical geographic insights.
Why City Analysis Matters
-
Customer preferences differ across cities.
-
Costs vary due to rent and supplier pricing.
-
Demand patterns change by region.
Charts on the City Analysis Page
-
Net Sales by City
-
Shows which cities generate the most revenue.
-
Helps prioritize expansion or marketing efforts.
-
-
Profit Margin % by City
-
Highlights profitable and low-profit cities.
-
Supports pricing and cost adjustments.
-
-
Gross Sales by City
-
Displays overall sales volume.
-
Helps plan staffing and logistics.
-
As a result, management can tailor strategies for each city instead of using a one-size-fits-all approach.
What Insights Does the Monthly Trends Page Provide?
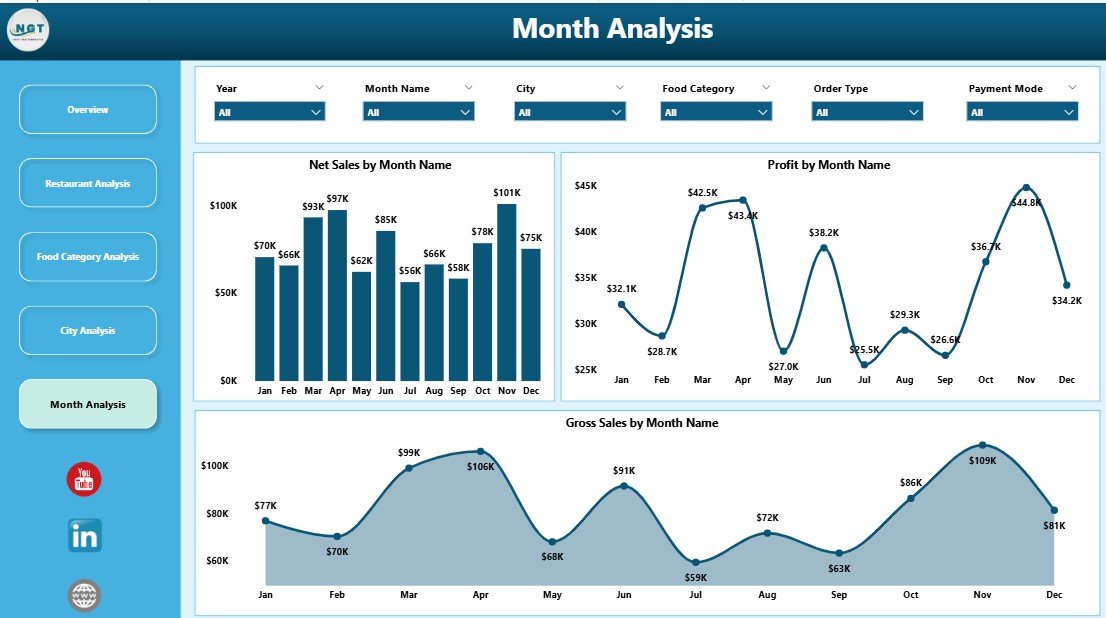
Trends over time reveal patterns that daily data cannot show. Therefore, the Monthly Trends Page focuses on performance changes across months.
Importance of Monthly Trend Analysis
-
Identify seasonal peaks and slow periods.
-
Track growth or decline over time.
-
Support forecasting and budgeting.
Charts on the Monthly Trends Page
-
Net Sales by Month
-
Shows revenue trends.
-
Helps plan promotions during slow months.
-
-
Profit by Month
-
Tracks profitability trends.
-
Highlights months with margin pressure.
-
-
Gross Sales by Month
-
Displays sales volume changes.
-
Supports inventory and staffing planning.
-
Because of this page, restaurants can plan proactively instead of reacting late.
Advantages of Restaurants and Food Services Dashboard in Power BI
Using a Restaurants and Food Services Dashboard in Power BI delivers measurable business value.
Click to Purchases Restaurants and Food Services Dashboard in Power BI
Key Advantages
-
Centralized Data Visibility
-
All metrics appear in one dashboard.
-
No need to switch between reports.
-
-
Real-Time Insights
-
Updated data reflects instantly.
-
Faster decision-making becomes possible.
-
-
Interactive Analysis
-
Slicers allow deep exploration.
-
Users analyze data without technical skills.
-
-
Improved Profitability
-
Identify high-margin items and locations.
-
Control costs more effectively.
-
-
Scalability
-
Easily add new restaurants or cities.
-
Dashboard grows with the business.
-
Therefore, this dashboard supports both daily operations and long-term strategy.
Best Practices for the Restaurants and Food Services Dashboard in Power BI
To maximize the value of your dashboard, you must follow proven best practices.
Data Preparation Best Practices
-
Use clean and structured data.
-
Maintain consistent naming conventions.
-
Validate sales and cost figures regularly.
Dashboard Design Best Practices
-
Keep visuals simple and focused.
-
Use consistent color themes.
-
Avoid clutter and unnecessary charts.
Performance Best Practices
-
Optimize data models.
-
Use measures instead of calculated columns where possible.
-
Limit unnecessary visuals on each page.
User Adoption Best Practices
-
Train users on slicers and filters.
-
Create clear page navigation.
-
Document KPI definitions.
By following these best practices, you ensure long-term dashboard success.
Who Can Benefit from a Restaurants and Food Services Dashboard in Power BI?
This dashboard benefits multiple roles within the food service industry.
-
Restaurant owners
-
Regional managers
-
Operations teams
-
Finance and accounting teams
-
Business analysts
-
Franchise managers
Each stakeholder gains insights relevant to their responsibilities.
How Does This Dashboard Support Better Decision-Making?
Better decisions come from better insights. This dashboard supports decision-making by:
-
Highlighting performance gaps quickly
-
Comparing branches, cities, and categories
-
Revealing trends and patterns clearly
-
Supporting data-driven discussions
As a result, leaders act with confidence instead of assumptions.
Common Challenges and How This Dashboard Solves Them
Challenge: Scattered Data Sources
Solution: Centralized Power BI model
Challenge: Slow Reporting
Solution: Automated refresh and visuals
Challenge: Low Visibility into Profit Margins
Solution: Profit margin analysis by restaurant, city, and category
Challenge: Reactive Decisions
Solution: Trend analysis and proactive planning
Click to Purchases Restaurants and Food Services Dashboard in Power BI
Conclusion: Why Restaurants Should Adopt a Power BI Dashboard
A Restaurants and Food Services Dashboard in Power BI transforms raw restaurant data into actionable insights. It helps businesses understand sales performance, control costs, improve customer satisfaction, and increase profitability.
Because the dashboard combines overview insights with deep analysis across restaurants, food categories, cities, and months, it becomes an essential tool for modern restaurant management. Moreover, its interactive nature empowers teams to explore data independently.
If you want clarity, speed, and smarter decisions, this dashboard becomes a must-have solution for your restaurant business.
Frequently Asked Questions (FAQs)
What is a Restaurants and Food Services Dashboard in Power BI used for?
It tracks sales, costs, profit margins, and customer ratings across restaurants, food categories, cities, and time periods in one interactive report.
Can this dashboard work with Excel data?
Yes, Power BI easily connects to Excel files and refreshes data automatically.
Do I need technical skills to use this dashboard?
No, users interact through slicers and visuals without writing formulas or code.
Can I customize KPIs and charts?
Yes, you can add or modify KPIs, measures, and visuals based on business needs.
Is this dashboard suitable for small restaurants?
Yes, both small and large food service businesses can benefit from this dashboard.
How often should data refresh occur?
You can refresh data daily, weekly, or in real time depending on your data source.
Can this dashboard support multiple cities and branches?
Yes, it scales easily to include multiple restaurants and cities.
Does this dashboard help improve profitability?
Yes, it highlights high-margin areas and cost inefficiencies clearly.
Visit our YouTube channel to learn step-by-step video tutorials